Recent reports have demonstrated the adverse effects of venous congestion on renal function (RF) and challenged the assumption that worsening RF is driven by decreased cardiac output (CO). We hypothesized that diuresis in patients with right ventricular (RV) dysfunction, despite decreased CO, would lead to a decrease in venous congestion and resultant improvement in RF. We reviewed consecutive admissions with a discharge diagnosis of heart failure. RV function was assessed by multiple echocardiographic methods and those with ≥2 measurements of RV dysfunction were considered to have significant RV dysfunction. Worsening RF was defined as an increase in creatinine of ≥0.3 mg/dl and improved RF as improvement in glomerular filtration rate ≥25%. A total of 141 admissions met eligibility criteria; 34% developed worsening RF. Venous congestion was more common in those with RV dysfunction (odds ratio [OR] 3.3, p = 0.009). All measurements of RV dysfunction excluding RV dilation correlated with CO (p <0.05). Significant RV dysfunction predicted a lower incidence of worsening RF (OR 0.21, p <0.001) and a higher incidence of improved RF (OR 6.4, p <0.001). CO emerged as a significant predictor of change in glomerular filtration rate during hospitalization in those without significant RV dysfunction (r = 0.38, p <0.001). In conclusion, RV dysfunction is a strong predictor of improved renal outcomes in patients with acute decompensated heart failure, an effect likely mediated by relief of venous congestion.
Right ventricular (RV) dysfunction is often associated with decreased cardiac output (CO), venous congestion, and a poor prognosis. We hypothesized that diuresis in patients with decompensated heart failure (HF) and RV dysfunction, despite a decreased CO, would lead to a decrease in venous congestion and resultant improvement in renal function (RF). In addition, we hypothesized that the improvement in RF seen in these patients may explain the previously reported lack of association between CO and RF observed in unselected populations.
Methods
We reviewed consecutive admissions to the clinical cardiology or internal medicine services at the Hospital of the University of Pennsylvania (Philadelphia, Pennsylvania) with a primary discharge diagnosis of HF from December 1, 2004 to December 1, 2007. Study inclusion criteria were visualization of the right ventricle and inferior vena cava during echocardiography within 48 hours of admission, admission B-type natriuretic peptide >400 pg/ml, intravenous loop diuretic administration ≥50% of initial hospital stay, and a length of admission 3 to 10 days. Exclusion criteria were renal replacement therapy, intravenous inotrope administration, or lack of admission or discharge serum creatinine level. Admissions to subspecialty HF or interventional services were excluded to avoid a predominantly stage D population or confounding from contrast nephropathy, respectively. Institutional review board approval was obtained for the study.
Maximum diuretic dose was defined as the greatest total number of furosemide equivalents in 1 day. Glomerular filtration rate was calculated by the Modified Diet and Renal Disease equation. Improved RF was defined as an improvement in glomerular filtration rate of ≥25% from admission to discharge. To maintain consistency with other publications on the subject of worsening RF, this variable was defined as an increase in serum creatinine level ≥0.3 mg/dl above admission value.
Echocardiography was performed for clinical indications at the request of the treating physician. Due to the complex geometry and lack of accepted standard for echocardiographic evaluation of RV function, 4 different measurements were obtained: fractional area change, tricuspid annular plane systolic excursion, qualitative RV (qRV) dilation, and 2-dimensional qRV dysfunction. Tricuspid annular plane systolic excursion and fractional area change were measured in the apical 4-chamber view by a single experienced echocardiographer blinded to the study outcomes. Values for tricuspid annular plane systolic excursion and fractional area change were divided into quartiles and the bottom quartile used to represent significant RV dysfunction. Qualitative measurements of RV size and function were estimated from multiple views and graded as normal, mild, moderate, and severe dysfunction or dilation at the time of clinical read by experienced level III certified echocardiographers. Values of moderate and severe were used to represent significant RV dysfunction for these variables. A composite variable (composite RV dysfunction) describing RV dysfunction was generated and defined as ≥2 positive measurements of significant RV dysfunction.
The inferior vena cava was imaged from the subcostal view while patients were asked to rapidly inhale or “sniff” during image acquisition. Inspiratory inferior vena cava collapse was classified as complete, <50%, >50%, or no collapse. Early peak mitral inflow velocity, early septal and lateral annular tissue Doppler velocities, left ventricular outflow tract diameter, and left ventricular outflow tract time velocity integral were measured. All 2-dimensional and color Doppler parameters were visually estimated at the time of clinical read. Each spectral echocardiographic parameter was measured and averaged from ≥3 cardiac cycles in patients in sinus rhythm and from 5 cycles in patients with atrial fibrillation. CO was calculated using the equation 0.785 × (left ventricular outflow tract diameter) 2 × (left ventricular outflow tract time velocity integral).
Values are reported as median with interquartile range (25th percentile to 75th percentile), mean ± SD, and percentile value for nonparametric, parametric, and categorical variables, respectively. One-way analysis of variance, Kruskal-Wallis, independent Student’s t test, or Mann-Whitney U test was used to compare means of independent continuous variables. Pearson chi-square or Fisher’s exact test (when expected frequencies were <5) were used to evaluate categorical variables. Correlation values reported are Pearson for parametric data and Spearman for nonparametric data. All baseline variables were tested for association and included in multivariate regression modeling with backward elimination if the p value was <0.1. Independence of individual RV function parameters was determined with a backward elimination multivariate regression model. Determination of R 2 change for addition of inspiratory inferior vena cava collapse to a model containing qRV dilation was based on a hierarchal regression analysis. Statistical analysis was performed with SPSS 17.0 (SPSS, Inc., Chicago, Illinois) and significance was defined as a 2-tailed p value <0.05.
Results
A total of 141 admissions met eligibility criteria: 33 from the general cardiology service and 108 from the medicine service. For the cohort as a whole, median length of hospital stay was 5 days (4 to 7), median time to peak creatinine level was 3 days (2 to 5), and median left ventricular ejection fraction was 24% (15 to 47). Left ventricular ejection fraction ≥50% was present in 23% of the cohort. Worsening RF occurred in 34% of the total population. Significant RV dysfunction, defined by the composite variable (composite RV dysfunction), was present in 35% of the population.
Overall, the group with composite RV dysfunction had several worse measurements of disease severity including lower CO, lower left ventricular ejection fraction, higher loop diuretic doses, increased severity of tricuspid regurgitation, and higher B-type natriuretic peptide levels ( Table 1 ). All measurements of RV dysfunction correlated internally ( Table 2 ). Admission glomerular filtration rate was higher in the group with RV dysfunction; however, median creatinine level was not significantly different ( Table 1 ). Those with composite RV dysfunction had an increased incidence of venous congestion evidenced by lack of inspiratory inferior vena cava collapse (odds ratio [OR] 3.3, p = 0.009).
| Variable | RV Dysfunction | p Value | |
|---|---|---|---|
| No (n = 92) | Yes (n = 49) | ||
| Age (years) | 63 ± 16 | 61 ± 17 | 0.56 |
| African-American | 75 (82%) | 34 (69%) | 0.1 |
| Men | 46 (47%) | 30 (61%) | 0.1 |
| Systolic blood pressure (mm Hg) | 149 ± 31 | 145 ± 34 | 0.49 |
| Heart rate (beats/min) | 80 ± 17 | 85 ± 12 | 0.06 |
| General medical service | 71 (77%) | 36 (75%) | 0.77 |
| Volume overload on chest x-ray | 46 (71%) | 22 (65%) | 0.54 |
| Hemoglobin (g/dl) | 11.9 ± 2.0 | 12.7 ± 2.4 | 0.02 ⁎ |
| Detectable troponin I | 19 (21%) | 16 (33%) | 0.12 |
| Serum urea nitrogen (mg/dl) | 19 (14–28) | 25 (18–33) | 0.07 |
| Serum sodium (mg/dl) | 140 ± 5.2 | 138 ± 4.6 | 0.13 |
| Admission glomerular filtration rate (ml/min/1.73 m 2 ) | 59.6 ± 29.4 | 70.4 ± 22.8 | 0.03 ⁎ |
| Admission serum creatinine (mg/dl) | 1.3 (1.0–1.5) | 1.2 (1.0–1.7) | 0.98 |
| B-type natriuretic peptide (pg/dl) | 1,279 (861–2,299) | 1,987 (1,042–4,000) | 0.003 ⁎ |
| Maximum diuretic dose (mg/day) | 80 (80–160) | 120 (80–200) | 0.03 ⁎ |
| Thiazide use | 12 (13%) | 7 (14%) | 0.84 |
| Net fluid out (L) | 3.9 (1.4–5.9) | 4.5 (1.5–8.5) | 0.28 |
| Length of stay (days) | 4 (3.3–6.0) | 6 (4.0–8.0) | 0.02 ⁎ |
| Peak creatinine (days) | 4 (3–5) | 2 (2–6) | 0.11 |
| Ejection fraction (%) | 33 (16–55) | 20 (10–29) | <0.001 ⁎ |
| Early peak mitral inflow velocity/early peak annular tissue velocity (septal) | 17.7 ± 8.3 | 19.7 ± 12.2 | 0.35 |
| Early peak mitral inflow velocity/early peak annular tissue velocity (lateral) | 12.1 ± 5.6 | 12.6 ± 8.3 | 0.68 |
| Cardiac output (L/min) | 4.9 ± 1.8 | 4.0 ± 1.7 | 0.01 ⁎ |
| Left atrial size (cm) | 4.7 ± 0.7 | 4.9 ± 0.8 | 0.13 |
| Moderate or severe tricuspid regurgitation | 37 (40%) | 29 (59%) | 0.03 ⁎ |
| Lack of inspiratory inferior vena cava collapse | 9 (10%) | 13 (27%) | 0.009 ⁎ |
| Variables | Tricuspid Annular Plane Systolic Excursion | RV Fractional Area Change | qRV Function | qRV Dilation | Inspiratory Inferior Vena Cava Collapse |
|---|---|---|---|---|---|
| Tricuspid annular plane systolic excursion (n = 130) | r = 0.39 | r = 0.47 | r = 0.36 | r = −0.34 | |
| Right ventricular fractional area change (n = 133) | r = 0.39 | r = 0.55 | r = 0.45 | r = −0.24 | |
| Qualitative right ventricular function (n = 140) | r = 0.47 | r = 0.55 | r = 0.60 | r = −0.42 | |
| Qualitative right ventricular dilation (n = 139) | r = 0.36 | r = 0.45 | r = 0.60 | r = −0.42 | |
| Inspiratory inferior vena cava collapse (n = 141) | r = −0.34 | r = −0.24 | r = −0.42 | r = −0.42 |
Despite a general trend toward worse indexes of disease severity ( Table 1 ), the group with composite RV dysfunction had a net improvement in glomerular filtration rate during hospitalization, whereas those without composite RV dysfunction had a deterioration in RF (7.2%, −6.5 to 21.6, vs −8.8%, −17.0 to 7.0, p <0.0001). Improved RF (defined as a 25% improvement in glomerular filtration rate) occurred more frequently in those with composite RV dysfunction (22.4% vs 4.3%, OR 6.4, p <0.001). Similar trends were found with the individual components of the composite RV dysfunction variable (qRV dysfunction OR 3.3, p = 0.01; qRV dilation OR 5.8, p = 0.001; tricuspid annular plane systolic excursion OR 4.3, p = 0.01; fractional area change OR 2.6, p = 0.11) and the incidence of improved RF increased with each incremental positive measurement of RV dysfunction ( Figure 1 ). Notably, this association was most pronounced for those with severe qRV dilatation (OR 15.3, p <0.001). Lack of inspiratory collapse of the inferior vena cava correlated with all measurements of RV function ( Table 2 ) and predicted improved RF (OR 6.5, p <0.001).
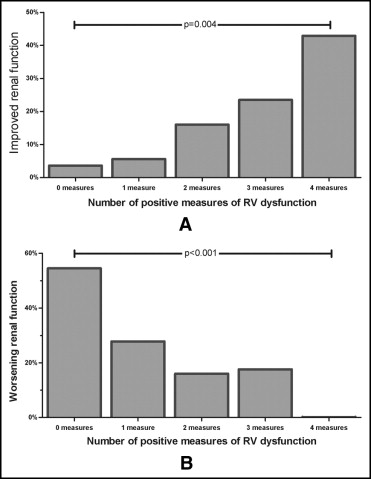
Worsening RF was significantly less common in those with RV dysfunction, occurring in 14.3% of those with versus 44.6% of those without composite RV dysfunction (OR 0.21, p <0.001). The median decrease in admission to nadir glomerular filtration rate was less in those with composite RV dysfunction (−9.6%, 0.0 to 19, vs −15.6%, 6.2 to 26, p = 0.008). Similar trends were found for the individual components of composite RV dysfunction (qRV dysfunction OR 0.19, p <0.0001; qRV dilation OR 0.27, p = 0.004; tricuspid annular plane systolic excursion OR 0.28, p = 0.01; fractional area change OR 0.44, p = 0.08), and the incidence of worsening RF decreased with each incremental positive measurement of RV dysfunction ( Figure 1 ). Similarly, lack of inspiratory inferior vena cava collapse was associated with significantly less worsening RF (OR 0.26, p = 0.028). Of the patients who developed worsening RF, recovery of RF to admission level was significantly more common in the group with composite RV dysfunction (OR 5.5, p = 0.03).
Using multivariate regression analysis, composite RV dysfunction remained a significant predictor of change in glomerular filtration rate after controlling for heart rate, hemoglobin, admission serum urea nitrogen, B-type natriuretic peptide level, diuretic dose, length of stay, ejection fraction, CO, tricuspid regurgitation severity, and inferior vena cava inspiratory collapse (p <0.003). Multivariate analysis of all individual measurements of RV function demonstrated qRV dilation to be the only independent predictor for changes in renal function (p <0.001). Supporting venous congestion as the driving factor between RV dysfunction and RF, there was minimal improvement in model performance when inspiratory inferior vena cava collapse was added to a model containing qRV dilation (R 2 change 0.018, p = 0.08).
In the overall cohort, CO was not correlated with admission glomerular filtration rate (r = −0.06, p = 0.48), admission to nadir change in glomerular filtration rate (r = −0.01, p = 0.91), or change in glomerular filtration rate from admission to discharge (r = 0.04, p = 0.60). CO was similar in those with or without worsening RF ( Table 3 , Figure 2 ) or improved RF (4.6 ± 3.0 vs 4.6 ± 1.6 L/min, p = 0.96). With the exception of qRV dilation (r = 0.02, p = 0.87), all measurements of RV dysfunction correlated with CO (tricuspid annular plane systolic excursion r = 0.48, p <0.001; qRV function r = 0.36, p <0.001; fractional area change r = 0.19, p = 0.04). CO was lower in those with composite RV dysfunction compared to those without (4.0 ± 1.7 vs 4.9 ± 1.8 L/min, p = 0.007). Patients with composite RV dysfunction who developed worsening RF had a significantly higher CO than those who did not (6.1 ± 2.4 vs 3.5 ± 1.1 L/min, p = 0.03).
| Variable | Worsening RF | p Value | |
|---|---|---|---|
| No (n = 93) | Yes (n = 48) | ||
| Age (years) | 63 ± 17 | 60 ± 14 | 0.32 |
| African-American | 73 (79%) | 36 (75%) | 0.64 |
| Men | 44 (47%) | 29 (60%) | 0.14 |
| Systolic blood pressure (mm Hg) | 148 ± 33 | 147 ± 31 | 0.9 |
| Heart rate (beats per min) | 82 ± 16 | 81 ± 16 | 0.63 |
| General medical service | 71 (77%) | 36 (75%) | 0.77 |
| Volume overload on chest x-ray | 44 (71%) | 24 (65%) | 0.53 |
| Hemoglobin (g/dl) | 12.2 ± 2.3 | 12.0 ± 1.9 | 0.55 |
| Detectable troponin I | 25 (27%) | 10 (21%) | 0.43 |
| Serum urea nitrogen (mg/dl) | 21 (15–29) | 21 (14–32) | 0.65 |
| Serum sodium (mg/dl) | 139.4 ± 5.5 | 138.9 ± 4.0 | 0.58 |
| Admission glomerular filtration rate (ml/min/1.73 m 2 ) | 68.5 ± 27.0 | 53.5 ± 26.6 | 0.002 ⁎ |
| Admission serum creatinine (mg/dl) | 1.2 (1.0–1.5) | 1.3 (1.0–1.9) | 0.29 |
| B-type natriuretic peptide (pg/dl) | 1,679 (924–2,518) | 1,368 (961–2,925) | 0.92 |
| Maximum diuretic dose (mg/day) | 80 (80–160) | 120 (80–200) | 0.14 |
| Thiazide use | 10 (11%) | 9 (19%) | 0.19 |
| Net fluid out (L) | 3.9 (1.7–7.2) | 3.9 (0.5–5.3) | 0.23 |
| Length of stay (days) | 5 (3.5–6.5) | 5 (4.0–7.0) | 0.58 |
| Peak creatinine (days) | 3 (2.0–4.0) | 4 (3.0–5.0) | 0.03 ⁎ |
| Ejection fraction (%) | 25 (15–53) | 23 (15–40) | 0.85 |
| Early peak mitral inflow velocity/early peak annular tissue velocity (septal) | 19.0 ± 10.4 | 17.2 ± 8.5 | 0.34 |
| Early peak mitral inflow velocity/early peak annular tissue velocity (lateral) | 12.2 ± 6.8 | 12.5 ± 6.2 | 0.81 |
| Cardiac output (L/min) | 4.5 ± 1.9 | 4.7 ± 1.6 | 0.44 |
| Lack of inspiratory inferior vena cava collapse | 19 (20%) | 3 (6.3%) | 0.03 ⁎ |
| Left atrial size (cm) | 4.9 ± 0.7 | 4.6 ± 0.7 | 0.1 |
| Moderate or severe right ventricular dilation | 35 (39%) | 7 (15%) | 0.004 ⁎ |
| Moderate or severe right ventricular dysfunction | 50 (54%) | 9 (19)% | <0.001 ⁎ |
| Right ventricular fractional area change (%) | 28.6 (21.5–36.9) | 35.3 (26.0–41.9) | 0.007 ⁎ |
| Tricuspid annular plane systolic excursion (cm) | 1.5 (1.2, 1.7) | 1.8 (1.4, 2.0) | 0.002 ⁎ |
| Moderate or severe tricuspid regurgitation | 46 (50%) | 20 (42%) | 0.38 |
Stay updated, free articles. Join our Telegram channel

Full access? Get Clinical Tree


