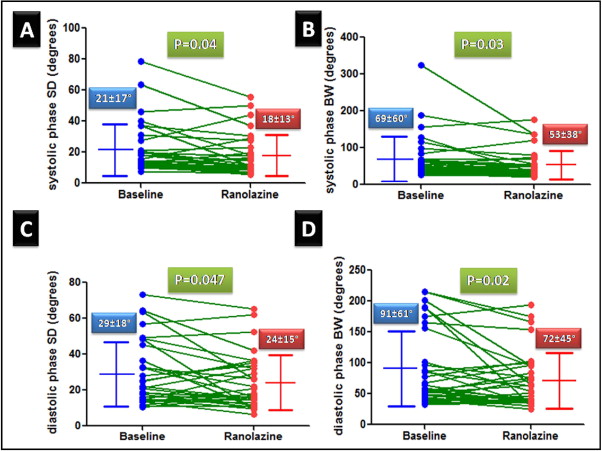
We previously reported that ranolazine improves exercise myocardial perfusion. Ranolazine ameliorates myocardial ischemia by augmenting myocardial blood flow; likely by a reduction in the extravascular compression of small vessels. We hypothesized that ranolazine could improve left ventricular (LV) dyssynchrony as assessed by phase analysis of gated single photon emission computed tomographic myocardial perfusion imaging. Patients (n = 32) with known or suspected coronary artery disease and reversible perfusion defects on a clinically indicated stress myocardial perfusion imaging were restudied 4 weeks after ranolazine (500 to 1,000 mg orally twice daily) was added to their conventional treatment in an open-label trial (data previously reported). The LV systolic and diastolic dyssynchrony indexes were obtained using automated phase analysis before and after ranolazine. No significant changes were found in the heart rate or blood pressure (at rest or during stress) after treatment. The perfusion pattern improved in 13 of 18 patients who had undergone exercise testing, but in only 3 of 14 patients who had undergone vasodilator stress testing. No significant changes were seen in the LV ejection fraction or volume after treatment. The systolic and diastolic LV dyssynchrony improved after ranolazine therapy; there was a significant decrease in the systolic phase SD (21 ± 17 vs 18 ± 13, p = 0.04), systolic bandwidth (69 ± 60 vs 53 ± 38, p = 0.03), diastolic SD (29 ± 18 vs 24 ± 15, p = 0.047) and diastolic bandwidth (91 ± 61 vs 72 ± 45, p = 0.02). In conclusion, the present study is the first to show improvements in diastolic and systolic LV synchrony with ranolazine as measured by automated phase analysis of gated single photon emission computed tomographic myocardial perfusion imaging.
Ranolazine, a prototype late I–Na inhibitor, reduces myocardial ischemia by a novel mechanism that involves inhibition of late sodium current that decreases sodium-dependent intracellular calcium overload of cardiomyocytes. This effect of ranolazine results in a decrease in left ventricular (LV) stiffness, a decrease in extravascular compressive forces on coronary microcirculation and thereby improves myocardial blood flow (MBF). In a previous study, we showed that ranolazine improved myocardial perfusion during exercise. We hypothesized that ranolazine might improve LV synchrony, especially during diastole; such an effect could improve MBF by decreasing LV stiffness and by increasing early diastolic flow. We used automated analysis of gated single photon emission computed tomographic (SPECT) myocardial perfusion imaging (MPI) to measure LV systolic and diastolic dyssynchrony indexes.
Methods
This was an open-label study conducted at the University of Alabama at Birmingham Medical Center and was approved by the institutional review board. All participants signed an informed consent form. The patient population, baseline clinical and demographic data, and MPI results have been previously reported.
All images were acquired and processed according to the American Society of Nuclear Cardiology guidelines using either single-day or 2-day (depending on body weight) stress/rest technetium-99m sestamibi. Identical doses of the tracer were used for the baseline and follow-up studies. All raw data obtained from the gated SPECT images (2 sets/patient) were reconstructed using standard filtered back projection and identical low-pass filtering (Butterworth filter with a critical frequency of 0.4 Hz, order 5). Motion correction was applied before reconstruction of the images if >1 pixel of x or y axis deviation was observed over the 180° acquisition. No attenuation correction was used. An automated program was used to derive summed stress score, summed rest score, and summed difference score based on the conventional 17-segment model. The program assigned a score of 0 to 4 to each segment according to the activity level, whereby 0 indicated normal and 4, absent.
The phase analysis method has been previously described in detail and was derived from the poststress studies. In brief, a 3-dimensional count distribution was extracted from each of the LV short-axis data sets and subjected to 1-harmonic Fourier analysis for systolic dyssynchrony and 3-harmonic Fourier analysis for diastolic dyssynchrony. The Fourier analyses generated a systolic phase distribution and diastolic phase distribution, both ranging from 0° to 360° and spanning the entire RR interval. The systolic and diastolic phase distributions were displayed on polar maps and histograms. Two indexes were extracted from each phase distribution: (1) the histogram bandwidth (BW), which marked the range of degrees of the cardiac cycle during which 95% of the myocardium-initiated contraction, and (2) the SD, which represented the SD of the phase distribution. The effective temporal resolution of the technique correlated to 1/64 of the cardiac cycle, without any significant effect on the phase SD and BW, whether 8 or 16 frames per cycle were applied.
Statistical analysis
The data are expressed as percentages for discrete variables and the mean ± SD for continuous variables. Descriptive statistics were computed for the phase variables and were compared between the baseline and follow-up tests using paired t tests. All statistical analyses were performed using SAS, version 9.1 (SAS Institute, Cary, North Carolina). All tests were 2-tailed, and p <0.05 was used as the level of significance. Paired t tests were used to compare the continuous pre- and postranolazine variables.
Results
Of the 38 patients (exercise testing in 20 and vasodilator testing in 18), phase analysis was not possible in 6 patients (exercise in 2 and vasodilator in 4) because of gating errors. The analysis was performed for the remaining 32 patients. The baseline clinical variables are summarized in Table 1 . No changes were made in the other medications between the baseline and follow-up MPI. The perfusion pattern improved in 13 of 18 patients who underwent exercise MPI and 3 of 14 patients who underwent vasodilator MPI.
| Variable | n = 32 |
|---|---|
| Age (years) | 65 ± 10 |
| Exercise stress | 18 (56%) |
| Women | 9 (28%) |
| Diabetes mellitus | 17 (53%) |
| Hypertension (receiving antihypertensive therapy) | 26 (81%) |
| Smokers | 12 (38%) |
| Previous coronary revascularization | 27 (84%) |
| Angiotensin-converting enzyme inhibitors | 21 (66%) |
| β Blockers | 29 (91%) |
| Statins | 28 (88%) |
| Glomerular filtration rate (ml/min/1.73 m 2 ) | 71 ± 15 |
No significant differences were seen in the heart rate, blood pressure, LV ejection fraction, or LV end-diastolic and LV end-systolic volumes with ranolazine therapy ( Table 2 ).
| At Rest | Ranolazine Treatment | |
|---|---|---|
| Before (n = 32) | After (n = 32) | |
| Heart rate (beats/min) | 68 ± 10 | 66 ± 9 |
| Systolic blood pressure (mm Hg) | 129 ± 27 | 125 ± 17 |
| Diastolic blood pressure (mm Hg) | 72 ± 14 | 72 ± 8 |
| QT (ms) | 418 ± 29 | 423 ± 31 |
| Ejection fraction | 58 ± 15 | 59 ± 15 |
| Left ventricular end-diastolic volume (ml) | 111 ± 49 | 111 ± 50 |
| Left ventricular end-systolic volume (ml) | 54 ± 44 | 52 ± 43 |
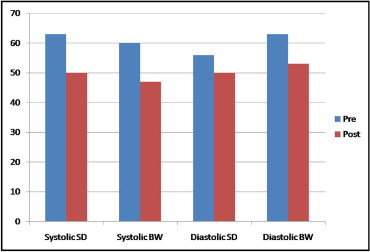
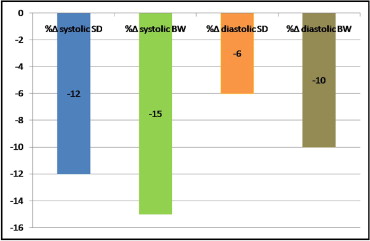
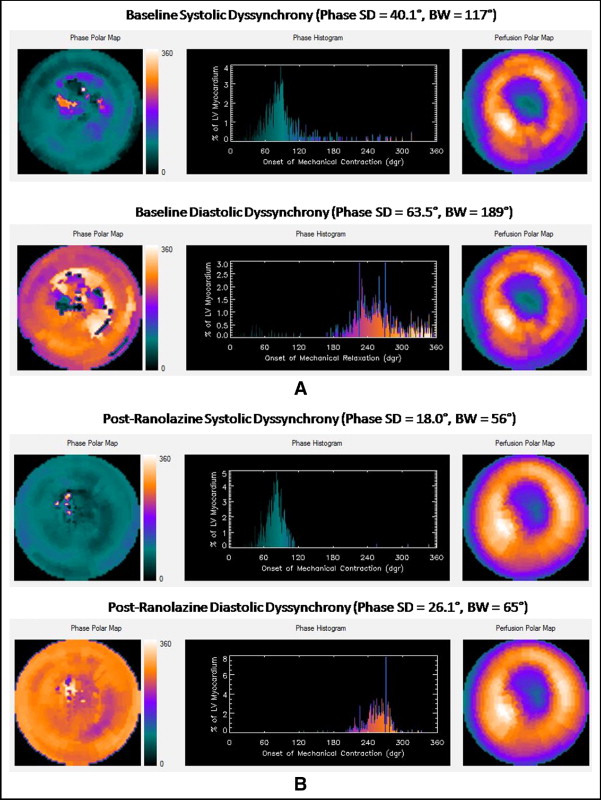
The poststress systolic and diastolic phase SD and BW decreased significantly after ranolazine therapy ( Figure 1 ). The prevalence of abnormal phase variables (determined from previously reported normal values) decreased after ranolazine therapy ( Figure 2 ). The percentage of changes in the systolic and diastolic phase variables are shown in Figure 3 . A representative example showing improvement in the systolic and diastolic indexes is shown in Figure 4 .
The percentage of change in the systolic and diastolic phase variables was not significantly different between those with improved perfusion and those with no change in perfusion ( Table 3 ). No effect was seen from heart rate or the type of stress on the change in systolic and diastolic phase variables. No correlation was found between the baseline and percentage of change in systolic and diastolic phase variables. A strong and positive correlation was found between both the percentage of change in systolic SD and the percentage of change in diastolic SD and the percentage of change in systolic BW and the percentage of change in diastolic BW ( Figures 5 and 6 ).
Stay updated, free articles. Join our Telegram channel

Full access? Get Clinical Tree


