Surgical indications in patients with severe chronic aortic regurgitation (AR) and normal left ventricular (LV) ejection fractions (EF) remain to be established. The aim of this study was to identify prognostic indicators after surgery in patients with severe AR and normal LV systolic function. Preoperative clinical and echocardiographic characteristics were evaluated in 284 consecutive patients with chronic severe AR who underwent aortic valve surgery. Of these patients, 169 had normal (≥50%) and 115 had depressed (<50%) preoperative LV EFs. All-cause mortality was observed for a median of 39.9 months. Of 284 patients, 7 (4.4%) with normal LV EFs and 15 (12.0%) with depressed LV EFs died during follow-up after aortic valve surgery (p = 0.017). In patients with normal EFs, multivariate Cox regression analysis showed that large LV end-systolic dimension and low plasma hemoglobin level were independent predictors of postsurgical mortality. Receiver-operating characteristic analysis showed that LV end-systolic dimension ≥45 mm and hemoglobin level <13.4 g/dl were the best cut-off values for postoperative mortality. In conclusion, preoperative LV end-systolic dimension and hemoglobin level are independent prognostic factors of survival after aortic valve surgery in patients with chronic severe AR and normal LV EFs.
Left ventricular (LV) systolic function and end-systolic size are regarded as important parameters when considering aortic valve (AV) surgery for patients with chronic aortic regurgitation (AR). However, it is unclear whether LV dilation should be regarded as an indicator for AV surgery in such patients. Although severe AR and normal LV systolic function accompanied by severe LV dilatation (end-diastolic dimension >75 or 70 mm or end-systolic dimension >55 or 50 mm) is considered a class IIa indication for AV surgery in asymptomatic patients in the 2008 American College of Cardiology and American Heart Association and 2007 European Society of Cardiology guidelines, it is not clear whether a preoperative dilated left ventricle is an indicator of poor prognosis after AV surgery in selected patients with normal LV systolic function and severe AR. We therefore sought to identify prognostic indicators after surgery in patients with severe chronic AR and normal LV systolic function, especially in terms of LV dilation.
Methods
We assessed 284 consecutive patients (mean age 51 ± 15 years, 91 women) with severe chronic AR who underwent AV surgery from January 2000 to April 2009. Exclusion criteria were moderate or severe primary mitral valve disease, except for functional mitral regurgitation; acute AR caused by infective endocarditis; aortitis or aortic dissection; and significant coronary artery disease (stenosis ≥50%). Patients were classified into 2 groups: those with LV ejection fractions (EFs) ≥50% and those with EFs <50%. Surgical procedures included AV replacement (n = 214) and AV repair (n = 70).
Patients underwent 2-dimensional Doppler echocardiography <1 month before AV surgery using a Hewlett-Packard Sonos 2500 or 5500 imaging system equipped with a 2.5-MHz transducer (Hewlett-Packard, Andover, Massachusetts). LV end-systolic and end-diastolic dimensions and the thicknesses of the interventricular septal and posterior walls in diastole were measured from M-mode or 2-dimensional echocardiography in parasternal views. LV end-systolic and end-diastolic volumes were measured using a modified Simpson’s method, and the LV EF was calculated. LV volume was indexed by the body surface area of each patient, and LV mass index was calculated as previously described.
Preoperative clinical characteristics were evaluated, including patients’ symptoms assessed using New York Heart Association functional class, the presence of hypertension and diabetes, and laboratory findings. The main outcome measure was all-cause mortality. Patients were followed for a median of 39.9 months (interquartile range 18.7 to 67.1). Clinical data were collected during patient visits to the outpatient clinic or by telephone interviews. The Korean national registry of vital statistics was used to confirm mortality during follow-up.
Statistical analysis was performed using SAS (SAS Institute Inc., Cary, North Carolina) and SPSS (SPSS, Inc., Chicago, Illinois). Data are expressed as mean ± SD for continuous variables and as frequencies for categorical variables. Continuous variables were compared using Student’s t tests, and categorical variables were compared using Fisher’s exact tests. Kaplan-Meier analysis was used to determine the survival rate, and the difference between groups was analyzed using the log-rank test. Univariate and multivariate associations of clinical and echocardiographic variables with patient mortality were assessed using a Cox proportional-hazards model. Variables with p values ≤0.10 in univariate analyses were candidates for the multivariate Cox regression analysis. The final models were determined by backward elimination. Schoenfeld residuals and the log [−log(survival rate)] were used to verify that the proportional-hazards assumptions were not violated. Receiver-operating characteristic curve analysis was used to evaluate cut-off values of independent continuous variables for predicting mortality. A p value <0.05 was considered statistically significant.
Results
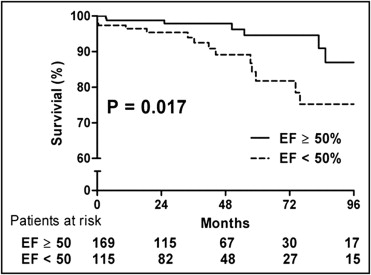
Patients with normal LV EFs (n = 169) were less likely to be symptomatic or have diabetes and atrial fibrillation and had smaller LV end-systolic and end-diastolic dimensions, smaller LV end-systolic and end-diastolic volume indexes, and lower LV mass indexes than patients with depressed EFs (n = 115) ( Table 1 ). After AV surgery, 4 patients died before hospital discharge, and 18 died during follow-up. The 5-year survival rate was significantly higher in patients with normal EFs than in those with depressed EFs (94.6 ± 2.6% vs 81.8 ± 3.5%, p = 0.017; Figure 1 ) . There were no significant differences in clinical variables and mortality between patients who underwent AV replacement and repair, except for a higher prevalence of atrial fibrillation in patients who underwent AV replacement ( Table 2 ).
| Variable | LV EF (%) | p Value | |
|---|---|---|---|
| ≥50 (n = 169) | <50 (n = 115) | ||
| Age (years) | 51 ± 15 | 53 ± 15 | 0.248 |
| Men | 107 (63.3%) | 86 (74.8%) | 0.043 |
| Body surface area (m 2 ) | 1.7 ± 0.2 | 1.7 ± 0.16 | 0.959 |
| Diabetes mellitus | 2 (1.2%) | 8 (7.0%) | 0.024 |
| Hypertension | 62 (36.7%) | 44 (38.3%) | 0.788 |
| Atrial fibrillation | 14 (8.3%) | 23 (20.0%) | 0.004 |
| New York Heart Association classes III and IV | 89 (52.7%) | 88 (76.5%) | <0.001 |
| Hemoglobin (g/dl) | 13.5 ± 1.8 | 13.4 ± 1.8 | 0.768 |
| Creatinine (mg/dl) | 1.0 ± 0.5 | 1.1 ± 0.8 | 0.088 |
| LV end-systolic dimension (mm) | 42.9 ± 7.5 | 55.6 ± 10.7 | <0.001 |
| LV end-diastolic dimension (mm) | 65.2 ± 8.1 | 72.6 ± 10.0 | <0.001 |
| Interventricular septal thickness (mm) | 10.8 ± 2.2 | 10.7 ± 2.1 | 0.741 |
| Posterior wall thickness (mm) | 10.8 ± 2.0 | 11.1 ± 1.9 | 0.235 |
| LV end-systolic volume (ml/m 2 ) | 52.5 ± 19.9 | 96.2 ± 40.7 | <0.001 |
| LV end-diastolic volume (ml/m 2 ) | 124.2 ± 38.7 | 159.9 ± 57.1 | <0.001 |
| LV EF (%) | 58.3 ± 5.4 | 40.4 ± 7.4 | <0.001 |
| LV mass index (g/m 2 ) | 184.6 ± 54.6 | 226.7 ± 65.4 | <0.001 |
| AV replacement ⁎ | 125 (74.0%) | 89 (77.4%) | 0.511 |
| All-cause death | 8 (4.7%) | 14 (12.2%) | 0.021 |
| Variable | AV Replacement (n = 214) | AV Repair (n = 70) | p Value |
|---|---|---|---|
| Age (years) | 52 ± 15 | 48 ± 13 | 0.086 |
| Men | 142 (66.4%) | 51 (72.9%) | 0.312 |
| Body surface area (m 2 ) | 1.7 ± 0.2 | 1.7 ± 0.2 | 0.095 |
| Diabetes mellitus | 5 (2.3%) | 5 (7.1%) | 0.058 |
| Hypertension | 80 (37.4%) | 26 (37.1%) | 0.971 |
| Atrial fibrillation | 35 (16.4%) | 2 (2.9%) | 0.004 |
| New York Heart Association classes III and IV | 140 (65.4%) | 37 (52.9%) | 0.060 |
| Hemoglobin (g/dl) | 13.3 ± 1.9 | 13.7 ± 1.6 | 0.077 |
| Creatinine (mg/dl) | 1.1 ± 0.8 | 0.9 ± 0.3 | 0.292 |
| LV end-systolic dimension (mm) | 48.2 ± 11.5 | 47.6 ± 8.7 | 0.625 |
| LV end-diastolic dimension (mm) | 68.1 ± 10.0 | 68.6 ± 8.4 | 0.684 |
| Interventricular septal thickness (mm) | 10.8 ± 2.1 | 10.7 ± 2.3 | 0.735 |
| Posterior wall thickness (mm) | 11.0 ± 2.0 | 10.7 ± 1.8 | 0.248 |
| LV end-systolic volume (ml/m 2 ) | 71.4 ± 39.6 | 66.3 ± 26.8 | 0.223 |
| LV end-diastolic volume (ml/m 2 ) | 139.1 ± 53.2 | 137.2 ± 39.3 | 0.744 |
| LV EF (%) | 50.5 ± 11.2 | 52.7 ± 9.4 | 0.153 |
| LV mass index (g/m 2 ) | 203.6 ± 64.0 | 195.8 ± 58.2 | 0.368 |
| All-cause death | 16 (7.5%) | 6 (8.6%) | 0.766 |
In 169 patients with normal EFs, the 8 patients who died after AV surgery had higher LV mass indexes than the 161 patients who survived ( Table 3 ). The former also tended to have preoperative larger LV end-systolic dimensions and thicker posterior walls in diastole than the latter, although these differences were not statistically significant. Among all the preoperative clinical and echocardiographic parameters, LV end-systolic dimension, LV end-systolic and end-diastolic volume indexes, plasma hemoglobin concentration, and LV mass index were associated with mortality (p <0.10) by univariate Cox regression analyses ( Table 4 ). A multivariate Cox proportional-hazards model that included these variables showed that large LV end-systolic dimension and low hemoglobin concentration were independent predictors of death after AV surgery.
| Variable | Survived (n = 161) | Died (n = 8) | p Value |
|---|---|---|---|
| Age (years) | 51 ± 15 | 51 ± 16 | 0.900 |
| Men | 102 (63%) | 5 (63%) | 0.961 |
| Body surface area (m 2 ) | 1.7 ± 0.2 | 1.6 ± 0.2 | 0.247 |
| Diabetes mellitus | 2 (1%) | 0 (0%) | 0.751 |
| Hypertension | 59 (37%) | 3 (38%) | 0.961 |
| Atrial fibrillation | 13 (8%) | 1 (13%) | 0.658 |
| New York Heart Association classes III and IV | 83 (52%) | 6 (75%) | 0.195 |
| Hemoglobin (g/dl) | 14 ± 1.9 | 12 ± 0.9 | 0.103 |
| Creatinine (mg/dl) | 1.0 ± 0.5 | 1.1 ± 0.4 | 0.697 |
| LV end-systolic dimension (mm) | 43 ± 7 | 48 ± 8 | 0.069 |
| LV end-diastolic dimension (mm) | 65 ± 8 | 68 ± 10 | 0.394 |
| Interventricular septal thickness (mm) | 10.8 ± 2.2 | 11.4 ± 2.1 | 0.425 |
| Posterior wall thickness (mm) | 10.8 ± 2.0 | 12.0 ± 1.9 | 0.087 |
| LV end-systolic volume (ml/m 2 ) | 52 ± 20 | 63 ± 24 | 0.110 |
| LV end-diastolic volume (ml/m 2 ) | 123 ± 38 | 144 ± 47 | 0.141 |
| LV EF (%) | 58 ± 5 | 56 ± 5 | 0.275 |
| LV mass index (g/m 2 ) | 183 ± 54 | 226 ± 60 | 0.027 |
| AV replacement ⁎ | 120 (75%) | 5 (63%) | 0.449 |
| Variables | Univariate | Multivariate | ||
|---|---|---|---|---|
| HR (95% CI) | p Value | HR (95% CI) | p Value | |
| Age (years) | 1.027 (0.970–1.087) | 0.365 | ||
| Hypertension | 0.570 (0.126–2.580) | 0.465 | ||
| New York Heart Association classes III and IV | 0.636 (0.122–3.318) | 0.591 | ||
| Hemoglobin (g/dl) | 0.710 (0.474–1.064) | 0.097 | 0.556 (0.349–0.886) | 0.014 |
| Creatinine (mg/dl) | 1.322 (0.463–3.773) | 0.602 | ||
| LV end-systolic dimension (mm) | 1.124 (1.004–1.258) | 0.042 | 1.201 (1.043–1.383) | 0.011 |
| LV end-diastolic dimension (mm) | 1.053 (0.960–1.155) | 0.277 | ||
| LV end-systolic volume (ml/m 2 ) | 1.036 (0.999–1.073) | 0.057 | ||
| LV end-diastolic volume (ml/m 2 ) | 1.018 (0.999–1.038) | 0.063 | ||
| Interventricular septal thickness (mm) | 1.079 (0.790–1.473) | 0.634 | ||
| Posterior wall thickness (mm) | 1.217 (0.885–1674) | 0.228 | ||
| LV mass index (g/m 2 ) | 1.012 (0.999–1.012) | 0.063 | ||
| LV EF (%) | 0.936 (0.813–1.077) | 0.356 | ||
Stay updated, free articles. Join our Telegram channel

Full access? Get Clinical Tree


