Few data are available on the timing of adverse events in relation to the status of diabetes mellitus and the type of acute coronary syndrome (ACS). We investigated this issue in diabetic and nondiabetic patients admitted with a diagnosis of non–ST-segment elevation ACS (NSTE-ACS) or ST-segment elevation myocardial infarction (STEMI) undergoing percutaneous coronary intervention. Patient-level data from 6 studies (n = 16,601) were pooled and only patients with ACS are included (n = 9,492). Early (0 to 30 days), late (31 to 365 days), and overall (0 to 365 days) events were analyzed. Diabetes mellitus was present in 1,927 patients (20.3%). At 1 year, all-cause mortality was highest for diabetic patients with STEMI (13.4%), followed by diabetic patients with NSTE-ACS (10.3%), nondiabetic patients with STEMI (6.4%) and nondiabetic patients with NSTE-ACS (4.4%; p <0.001). Among patients with diabetes, there was a significant interaction (p <0.001) for STEMI versus NSTE-ACS in early compared with late mortality, due to an excess of early mortality associated with STEMI (9.3% vs 3.7%; hazard ratio 2.31, 95% CI 1.52 to 3.54, p <0.001). Compared with diabetic NSTE-ACS patients, diabetic patients with STEMI had an increased risk of early stent thrombosis (hazard ratio 2.26, 95% CI 1.48 to 3.44, p <0.001), as well as a significant interaction (p = 0.009) in the risk of target lesion revascularization between the early and late follow-up. The distribution of fatal and nonfatal events according to the type of ACS was not influenced by diabetic status. In conclusion, diabetes in ACS setting confers a worse prognosis with 1-year mortality >10% in both STEMI and NSTE-ACS. Notwithstanding the high absolute rates, the temporal distribution of adverse events related to the type of ACS is similar between diabetic and nondiabetic patients.
Diabetes mellitus (DM) is a common clinical condition and a serious global health problem. During the last 2 decades, the incidence and prevalence of DM have grown at exponential rates worldwide, and by 2035, the global prevalence is expected to further increase by more than 50% compared with 2013 estimates. Although the incidence of acute myocardial infarction (MI), which represents the most common diabetes-related complication, has steadily decreased by 68% from 1990 to 2010, the reduction in absolute terms remains negligible due to the increase in life expectancy and population growth.
Several studies have demonstrated that the temporal distribution of adverse events in patients with acute coronary syndrome (ACS) is determined by the type of ACS. Typically, the risk of mortality in patients with ST-segment elevation MI (STEMI) is highest during the first 30 days and then attenuates over time. This pattern is at variance with patients affected by non–ST-segment elevation ACS (NSTE-ACS), who commonly feature a higher risk of recurrent ischemic events during the longer-term follow-up. Although it is well established that DM confers an impaired prognosis in the setting of ACS, it remains unclear whether DM affects the temporal pattern of adverse events in patients with ACS undergoing percutaneous coronary intervention (PCI). Therefore, the purpose of this study was to determine the timing of mortality and other nonfatal adverse events according to diabetic status and type of ACS (STEMI vs NSTE-ACS) by pooling data from contemporary cohorts of patients undergoing PCI.
Methods
We pooled individual patient data from 5 randomized clinical trials and the Bern PCI Registry, which were conducted from 2004 to 2014 at European institutions. The SIRTAX (Sirolimus-Eluting and Paclitaxel-Eluting Stent for Coronary Revascularization— NCT00297661 ), the LEADERS (Limus Eluted from A Durable Versus Erodable Stent coating— NCT00389220 ), the RESOLUTE (Randomized Comparison of a Zotarolimus-Eluting Stent with an Everolimus-Eluting Stent for Percutaneous Coronary Intervention— NCT00617084 ), and the BIOSCIENCE (Ultrathin Strut Biodegradable Polymer Sirolimus-Eluting Stent Versus Durable Polymer Everolimus-Eluting Stent for Percutaneous Coronary Revascularization— NCT01443104 ) are all-comers trials comparing different drug-eluting stents strategies. The PRODIGY (Prolonging Dual Antiplatelet Treatment After Grading Stent-Induced Intimal Hyperplasia Study) trial ( NCT00611286 ) is a 4-by-2 randomized study, in which patients were assigned to a balanced mixture of stents and to different durations of dual antiplatelet therapy (6 or 24 months). Details on study design and trial results were reported elsewhere. Briefly, all patients were eligible if they had at least 1 lesion with a diameter stenosis ≥50% in a vessel with a reference diameter of ≥2.25 mm. None of the randomized studies imposed any restriction with respect to the number of treated lesions, treated vessels, lesion length, or number of stents implanted. The Bern PCI Registry ( NCT02241291 ) is a prospective registry including all consecutive patients undergoing PCI at the Bern University Hospital (Bern, Switzerland) with no formal exclusion criteria. For the purpose of the present study, we excluded patients with stable coronary artery disease as clinical presentation at the time of the index PCI.
All trials complied with the Declaration of Helsinki, and the study protocols were approved by the ethics committees at each study center. Patients had provided written, informed consent for participation in the individual studies.
Study participants were classified according to diabetic status at the time of the index PCI and stratified by ACS type (STEMI or NSTE-ACS). DM was defined as known DM at the time of hospital admission and included also patients treated with diet only. The primary outcome of interest was all-cause mortality. Secondary outcomes included cardiac death, MI, definite and definite or probable stent thrombosis, target lesion and target vessel revascularization. End point definitions were comparable across the 6 studies and a clinical events committee independently adjudicated adverse events in all studies. Cardiac death was defined as death from cardiac causes or any death from unknown causes in the SIRTAX, LEADERS, BIOSCIENCE, PRODIGY trials, and the Bern PCI registry, and as any death unless an undisputed noncardiac cause was present in the RESOLUTE trial. MI was defined in the SIRTAX and LEADERS trials as the presence of new Q-waves in ≥2 contiguous leads, or—in the absence of significant Q-waves—as an increase in the creatinine kinase level to more than twice the upper limit of the normal range with an elevated level of creatinine kinase-MB or troponin. In the RESOLUTE, BIOSCIENCE, and the Bern PCI registry, MI was defined according to the extended historical definition that is consistent with the one used in the SIRTAX and LEADERS trials. However, in the extended definition, the diagnosis of reinfarction in case biomarkers have not yet peaked requires new signs or clinical symptoms of myocardial ischemia accompanied by an additional ≥50% elevation of biomarkers of myocardial damage within 24 hours, whereas after the biomarker has peaked, any significant increase starting within the 48 hours after PCI defines a spontaneous MI. In the PRODIGY trial, the definition of MI was based on the detection of increase and/or decrease in creatine kinase-MB or troponin with at least 1 value above the upper limit of normal together with evidence of myocardial ischemia with at least 1 of the following: symptoms of ischemia; electrocardiographic changes indicative of new ischemia (new ST-T changes or new left bundle branch block); development of pathological Q-waves. Stent thrombosis was defined according to the Academic Research Consortium criteria. Data from the randomized trials were imported from original source files and managed using REDCap electronic data capture tools, whereas data from the Bern PCI registry were stored in a central database (Cardiobase, 2 mT; Ulm, Germany). All the data were hosted at the Clinical Trials Unit and Department of Cardiology of the University of Bern (Bern, Switzerland). For the purpose of this study, we excluded all patients with stable coronary artery disease or in whom the diabetic status was missing. Continuous variables are presented as mean ± SD and were compared with independent samples Student t test. Categorical variables are expressed as counts and percentages and were compared with the chi-square or Fisher’s exact tests as appropriate. Baseline lesion variables were analyzed using general or generalized linear mixed models, accounting for lesions nested within patients. Clinical outcomes at 1 year were expressed as counts with rates computed according to the Kaplan–Meier method. Cox regression analysis stratified by study was used to calculate hazard ratios (HRs) with 95% CIs. Adjusted HRs (HR adj ) were derived from multiple imputation estimated Cox regressions (20 data sets created using chained equations and estimates combined used the Rubin’s rule), adjusting for baseline variables associated with the primary outcome at the univariate analysis with significance level of p <0.20 (age, gender, body mass index, arterial hypertension, dyslipidemia, current smoker, previous MI, and a family history of coronary artery disease). The instantaneous risk of death was assessed with a flexible parametric survival model according to the method described by Lambert and Royston. Landmark analyses were done according to a prespecified landmark point at 30 days, with HRs calculated separately for events up to 30 days, and between 31 to 365 days. For each type of event, patients were censored at the time of the first event—a patient who experienced an event contributing to a specific end point within 30 days, for example, was censored at the time of that event and excluded from the analysis after the landmark point. Finally, interaction tests were provided to evaluate the effect of DM on the outcomes of STEMI versus NSTE-ACS patients and to assess the timing of early and late events of STEMI compared with NSTE-ACS patients according to the presence of DM. All p values and CIs are 2 sided. A p value <0.05 was considered statistically significant. All analyses were carried out with Stata Statistical Software, release 14 (StataCorp LP, College Station, Texas).
Results
The initial population consisted of 16,601 patients who underwent PCI. After the exclusion of patients with stable coronary artery disease (n = 7,057) or in whom diabetic status was unknown (n = 52), a total of 9,492 patients with ACS undergoing PCI were included in the current analysis. DM was present in 1,927 patients (20.3%), of whom 591 patients (30.7%) presented with STEMI and 1,336 patients (69.3%) with NSTE-ACS. Among 7,565 patients without DM, STEMI and NSTE-ACS were present in 3,339 (44.1%) and 4,226 (55.9%) cases, respectively. Baseline characteristics for patients with and without DM according to the type of ACS are presented in Table 1 . Angiographic and procedural variables are listed in Table 2 .
| Variable | Diabetes Mellitus | |||||
|---|---|---|---|---|---|---|
| No (N=7,565) | Yes (N=1,927) | |||||
| STEMI (N =3,339) | NSTE-ACS (N =4,226) | p-value | STEMI (N =591) | NSTE-ACS (N =1,336) | p-value | |
| Age (years [standard deviation]) | 62.8 ± 12.8 | 66.2 ± 12.2 | <0.001 | 67.2 ± 12.0 | 69.1 ± 10.8 | <0.001 |
| Women | 743 (22.3%) | 1057 (25.0%) | 0.005 | 150 (25.4%) | 411 (30.8%) | 0.017 |
| Body mass index (kg/m 2 ) | 26.7 ± 4.1 | 27.0 ± 4.2 | <0.001 | 28.9 ± 5.1 | 29.0 ± 5.3 | 0.565 |
| Insulin-requiring diabetes | 213 (36.5%) | 489 (37.0%) | 0.837 | |||
| Hypertension | 1679 (50.4%) | 2874 (68.2%) | <0.001 | 432 (74.0%) | 1129 (84.7%) | <0.001 |
| Hypercholesterolemia | 1418 (42.7%) | 2539 (60.2%) | <0.001 | 340 (58.2%) | 920 (69.2%) | <0.001 |
| Renal Failure | 485 (17.4%) | 793 (20.6%) | 0.001 | 135 (26.5%) | 412 (33.7%) | 0.004 |
| glomerular filtration rate (mL/min) | 89.8 ± 33.4 | 84.5 ± 34.9 | <0.001 | 84.8 ± 38.6 | 77.6 ± 35.9 | <0.001 |
| Current smoker | 1446 (44.0%) | 1232 (29.5%) | <0.001 | 170 (29.7%) | 246 (18.5%) | <0.001 |
| Family history of coronary artery disease | 891 (27.2%) | 1278 (31.2%) | <0.001 | 116 (20.5%) | 336 (25.9%) | 0.012 |
| Previous myocardial infarction | 308 (9.2%) | 1045 (24.8%) | <0.001 | 101 (17.2%) | 409 (30.9%) | <0.001 |
| Previous percutaneous coronary intervention | 278 (8.3%) | 969 (23.0%) | <0.001 | 80 (13.7%) | 374 (28.0%) | <0.001 |
| Previous coronary artery bypass grafting | 79 (2.4%) | 387 (9.2%) | <0.001 | 35 (6.0%) | 219 (16.4%) | <0.001 |
| Left Ventricular Ejection Fraction (%) | 46.6 ± 11.1 | 54.6 ± 11.9 | <0.001 | 43.9 ± 12.4 | 51.2 ± 13.3 | <0.001 |
| Variable | Diabetes Mellus | |||||
|---|---|---|---|---|---|---|
| No (N=7,565) | Yes (N=1,927) | |||||
| STEMI (N =3339) | NSTE-ACS (N =4226) | p- value | STEMI (N =591) | NSTE-ACS (N =1336) | p- value | |
| Glycoprotein IIb/IIIa receptor inhibitors | 849 (30.6%) | 436 (12.0%) | <0.001 | 134 (27.5%) | 105 (9.6%) | <0.001 |
| No. of treated coronary lesions | 1.49 ± 0.81 | 1.61 ± 0.87 | <0.001 | 1.61 ± 0.92 | 1.72 ± 0.95 | 0.090 |
| Multivessel treatment | 581 (17.4%) | 1174 (27.8%) | <0.001 | 131 (22.2%) | 432 (32.3%) | <0.001 |
| Coronary Lesions — No. | N = 4959 | N = 6796 | N = 954 | N = 2302 | ||
| Target coronary vessel | <0.001 | <0.001 | ||||
| Right | 1838 (37.5%) | 1802 (26.8%) | 325 (34.6%) | 617 (27.3%) | ||
| Left main | 90 (1.8%) | 154 (2.3%) | 18 (1.9%) | 77 (3.4%) | ||
| Left anterior descending | 2119 (43.2%) | 2772 (41.2%) | 391 (41.6%) | 858 (38.0%) | ||
| Left circumflex | 830 (16.9%) | 1825 (27.1%) | 188 (20.0%) | 621 (27.5%) | ||
| Graft | 27 (0.6%) | 177 (2.6%) | 17 (1.8%) | 85 (3.8%) | ||
| De Novo per lesion | 4013 (97.2%) | 5585 (95.2%) | <0.001 | 771 (97.2%) | 1757 (93.7%) | <0.001 |
| Occlusion per lesion | 1493 (36.4%) | 535 (9.2%) | <0.001 | 225 (28.6%) | 158 (8.4%) | <0.001 |
| Number of stents per lesion (mean [standard deviation]) | 1.30 ± 0.60 | 1.25 ± 0.55 | <0.001 | 1.32 ± 0.63 | 1.26 ± 0.57 | 0.027 |
| Total stent length per lesion (mm) | 26.28 ± 15.17 | 23.86 ± 13.23 | <0.001 | 26.90 ± 15.87 | 24.85 ± 14.48 | 0.003 |
| Mean stent diameter per lesion (mm) | 3.03 ± 0.48 | 2.94 ± 0.47 | <0.001 | 2.98 ± 0.49 | 2.89 ± 0.47 | <0.001 |
| New-generation drug-eluting stents | 2323 (69.6%) | 3079 (72.8%) | 0.002 | 411 (69.5%) | 953 (71.3%) | 0.45 |
| Medication at discharge | ||||||
| Aspirin | 2897 (98.4%) | 3474 (98.4%) | 0.84 | 495 (97.2%) | 1103 (97.9%) | 0.48 |
| Any dual antiplatelet therapy | 2869 (97.4%) | 3425 (97.1%) | 0.40 | 490 (96.3%) | 1090 (96.7%) | 0.66 |
| Beta-blocker | 2593 (87.9%) | 2915 (82.6%) | <0.001 | 438 (85.9%) | 907 (80.4%) | 0.008 |
| ACE inhibitor or ARB inhibitor | 2435 (82.6%) | 2399 (68.0%) | <0.001 | 385 (75.5%) | 691 (61.3%) | <0.001 |
| Statin | 2801 (95.0%) | 3297 (93.4%) | 0.008 | 476 (93.3%) | 999 (88.6%) | 0.002 |
| Medication at 1-year follow-up | ||||||
| Aspirin | 2634 (95.9%) | 3063 (94.9%) | 0.065 | 435 (95.6%) | 899 (92.6%) | 0.037 |
| Any dual antiplatelet therapy | 1835 (66.8%) | 2112 (65.4%) | 0.26 | 306 (67.3%) | 595 (61.3%) | 0.029 |
| Beta-blocker | 2240 (82.3%) | 2442 (75.8%) | <0.001 | 377 (84.5%) | 750 (78.3%) | 0.006 |
| ACE inhibitor or ARB inhibitor | 1786 (65.6%) | 1857 (57.7%) | <0.001 | 302 (67.7%) | 549 (57.3%) | <0.001 |
| Statin | 2474 (90.9%) | 2829 (87.8%) | <0.001 | 407 (91.3%) | 810 (84.6%) | 0.001 |
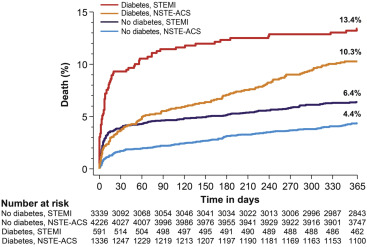
The rate of mortality at 1 year was 13.4% in diabetic patients with STEMI, 10.3% in diabetic patients with NSTE-ACS, 6.4% in nondiabetic patients with STEMI, and 4.4% in nondiabetic patients with NSTE-ACS (p <0.001 across the groups; Figure 1 ). The instantaneous risk of death across the 4 groups is shown in the Supplementary Figure 1 . Compared with nondiabetic patients, DM was associated with approximately a twofold higher risk of mortality in both STEMI (HR adj 2.17, 95% CI 1.67 to 2.81, p <0.001) and NSTE-ACS cohorts in adjusted analyses (HR adj 2.39, 95% CI 1.93 to 3.00, p <0.001; Table 3 ). Unadjusted analyses are summarized in the Supplementary Table 1 .
Within both diabetic and nondiabetic populations, STEMI compared to NSTE-ACS was associated with a higher risk of early versus late events, resulting in a significant interaction of ACS type for death, cardiac death, target lesion revascularization, and target vessel revascularization ( Table 4 ). The Kaplan–Meier curves for all-cause mortality with the landmark at 30 days are shown in Figure 2 . Among diabetic patients, STEMI was associated with a higher risk of early mortality (HR adj 2.31, 95% CI 1.52 to 3.54, p <0.001), but this pattern tended to reverse during the late period (HR adj 0.75, 95% CI 0.47 to 1.21, p = 0.24; P int <0.001). A similar course was observed among nondiabetic patients, in whom the risk of mortality of STEMI versus NSTE-ACS was greater during the early (HR adj 2.20, 95% CI 1.57 to 3.04, p <0.001) compared with the late period (HR adj 1.20, 95% CI 0.87 to 1.63, p = 0.26; P int <0.001). At variance with the described pattern, the risk of early and late definite stent thrombosis was increased by more than twofold in both diabetic and nondiabetic patients with STEMI compared with NSTE-ACS.
| No diabetes | Diabetes | p-value for interaction | |||||||
|---|---|---|---|---|---|---|---|---|---|
| STEMI (N=3,339) | NSTE-ACS (N=4,226) | Adjusted analysis | STEMI (N=591) | NSTE-ACS (N=1,336) | Adjusted analysis | ||||
| HR (95%CI) | p-value | HR (95%CI) | p-value | ||||||
| Early events (≤30 days) | |||||||||
| Death | 129 (3.9%) | 71 (1.7%) | 2.20 (1.60-3.04) | <0.001 | 54 (9.3%) | 48 (3.7%) | 2.31 (1.52-3.54) | <0.001 | 0.93 |
| Cardiac death | 117 (3.6%) | 56 (1.3%) | 2.47 (1.73-3.52) | <0.001 | 51 (8.8%) | 40 (3.1%) | 2.68 (1.71-4.22) | <0.001 | 0.88 |
| Myocardial infarction | 72 (2.2%) | 150 (3.6%) | 0.61 (0.46-0.83) | 0.001 | 22 (3.8%) | 65 (4.9%) | 0.75 (0.45-1.26) | 0.28 | 0.35 |
| Target-lesion revascularization | 63 (1.9%) | 39 (0.9%) | 2.07 (1.35-3.18) | 0.001 | 15 (2.7%) | 22 (1.7%) | 1.51 (0.74-3.06) | 0.25 | 0.43 |
| Target-vessel revascularization | 70 (2.2%) | 53 (1.3%) | 1.67 (1.14-2.45) | 0.008 | 16 (2.9%) | 26 (2.0%) | 1.43 (0.73-2.80) | 0.29 | 0.55 |
| Any revascularization | 75 (2.3%) | 52 (1.3%) | 1.72 (1.18-2.52) | 0.005 | 14 (2.5%) | 21 (1.6%) | 1.49 (0.72-3.07) | 0.29 | 0.54 |
| Definite or probable stent thrombosis | 153 (4.7%) | 96 (2.3%) | 1.84 (1.39-2.43) | 0.000 | 56 (9.7%) | 48 (3.7%) | 2.25 (1.48-3.44) | <0.001 | 0.52 |
| Definite stent thrombosis | 51 (1.6%) | 27 (0.6%) | 2.35 (1.42-3.88) | 0.001 | 12 (2.1%) | 10 (0.8%) | 2.81 (1.17-6.77) | 0.021 | 0.74 |
| Late events (31-365 days) | |||||||||
| Death | 78 (2.5%) | 108 (2.7%) | 1.20 (0.87-1.63) | 0.26 | 23 (4.5%) | 85 (6.8%) | 0.75 (0.47-1.21) | 0.24 | 0.12 |
| Cardiac death | 52 (1.7%) | 62 (1.6%) | 1.49 (1.00-2.21) | 0.05 | 14 (2.8%) | 58 (4.7%) | 0.69 (0.38-1.26) | 0.23 | 0.048 |
| Myocardial infarction | 45 (1.5%) | 65 (1.7%) | 0.94 (0.62-1.41) | 0.75 | 12 (2.5%) | 45 (3.9%) | 0.88 (0.45-1.69) | 0.69 | 0.41 |
| Target-lesion revascularization | 89 (3.0%) | 160 (4.1%) | 0.76 (0.57-1.00) | 0.05 | 23 (4.8%) | 92 (7.8%) | 0.58 (0.35-0.96) | 0.036 | 0.23 |
| Target-vessel revascularization | 113 (3.8%) | 206 (5.3%) | 0.75 (0.59-0.96) | 0.02 | 29 (6.0%) | 105 (8.9%) | 0.64 (0.40-1.00) | 0.05 | 0.46 |
| Any revascularization | 118 (4.0%) | 172 (4.4%) | 0.89 (0.69-1.15) | 0.38 | 27 (5.6%) | 72 (6.1%) | 0.77 (0.48-1.24) | 0.28 | 0.64 |
| Definite or probable stent thrombosis | 21 (0.7%) | 28 (0.7%) | 0.96 (0.52-1.77) | 0.90 | 8 (1.7%) | 19 (1.6%) | 1.35 (0.57-3.21) | 0.49 | 0.75 |
| Definite stent thrombosis | 11 (0.4%) | 7 (0.2%) | 2.18 (0.76-6.23) | 0.15 | 5 (1.0%) | 9 (0.7%) | 2.25 (0.72-7.04) | 0.16 | 0.74 |
| Overall events (0-365 days) | |||||||||
| Death | 207 (6.4%) | 179 (4.4%) | 1.61 (1.29-2.00) | <0.001 | 77 (13.4%) | 133 (10.3%) | 1.34 (0.99-1.81) | 0.058 | 0.24 |
| Cardiac death | 169 (5.2%) | 118 (2.9%) | 1.97 (1.52-2.54) | <0.001 | 65 (11.3%) | 98 (7.6%) | 1.53 (1.09-2.15) | 0.014 | 0.14 |
| Myocardial infarction | 117 (3.7%) | 215 (5.2%) | 0.71 (0.56-0.90) | 0.005 | 34 (6.2%) | 110 (8.6%) | 0.80 (0.53-1.20) | 0.28 | 0.78 |
| Target-lesion revascularization | 152 (4.9%) | 199 (5.0%) | 1.02 (0.81-1.28) | 0.85 | 38 (7.3%) | 114 (9.3%) | 0.77 (0.52-1.15) | 0.21 | 0.14 |
| Target-vessel revascularization | 183 (5.9%) | 259 (6.5%) | 0.95 (0.77-1.16) | 0.60 | 45 (8.7%) | 131 (10.7%) | 0.80 (0.55-1.15) | 0.23 | 0.32 |
| Any revascularization | 193 (6.2%) | 224 (5.6%) | 1.09 (0.89-1.35) | 0.39 | 41 (8.0%) | 93 (7.6%) | 0.92 (0.62-1.37) | 0.68 | 0.42 |
| Definite or probable stent thrombosis | 174 (5.3%) | 124 (3.0%) | 1.64 (1.28-2.11) | <0.001 | 64 (11.2%) | 67 (5.2%) | 2.01 (1.39-2.93) | <0.001 | 0.57 |
| Definite stent thrombosis | 62 (1.9%) | 34 (0.8%) | 2.20 (1.46-3.61) | <0.001 | 17 (3.1%) | 19 (1.5%) | 2.51 (1.26-5.00) | 0.009 | 0.88 |
Stay updated, free articles. Join our Telegram channel

Full access? Get Clinical Tree


