The aim of this study was to examine the effect of coronary collateral flow before reperfusion on long-term clinical prognosis in patients with acute ST-elevation myocardial infarction (STEMI) undergoing primary percutaneous coronary intervention. We studied 235 patients with STEMI within 12 hours after symptom onset. All patients had Thrombolysis In Myocardial Infarction grade ≤1 flow before percutaneous coronary intervention. Collateral flow was graded according to the Rentrop classification. Patients were categorized as having absent or poor collateral flow to the infarct-related artery (group A) or significant flow (group B). In 166 patients there was absent or weak collateral flow (group A), whereas 69 had significant flow (group B). Long-term follow-up was available in 227 patients (97%) at a median of 797 days. Overall, 25 patients died during the follow-up period, 22 patients (13.8%) in group A and 3 patients (4.4%) in group B (p = 0.04). A total of 12 (7.5%) nonfatal recurrent myocardial infarctions occurred in group A compared to 2 (2.9%) in group B (p = 0.18). The combined major adverse cardiovascular event end point (death or nonfatal reinfarction) showed a significantly lower event rate in group B (p = 0.02). Extensive collateral flow at baseline was a significant predictor for a favorable long-term clinical outcome on multivariable analysis after adjustment for established prognostic markers. In conclusion, the presence of a well-developed collateral network before mechanical reperfusion in patients with STEMI is associated with improved long-term survival and lower major adverse cardiovascular event rates.
Extensive coronary collateral flow before mechanical reperfusion has been shown to limit infarct size, microvascular injury, and adverse remodeling in patients with ST-elevation myocardial infarction (STEMI). It is unclear whether these observations lead to an improved clinical prognosis. We previously demonstrated a trend toward a lower rate of a combined end point of death or nonfatal reinfarction in patients with well-developed collaterals at 6 months. In another study including only patients with anterior infarctions, collaterals were associated with decreased in-hospital death by decreasing the incidence of cardiogenic shock. In contrast, several other studies could not demonstrate beneficial effects of collateral flow on survival up to 12 months. To date, the impact of baseline collateral flow on prognosis beyond 12 months has not been examined. Given the decrease in infarct size and the protective effects of collaterals on the coronary microcirculation in the acute STEMI setting, it is of particular interest to assess early and late clinical events. Therefore, we sought to examine the effect of coronary collateral flow before reperfusion on long-term clinical prognosis in patients with acute STEMI undergoing primary percutaneous coronary intervention (PCI).
Methods
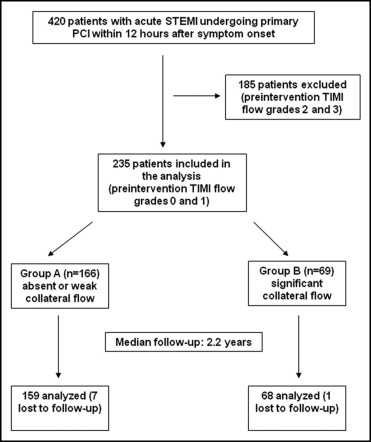
The present analysis is the long-term clinical follow-up of a patient cohort described previously. In brief, consecutive patients with STEMI admitted to our tertiary care center from February 2006 to January 2008 within 12 hours after symptom onset were regarded eligible for the study. Of 420 patients, 185 were excluded because of sufficient anterograde flow in the infarct-related artery (Thrombolysis In Myocardial Infarction [TIMI] grade 2 and 3 flows; Figure 1 ). The remaining 235 patients with preintervention TIMI grade 0 and 1 flows were included in the analysis and further subdivided in 2 groups according to extent of collateral flow (as defined later).

A diagnosis of acute STEMI was made (1) if the combination of chest pain and electrocardiographic changes (new ST-elevation in ≥2 contiguous leads or new left bundle branch block) suggested new ischemia or (2) if coronary angiogram showed significant stenosis of a coronary artery. The study was approved by the local ethics committee and conducted in accordance with the Declaration of Helsinki. All patients gave written informed consent.
Primary PCI was performed according to standard clinical practice. Additional use of intra-aortic balloon counterpulsation or thrombectomy was recommended depending on hemodynamic instability and thrombus in the infarct-related artery. All patients received aspirin 500 mg and heparin (60 U/kg body weight) intravenously before PCI. Clopidogrel (600 mg orally during PCI, if not administered before, followed by 75 mg/day for ≥12 months) was mandatory. Acetylsalicylic acid was given indefinitely at a dose of 100 mg/day. Use of glycoprotein IIb/IIIa inhibitors was strongly recommended according to guidelines. Angiotensin-converting enzyme inhibitors, β blockers, and statins were given to all patients unless contraindicated.
Coronary angiography of the target lesion was performed before and after PCI with the same projections. Angiographic analysis included initial and final flows of the culprit vessel, as defined previously. Collateral flow to the infarct-related artery was graded according to the Rentrop classification, with grade 0 representing no visible filling of any collateral channel, grade 1 filling of the side branches of the infarct-related artery, grade 2 partial filling of the epicardial vessel of the infarct-related artery, and grade 3 complete collateral filling of the epicardial vessel. Patients were categorized into 2 groups according to extent of collateral flow (group A, Rentrop grades 0 and 1; group B, Rentrop grades 2 and 3). Visual assessments were performed off-line by 2 experienced interventional cardiologists blinded to clinical parameters, with any disagreements resolved by consensus.
Magnetic resonance imaging (MRI) scan protocol and technical parameters have been described previously. Measurements of microvascular obstruction (MO), infarct size, and left ventricular ejection fraction were performed at days 1 to 4 after the index event. In particular, MO was assessed approximately 1 minute and 15 minutes after gadolinium injection (early and late MO) by an inversion recovery gradient echo technique.
Follow-up was conducted by structured patient telephone interviews using a questionnaire. Clinical events were verified by direct contact with the general practitioner and/or treating hospital. Clinical end points were long-term all-cause death, nonfatal myocardial reinfarction, and major adverse cardiovascular events, defined as death or nonfatal reinfarction. A diagnosis of reinfarction was based on clinical symptoms of ischemia, new ST-segment changes, and an increase in creatine kinase-MB level above the reference limit in patients with normalized values after the index event or if there was an increase of ≥50% from the last non-normalized measurement. To avoid double counting of patients with >1 event, each patient contributed only 1 time to the composite major adverse cardiovascular event end point.
Categorical variables are expressed as number and percentage of patients. Continuous data are reported as median and interquartile range. Differences between groups were assessed by chi-square test for categorical variables and by Student’s t test for continuous data with normal distribution. Otherwise nonparametric Wilcoxon rank-sum test was used. Analysis of normality was performed by analyzing histograms and QQ plots integrating skewness and kurtosis values and the Kolmogorov-Smirnov test.
A multivariable logistic regression model was applied to assess predictors of significant collateral flow (Rentrop grades 2 and 3) at baseline. Variables assessed for inclusion in the model were diabetes mellitus, gender, history of hypertension, symptom-onset-to-reperfusion time, infarct location, age, low-density lipoprotein cholesterol, previous MI, extent of coronary artery disease (categorized as 1-, 2-, or 3-vessel disease), Killip class, and smoking. All variables presenting with a p value <0.10 on univariable analysis qualified for entering the model.
Clinical event rates between groups A and B were compared by calculating risk ratios with 95% confidence intervals (CIs). Furthermore, Kaplan-Meier curves were constructed to compare time to events between groups and compared by log-rank test. We further performed separate analyses on clinical events and MRI results in patients with symptom-onset-to-reperfusion times <6 hours and 6 to 12 hours.
Multivariable Cox proportional hazards regression model was performed to assess differences in time to clinical events between patients with and without significant collateral flow before reperfusion. Variables showing a significant or borderline association with survival or major adverse cardiovascular events (p <0.10) on univariable analysis were included in the multivariable model. The following covariates were evaluated on univariable analysis: group according to collateral flow (as defined earlier), symptom-onset-to-reperfusion time, TIMI grade flow after PCI, gender, age, history of hypertension, infarct location, Killip class, diabetes mellitus, left ventricular ejection fraction by MRI, and presence of late MO assessed by MRI approximately 15 minutes after contrast injection. Differences were assessed by log-rank test.
A 2-sided p value <0.05 was considered statistically significant. Statistical analyses were performed with SPSS 17.0 (SPSS, Inc., Chicago, Illinois).
Results
The cohort consisted of 235 patients with STEMI and TIMI grade 0 and 1 flows ( Figure 1 ). Of these, 71% had absent or weak collateral flow to the infarct-related artery (Rentrop grade 0 or 1, group A), whereas 29% had significant collateral flow (Rentrop grade 2 or 3, group B). Demographic and clinical characteristics of the study cohort are listed in Table 1 . There were no differences between groups with regard to age, cardiovascular risk factors, Killip class, symptom-onset-to-reperfusion time, and concomitant medication. Long-term follow-up was available in 227 patients (97%) at a median of 797 days (interquartile range 567 to 1,037). There were no significant differences in the follow-up duration between groups (group A 751 days, interquartile range 568 to 1,021; group B, 816 days, interquartile range 562 to 1,099, p = 0.17).
| Variable | Rentrop Grade 0 or 1 | Rentrop Grade 2 or 3 | p Value |
|---|---|---|---|
| (n = 166) | (n = 69) | ||
| Age (years) | 66 (54–74) | 64 (52–73) | 0.34 |
| Men | 126 (76%) | 51 (74%) | 0.82 |
| Cardiovascular risk factors | |||
| Current smoking | 68 (41%) | 32 (46%) | 0.44 |
| Hypertension | 117 (70%) | 45 (65%) | 0.42 |
| Hypercholesterolemia ⁎ | 143 (86%) | 58 (84%) | 0.68 |
| Diabetes mellitus | 41 (25%) | 23 (33%) | 0.17 |
| Body mass index (kg/m 2 ) | 27.7 (24.9–30.0) | 26.8 (23.7–29.6) | 0.19 |
| Previous myocardial infarction | 23 (14%) | 10 (14%) | 0.89 |
| Previous coronary artery bypass grafting | 3 (2%) | 2 (3%) | 0.59 |
| Previous percutaneous coronary intervention | 20 (12%) | 11 (16%) | 0.42 |
| Number of narrowed coronary arteries | |||
| 1 | 82 (49%) | 35 (51%) | 0.85 |
| 2 | 52 (31%) | 20 (29%) | 0.72 |
| 3 | 32 (19%) | 14 (20%) | 0.85 |
| Infarct-related coronary artery | |||
| Right | 64 (39%) | 33 (48%) | 0.18 |
| Left circumflex | 18 (11%) | 5 (7%) | 0.39 |
| Left anterior descending | 84 (50%) | 31 (45%) | 0.42 |
| Killip class on admission | |||
| I | 108 (65%) | 42 (61%) | 0.54 |
| II | 43 (26%) | 23 (33%) | 0.24 |
| III | 9 (5%) | 3 (4%) | 0.73 |
| IV | 6 (4%) | 1 (1%) | 0.37 |
| Symptom-onset-to-reperfusion time (minutes) | 207 (145–360) | 242 (158–456) | 0.21 |
| Door-to-balloon time (minutes) | 28 (21–35) | 28 (19–35) | 0.99 |
| Thrombolysis In Myocardial Infarction flow grade before percutaneous coronary intervention | |||
| 0 | 146 (88%) | 62 (90%) | 0.67 |
| 1 | 20 (12%) | 7 (10%) | 0.67 |
| Thrombolysis In Myocardial Infarction flow grade after percutaneous coronary intervention | |||
| 0 | 7 (4%) | 3 (4%) | 0.96 |
| 1 | 5 (3%) | 2 (3%) | 0.96 |
| 2 | 21 (13%) | 7 (10%) | 0.58 |
| 3 | 133 (80%) | 57 (83%) | 0.65 |
| Use of drug-eluting stent | 33 (20%) | 18 (26%) | 0.30 |
| Use of thrombus aspiration device | 10 (6%) | 1 (1%) | 0.13 |
| Glycoprotein IIb/IIIa-inhibitor use | 160 (96%) | 68 (99%) | 0.37 |
⁎ Defined as low-density lipoprotein cholesterol level ≥2.59 mmol/L on admission.
None of the variables assessed as predictors of significant baseline collateral flow was significant at the univariable level. Thus, multivariable logistic regression analysis was not considered appropriate.
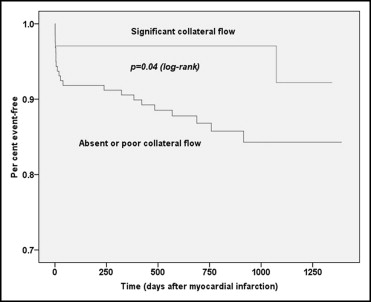
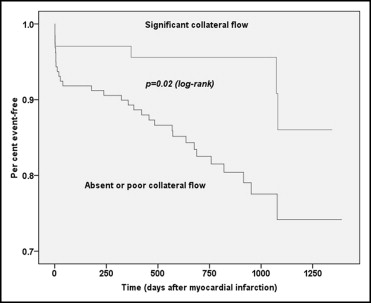
Overall, 25 patients died during the follow-up period, 22 patients (13.8%) with poor or no baseline collateral flow and 3 patients (4.4%) with significant collateral flow (risk ratio 0.90, 95% CI 0.83 to 0.98, p = 0.04). Twelve 12 (7.5%) nonfatal recurrent MIs occurred in group A compared to 2 (2.9%) in group B (risk ratio 0.95, 95% CI 0.89 to 1.01, p = 0.18). The combined major adverse cardiovascular event end point (death or nonfatal reinfarction) showed a significantly lower event rate in group B (risk ratio 0.87, 95% CI 0.79 to 0.96, p = 0.02). Kaplan-Meier curves for time to death and major adverse cardiovascular events are shown in Figures 2 and 3 .


Overall, 164 patients (72%) demonstrated symptom-onset-to-reperfusion times <6 hours and 63 patients (28%) 6 to 12 hours, respectively ( Table 2 ). Rentrop grades 2 and 3 (good collateral flow) were more frequent in patients with longer symptom-onset-to-reperfusion times ≥6 hours compared to those with times <6 hours (39.7% vs 26.2%, p = 0.04). When separately analyzing these 2 subgroups, differences in mortality and major adverse cardiovascular events remained significant only in patients with reperfusion times ≥6 hours and not in those with times <6 hours ( Table 2 ).
| Variable | Symptom-Onset-to-Reperfusion Time <6 Hours (n = 164) | Symptom-Onset-to-Reperfusion Time ≥6–12 Hours (n = 63) | ||||||
|---|---|---|---|---|---|---|---|---|
| Rentrop Grade 0 or 1 (n = 121) | Rentrop Grade 2 or 3 (n = 43) | Risk Ratio (95% CI) | p Value | Rentrop Grade 0 or 1 (n = 38) | Rentrop Grade 2 or 3 (n = 25) | Risk Ratio (95% CI) | p Value | |
| Death | 13 (10.7%) | 2 (4.7%) | 0.93 (0.85–1.02) | 0.23 | 9 (23.7%) | 1 (4.0%) | 0.79 (0.65–0.96) | 0.03 |
| Nonfatal reinfarction | 11 (9.1%) | 2 (4.7%) | 0.95 (0.87–1.04) | 0.35 | 1 (2.6%) | 0 | 0.97 (0.92–1.02) | 0.41 |
| Major adverse cardiovascular events | 21 (17.4%) | 4 (9.3%) | 0.91 (0.80–1.03) | 0.20 | 10 (26.3%) | 1 (4.0%) | 0.76 (0.62–0.94) | 0.02 |
Stay updated, free articles. Join our Telegram channel

Full access? Get Clinical Tree


