There are limited data on the impact of anemia on clinical outcomes in unstable angina and non–ST-segment elevation myocardial infarction treated with an early invasive strategy. We sought to determine the short- and long-term clinical events among patients with and without anemia enrolled in the Acute Catheterization and Urgent Intervention Triage Strategy (ACUITY) trial. Anemia was defined as baseline hemoglobin of <13 g/dl for men and <12 g/dl for women. The primary end points were composite ischemia (death, myocardial infarction, or unplanned revascularization for ischemia) and major bleeding assessed in-hospital, at 1 month, and at 1 year. Among the 13,819 patients in the ACUITY trial, information regarding anemia was available in 13,032 (94.3%), 2,199 of whom (16.9%) had anemia. Patients with anemia compared with those without anemia had significantly increased adverse event rates in-hospital (composite ischemia 6.6% vs 4.8%, p = 0.0004; major bleeding 7.3% vs 3.3%, p <0.0001), at 1 month (composite ischemia 10% vs 7.2%, p <0.0001, major bleeding 8.8% vs 3.9%, p <0.0001), and 1 year (composite ischemia 21.7% vs 15.3%, p <0.0001). Anemia was an independent predictor of death at 1 year (hazard ratio 1.77, 95% confidence interval [CI] 1.29 to 2.44, p = 0.0005). Composite ischemia was significantly more common among patients who developed in-hospital non–coronary artery bypass surgery major bleeding compared with those who did not (anemic patients 1-year relative risk 2.19, 95% CI 1.67 to 2.88, p <0.0001; nonanemic patients relative risk 2.16, 95% CI 1.76 to 2.65, p <0.0001). In conclusion, in the ACUITY trial, baseline anemia was strongly associated with adverse early and late clinical events, especially in those who developed major bleeding.
Baseline anemia is a strong independent adverse prognostic factor across the acute coronary syndrome (ACS) spectrum, as evidenced in a meta-analysis of 16 Thrombolysis In Myocardial Infarction (TIMI) trials, which also demonstrated increasing 30-day mortality for every 1 g/dl reduction in hemoglobin. Other studies have found anemia to be an independent predictor of mortality after percutaneous coronary intervention (PCI) for ACS and stable angina. There are limited data on the impact of anemia and the impact of major bleeding among anemic patients on long-term clinical events in the setting of unstable angina and non–ST-segment elevation myocardial infarction (MI) treated with early angiography. The goals of this study are to determine (1) the short- and long-term clinical events among patients with and without anemia enrolled in the Acute Catheterization and Urgent Intervention Triage Strategy (ACUITY) trial, (2) whether there were differences in clinical events using different treatment strategies (heparin + glycoprotein IIb/IIIa inhibitor vs bivalirudin + glycoprotein IIb/IIIa inhibitor vs bivalirudin alone) in anemic and nonanemic patients, and (3) clinical events among anemic and nonanemic patients who experienced in-hospital major bleeding.
Methods
The ACUITY trial was a randomized, open-label, multinational trial in which 13,819 patients who underwent an early invasive strategy for moderate- or high-risk non–ST-segment elevation MI or unstable angina were assigned to either heparin + glycoprotein IIb/IIIa inhibitor, bivalirudin + glycoprotein IIb/IIIa inhibitor, or bivalirudin alone. The full study design, inclusion and exclusion criteria, and antithrombotic dosing protocol have been described in detail previously. Briefly, patients ≥18 years with symptoms of unstable angina lasting at least 10 minutes within the preceding 24 hours were included. Exclusion criteria were shock; bleeding diathesis; major bleeding episode within 2 weeks before the episode of angina; thrombocytopenia; calculated creatinine clearance <30 ml/min; and recent administration of abciximab, warfarin, fondaparinux, fibrinolytic agents, bivalirudin, or ≥2 doses of low-molecular-weight heparin.
Patients were to undergo angiography within 72 hours of randomization and were then triaged to PCI, coronary artery bypass surgery (CABG), or medical management at the discretion of the physician. Aspirin was administered in-hospital (300 to 325 mg/day orally or 250 to 500 mg/day intravenously) and at discharge (75 to 325 mg/day), whereas the dose and timing of clopidogrel were based on local standards (a loading dose of ≥300 mg no later than 2 hours after PCI and 75 mg/day at discharge were, however, recommended in all patients).
In the present substudy, anemia was defined as baseline hemoglobin of <13 g/dl for men and <12 g/dl for women as per the American College of Physicians and World Health Organization.
The primary end point of this substudy was the occurrence of composite ischemia (death, MI, or unplanned revascularization for ischemia) and major bleeding in-hospital, at 1 month, and at 1 year among patients with and without anemia in the ACUITY trial. Major bleeding was defined as intracranial or intraocular bleeding, bleeding at the access site requiring intervention, hematoma with a diameter ≥5 cm, a reduction in hemoglobin ≥4 g/dl without an obvious bleeding source or ≥3 g/dl with a source identified, operation for bleeding, and transfusion of a blood product. These end points were consistent with the overall ACUITY trial.
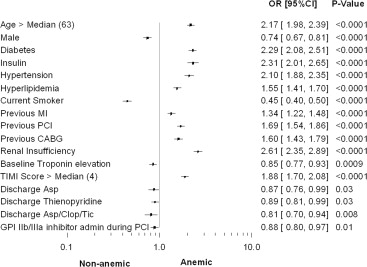
Continuous variables were summarized through means and SDs or median (Q1, Q3) and compared using the t test or Kruskal-Wallis test. Likewise, categorical variables were summarized by frequencies and proportions and compared using the Pearson chi-square test. Time-to-event data were analyzed by the Kaplan-Meier method. Multivariate models of time-to-event data were analyzed using the Cox proportional hazards model along with stepwise regression, whereas logistic regression models were fit to in-hospital events. The variables included in the model were age, gender, diabetes, hypertension, body weight, previous MI, previous coronary artery bypass graft (CABG), previous PCI, renal insufficiency, high TIMI risk score, aspirin, thienopyridine on admission, unfractionated heparin prerandomization, glycoprotein IIb/IIIa use during PCI, and number of 3-vessel disease. All statistics were held at an α-level of 0.05 and computed using SAS 9.2 (SAS Institute, Cary, North Carolina).
Results
Among the 13,819 patients with ACS in the ACUITY trial, information regarding anemia was available in 13,032 (94.3%), 2,199 of whom (16.9%) had anemia. The median [Q1, Q3] hemoglobin levels between the anemic and nonanemic groups were 11.80 [11.10, 12.50] g/dl versus 14.40 [13.60, 15.30] g/dl, p <0.0001 ( Table 1 ).
| Variable | Anemia | p Value | |
|---|---|---|---|
| Yes (n=2199) | No (n=10,833) | ||
| Age at randomization (years) | 68.00 [59.00, 76.00] | 62.00 [53.00, 70.00] | <0.0001 |
| Male | 64.6% | 71.3% | <0.0001 |
| Weight (kg) | 81.72 [70.00, 94.00] | 84.00 [73.00, 95.34] | <0.0001 |
| Diabetes mellitus | 42.9% | 24.7% | <0.0001 |
| Insulin dependent diabetes | 15.2% | 7.2% | <0.0001 |
| Hypertension | 79.3% | 64.5% | <0.0001 |
| Hyperlipidemia | 65.7% | 55.3% | <0.0001 |
| Current smoker | 17.1% | 31.5% | <0.0001 |
| Previous myocardial infarction | 36.6% | 30.1% | <0.0001 |
| Previous percutaneous coronary intervention | 49.6% | 36.8% | <0.0001 |
| Previous coronary bypass | 24.1% | 16.5% | <0.0001 |
| Renal insufficiency | 33.5% | 16.2% | <0.0001 |
| Baseline cardiac biomarker elevation | 55.3% | 60.0% | <0.0001 |
| Baseline troponin elevation | 54.6% | 58.6% | 0.001 |
| ST-segment deviation ≥1 mm | 32.4% | 35.4% | 0.007 |
| Baseline cardiac biomarker elevation or ST-segment deviation | 66.0% | 73.1% | <0.0001 |
| TIMI risk score | |||
| Low (0-2) | 8.3% | 17.3% | <0.0001 |
| Intermediate (3-4) | 50.3% | 55.3% | <0.0001 |
| High (5-7) | 41.4% | 27.3% | <0.0001 |
| Platelets (×1000) | 226.00 [186.00, 279.00] | 227.00 [191.00, 269.00] | 0.72 |
| Hemoglobin (g/dL) | 11.80 [11.10, 12.50] | 14.40 [13.60, 15.30] | <0.0001 |
| Hematocrit (%) | 35.00 [33.10, 36.95] | 42.20 [40.00, 44.90] | <0.0001 |
| White blood cell count (×1,000,000) | 7.40 [6.00, 9.40] | 8.20 [6.70, 10.00] | <0.0001 |
| Creatinine (mg/dL) | 1.08 [0.90, 1.30] | 1.00 [0.80, 1.10] | <0.0001 |
| Creatinine clearance (mL/min) | 71.62 [53.25, 97.33] | 89.62 [68.46, 114.51] | <0.0001 |
| C-reactive protein (mg/dL) | 0.80 [0.39, 3.10] | 0.53 [0.30, 1.40] | <0.0001 |
| Number of coronary lesions per patient | 4.46 ± 2.99 | 4.01 ± 2.92 | <0.0001 |
| 1 vessel CAD | 16.1% | 18.9% | 0.02 |
| 2 vessel CAD | 27.6% | 28.2% | 0.68 |
| 3 vessel CAD | 48.7% | 43.2% | 0.0004 |
| Jeopardy score | 2.33 ± 2.80 | 2.37 ± 2.75 | 0.70 |
| Ejection fraction (%) | 66.10 [58.20, 73.00] | 65.70 [57.20, 72.90] | 0.74 |
There were significant differences in the baseline variables between the anemic and nonanemic groups as displayed in Table 1 and Figure 1 . Anemic patients were older, more likely to be women, and more frequently had diabetes, hypertension, hyperlipidemia, renal insufficiency, or a history of previous MI, previous PCI, or previous CABG. Anemic patients had a higher TIMI risk score on average compared with nonanemic patients. There were differences in the angiographic variables between the 2 groups.
Fewer patients had angiography (98.6% vs 99.4%, p = 0.0002), PCI (52.9% vs 57.5%, p <0.0001), and glycoprotein IIb/IIIa inhibitor use during PCI (35.7% vs 38.6%, p = 0.01) in the anemic group versus nonanemic group, respectively ( Table 2 ).
| Variable | Anemia | p Value | |
|---|---|---|---|
| Yes (n=2199) | No (n=10,833) | ||
| Angiography was done | 98.6% | 99.4% | 0.0002 |
| Admission to randomization (h) | 12.20 ± 40.52 | 10.71 ± 90.87 | 0.23 |
| Randomization first study drug (min) | 1.44 ± 3.14 | 1.28 ± 2.94 | 0.03 |
| First study drug to angiogram (h) | 11.61 ± 21.06 | 11.72 ± 30.68 | 0.84 |
| First study drug to first actual PCI (h) | 14.61 ± 25.72 | 14.88 ± 34.30 | 0.76 |
| Treatment Strategy | |||
| PCI | 52.9% | 57.5% | <0.0001 |
| CABG | 11.9% | 11.0% | 0.24 |
| Medical management | 35.2% | 31.4% | 0.0007 |
| Antithrombin medications | |||
| Pre-randomization | 65.5% | 64.3% | 0.28 |
| Unfractionated heparin | 44.0% | 40.4% | 0.002 |
| Low-molecular-weight heparin | 24.1% | 25.8% | 0.10 |
| Post randomization – pre angiography | |||
| Bivalirudin | 64.2% | 65.3% | 0.33 |
| Unfractionated heparin | 18.3% | 16.9% | 0.13 |
| Enoxaparin | 15.0% | 16.5% | 0.08 |
| Antiplatelet medications (pre-intervention) | |||
| Aspirin | 97.7% | 98.0% | 0.36 |
| Thienopyridine | 67.7% | 63.2% | <0.0001 |
| Clopidogrel | 67.1% | 62.8% | 0.0001 |
| Ticlopidine | 1.0% | 0.7% | 0.22 |
| Glycoprotein IIb/IIIa inhibitor administration pre-angiography | 34.4% | 33.3% | 0.32 |
| Eptifibatide | 24.5% | 20.9% | 0.0003 |
| Tirofiban | 9.6% | 12.1% | 0.0009 |
| Abciximab | 0.3% | 0.2% | 0.64 |
| Glycoprotein IIb/IIIa inhibitor administration during PCI | 35.7% | 38.6% | 0.01 |
| Eptifibatide | 24.4% | 23.3% | 0.29 |
| Tirofiban | 5.5% | 7.9% | <0.0001 |
| Abciximab | 5.9% | 7.4% | 0.01 |
At 1 year, fewer patients were on aspirin (85.9% vs 88.5%, p = 0.001), a statin (75% vs 77.7%, p = 0.01), or a β blocker (69.9% vs 72.6%, p = 0.01), and more patients were on a thienopyridine (49% vs 43.6%, p <0.0001) and an angiotensin-converting enzyme inhibitor (59.7% vs 56.3%, p = 0.006) in the anemic group versus the nonanemic group, respectively ( Table 3 ).
| Anemia | p Value | ||
|---|---|---|---|
| Yes (n=2199) | No (n=10,833) | ||
| Admission | |||
| Aspirin | 76.2% | 68.0% | <0.0001 |
| Thienopyridines | 35.0% | 22.0% | <0.0001 |
| Statins | 58.2% | 46.8% | <0.0001 |
| Beta blockers | 58.2% | 47.3% | <0.0001 |
| ACE inhibitors | 52.9% | 40.2% | <0.0001 |
| Pre-procedure | |||
| Aspirin | 75.3% | 74.8% | 0.59 |
| Thienopyridines | 42.6% | 40.2% | 0.03 |
| Statins | 33.2% | 27.4% | <0.0001 |
| Beta blockers | 53.3% | 49.8% | 0.003 |
| ACE inhibitors | 34.2% | 24.5% | <0.0001 |
| Discharge | |||
| Aspirin | 84.4% | 86.2% | 0.03 |
| Thienopyridines | 63.7% | 66.3% | 0.03 |
| Aspirin/clopidogrel/ticlopidine | 89.1% | 91.0% | 0.008 |
| 30-Day follow-up | |||
| Aspirin ∗ | 91.5% | 93.3% | 0.004 |
| Thienopyridines ∗ | 68.4% | 68.1% | 0.82 |
| Statins ∗ | 77.4% | 81.1% | 0.0001 |
| Beta Blockers ∗ | 74.7% | 77.3% | 0.01 |
| ACE Inhibitors ∗ | 62.4% | 59.1% | 0.004 |
| 1-Year follow-up | |||
| Aspirin ∗ | 85.9% | 88.5% | 0.001 |
| Thienopyridines ∗ | 49.0% | 43.6% | <0.0001 |
| Statins ∗ | 75.0% | 77.7% | 0.01 |
| Beta blockers ∗ | 69.9% | 72.6% | 0.01 |
| ACE inhibitors ∗ | 59.7% | 56.3% | 0.006 |
There were significantly increased rates of the following in-hospital events in the anemic group compared with the nonanemic group: composite ischemic events, cardiac death, MI, non-CABG major bleeding, non-CABG major bleeding excluding hematoma ≥5 cm, non-CABG minor bleeding, TIMI non-CABG major bleeding, and TIMI non-CABG minor bleeding ( Table 4 ; see Supplementary Table 1 for definition of TIMI bleeding classification).
| Variable | Anemia | Relative Risk [95% CI] | p Value | |
|---|---|---|---|---|
| Yes (n=2199) | No (n=10,833) | |||
| In-hospital Clinical Events | ||||
| Composite ischemic event | 6.6% | 4.8% | 1.39 [1.17, 1.67] | 0.0004 |
| Death | 1.2% | 0.6% | 2.07 [1.31, 3.26] | 0.004 |
| Cardiac | 1.0% | 0.5% | 1.92 [1.19, 3.10] | 0.01 |
| Non-cardiac | 0.1% | 0.0% | 4.93 [0.69, 34.95] | 0.13 |
| Bleeding-related | 0.0% | 0.0% | 2.46 [0.22, 27.15] | 0.43 |
| Myocardial infarction | 4.8% | 3.8% | 1.25 [1.01, 1.54] | 0.04 |
| Q-wave | 0.9% | 0.7% | 1.28 [0.78, 2.09] | 0.34 |
| Non Q-wave | 3.9% | 3.1% | 1.24 [0.98, 1.56] | 0.07 |
| Unplanned revascularization | 1.2% | 1.0% | 1.21 [0.80, 1.84] | 0.36 |
| Non-CABG major bleeding | 7.3% | 3.3% | 2.20 [1.84, 2.64] | <0.0001 |
| Non-CABG major bleeding (excluding hematoma ≥5 cm) | 6.5% | 2.4% | 2.74 [2.25, 3.35] | <0.0001 |
| CABG major bleeding (excluding hematoma ≥5 cm) | 5.8% | 5.2% | 1.12 [0.93, 1.35] | 0.23 |
| CABG major bleeding | 5.8% | 5.2% | 1.12 [0.93, 1.35] | 0.25 |
| Non-CABG minor bleeding | 21.1% | 17.2% | 1.23 [1.12, 1.35] | <0.0001 |
| CABG minor bleeding | 1.4% | 1.1% | 1.32 [0.89, 1.95] | 0.18 |
| TIMI non-CABG major bleeding | 2.2% | 1.1% | 2.01 [1.45, 2.80] | <0.0001 |
| TIMI non-CABG minor bleeding | 6.1% | 4.8% | 1.28 [1.07, 1.54] | 0.01 |
| 30-Day Clinical Events | ||||
| Composite ischemic event | 10.0% | 7.2% | 1.40 [1.20, 1.62] | <0.0001 |
| Death | 2.7% | 1.2% | 2.23 [1.64, 3.02] | <0.0001 |
| Cardiac | 2.1% | 1.1% | 1.99 [1.41, 2.80] | <0.0001 |
| Non-cardiac | 0.4% | 0.1% | 3.74 [1.58, 8.88] | 0.001 |
| Bleeding-related | 0.1% | 0.1% | 2.49 [0.62, 9.96] | 0.18 |
| Unknown cause | 0.1% | 0.0% | 4.99 [0.70, 35.42] | 0.07 |
| Myocardial infarction | 6.1% | 5.0% | 1.23 [1.02, 1.49] | 0.03 |
| Q-wave | 1.3% | 1.0% | 1.26 [0.83, 1.91] | 0.27 |
| Non–Q-wave | 4.8% | 4.0% | 1.22 [0.98, 1.51] | 0.07 |
| Unplanned revascularization | 2.7% | 2.5% | 1.10 [0.83,1.46] | 0.52 |
| Non-CABG major bleeding | 8.8% | 3.9% | 2.30 [1.94, 2.73] | <0.0001 |
| Non-CABG major bleeding (excluding hematoma ≥5 cm) | 7.9% | 3.0% | 2.71 [2.25, 3.27] | <0.0001 |
| CABG major bleeding (excluding hematoma ≥5 cm) | 7.1% | 6.4% | 1.12 [0.94, 1.33] | 0.20 |
| CABG major bleeding | 7.1% | 6.4% | 1.12 [0.94, 1.33] | 0.20 |
| Non-CABG minor bleeding | 22.8% | 18.2% | 1.28 [1.16, 1.41] | <0.0001 |
| CABG minor bleeding | 1.6% | 1.3% | 1.20 [0.83, 1.73] | 0.34 |
| TIMI non-CABG major bleeding | 2.7% | 1.3% | 2.08 [1.53, 2.82] | <0.0001 |
| TIMI non-CABG minor bleeding | 6.9% | 5.2% | 1.34 [1.12, 1.60] | 0.002 |
| 1- Year Clinical Events | ||||
| Composite ischemic event | 21.7% | 15.3% | 1.48 [1.33, 1.64] | <0.0001 |
| Death/myocardial infarction | 15.1% | 9.6% | 1.61 [1.42, 1.82] | <0.0001 |
| Death/Q-wave myocardial infarction | 8.8% | 4.6% | 2.01 [1.69, 2.38] | <0.0001 |
| Death | 7.2% | 3.4% | 2.35 [1.94, 2.84] | <0.0001 |
| Cardiac | 3.6% | 2.1% | 1.81 [1.40, 2.35] | <0.0001 |
| Non-cardiac | 2.8% | 0.9% | 3.36 [2.41, 4.70] | <0.0001 |
| Bleeding related | 0.1% | 0.1% | 2.14 [0.55, 8.26] | 0.26 |
| Unknown cause | 0.8% | 0.3% | 3.33 [1.80, 6.13] | <0.0001 |
| Myocardial infarction | 9.1% | 7.0% | 1.28 [1.09, 1.50] | 0.003 |
| Q-wave | 1.8% | 1.5% | 1.10 [0.76, 1.59] | 0.63 |
| Non–Q-wave | 7.3% | 5.7% | 1.30 [1.09, 1.55] | 0.004 |
| Unplanned revascularization | 9.9% | 8.8% | 1.15 [0.98, 1.33] | 0.08 |
Stay updated, free articles. Join our Telegram channel

Full access? Get Clinical Tree


