Patients with anatomic repair of transposition of the great arteries (TGA) can present with branch pulmonary artery (PA) stenosis; however, its relation to an abnormal cardiopulmonary response to exercise is unknown. We investigated the relation between the PA anatomy and pulmonary blood flow (PBF) distribution and the cardiopulmonary response to exercise in patients with anatomic repair of TGA. We used cardiopulmonary exercise testing and magnetic resonance imaging to study 55 consecutive patients (62% male; age 14.4 ± 2.3 years) who had undergone neonatal anatomic repair of TGA. The peak oxygen uptake and slope of carbon dioxide elimination/minute ventilation was 79 ± 15% of predicted and 29.8 ± 3.8, respectively. Abnormal peak oxygen uptake (R = 0.363, p = 0.0082) and slope of carbon dioxide elimination/minute ventilation (R = 0.612, p <0.0001) values were associated with an abnormal right/left PBF distribution. However, although an increased ventilatory response to exercise appeared to be primarily related to an abnormal right/left PBF distribution, exercise capacity appeared to be related to the extent of the proximal PA branches and main PA stenosis (R = 0.476, p = 0.0004), suggesting that mechanical obstruction to PBF during exercise could be the main mechanism causing an abnormal exercise capacity. In conclusion, an abnormal PBF distribution related to branch PA stenosis or hypoplasia was associated with a reduced exercise capacity and increased ventilatory drive during exercise in patients with anatomic repair of TGA. Cardiopulmonary exercise test data can complement the anatomic and magnetic resonance imaging data in selecting those lesions that are functionally important.
Chronotropic incompetence, reduced levels of physical activity, longer follow-up time, and, more recently, residual pressure gradients across the right ventricular outflow tract and pulmonary artery (PA) branches documented by echocardiography have all been suggested to influence exercise capacity after the arterial switch operation. With long-term follow-up data becoming available, it was recently reported that young patients with anatomically repaired transposition of the great arteries (TGA) can present with, not only a reduced exercise capacity, but also an increased ventilatory response to exercise. The mechanisms of an increased ventilatory response to exercise in this setting are completely unknown. An increased ventilatory response to exercise has been observed in many patients with different underlying congenital heart defects and has been demonstrated to be associated with an adverse prognosis. The purpose of the present study was to investigate whether, in children and young adults with neonatal, anatomic repair of TGA, a reduced exercise capacity and abnormal ventilatory response to exercise were related to mechanical obstruction at the level of the PA tree or were related to an abnormal pulmonary blood flow (PBF) distribution.
Methods
As a part of a clinical follow-up protocol, all patients who have undergone the arterial switch operation for TGA at our institution undergo surveillance investigations, including a cardiopulmonary exercise test and magnetic resonance imaging, during the transition to adult care. From January 2003 to March 2009, 60 consecutive patients prospectively completed the clinical protocol. None of the patients studied had a known coronary obstruction, had evidence of pulmonary arterial hypertension, or had achieved submaximal effort during the exercise test.
Patient information was collected from the institutional cardiac databases. The baseline demographics, diagnoses in addition to TGA (including coronary artery pattern), surgical data, and procedures before the arterial switch operation were obtained from the patient charts. Data on reintervention after the arterial switch operation were obtained. The institutional committee on human research approved the study.
The exercise test was performed using an electronically braked ergometer cycle. Oxygen uptake (VO 2 ), carbon dioxide elimination, and minute ventilation were measured using a computerized breath-by-breath analyzer (Medgraphics, St. Paul, Minnesota). The patients performed a symptom-limited maximal exercise test using a continuous incremental bicycle protocol with a work rate increment of 10 to 20 W/min, with the aim of completing the test within 10 to 12 minutes of exercise. A 12-lead electrocardiogram and transcutaneous oxygen saturation were also monitored throughout the study, and the cuff blood pressure was determined manually every 2 minutes. The test was terminated when the patient reported exhaustion, with a respiratory exchange ratio of ≥1.09. The technical details of the measurement of the peak VO 2 and the slope of carbon dioxide elimination/minute ventilation (VE/VCO 2 slope) have been previously published. Before exertion, a spirometric measurement was performed to assess the forced vital capacity and forced expired volume in the first second. Standard equations were used to generate the predicted values for the baseline spirometric and peak exercise parameters. The criteria for abnormality in the peak heart rate and peak VO 2 results were a peak heart rate <85% of the predicted value (with the predicted peak heart rate calculated according to the formula: 200 − age in years) and peak VO 2 <84% of predicted according to age and gender. Reference data from a local cohort of 160 healthy age-matched patients referred for investigation of cardiac murmur and with normal echocardiographic findings were used to define the VE/VCO 2 slope as normal (within 95% prediction band) or abnormal.
On the same day as the exercise test, all patients underwent a magnetic resonance imaging study. Magnetic resonance imaging was performed using 1.5 T (Avanto or Symphony Maestro, Siemens Medical Systems, Erlangen, Germany) according to a published imaging protocol. In brief, the protocol consisted of scout images through the thorax, one half Fourier single shot turbo spin echo “black blood” axial images through the heart and great vessels, balanced steady state free precession cine images through the heart (long axis, short axis, and right and left ventricular outflow tracts in 2 planes), black blood turbo spin echo images in 2 perpendicular planes through the pulmonary trunk and both branch PAs; and gadolinium-enhanced magnetic resonance angiography of the pulmonary vasculature (gadopentetate dimeglumine, 0.2 to 0.4 ml/kg). Through plane flow through the pulmonary trunk was performed just above the pulmonary valve, prescribed from 2 perpendicular pulmonary trunk views, as described previously. The branch PA flow was measured through the plane in both PA branches, prescribed from 2 perpendicular views. Magnetic resonance imaging was performed without anesthesia or sedation. Blood flow was calculated from the phase-contrast images using a semiautomated vessel edge detection algorithm, with minor operator corrections using Argus flow analysis software (Siemens Medical Systems). Net forward flow was used to enable inclusion of patients with pulmonary incompetence in the study, such that net forward flow (ml) = total forward flow (ml) − total backward flow (ml). The percentage of total blood flow to each lung was calculated as the net forward branch PA blood flow (ml) divided by the net forward pulmonary trunk blood flow (ml). A single experienced investigator who was unaware of the other data analyzed and processed the magnetic resonance phase-contrast data. The PBF distribution was described using the relative right PA flow (%) as the right PA flow/(right + left PA flow). The proximal and distal main pulmonary trunk diameters (both anteroposterior and lateral) and areas and proximal (immediately after the main PA bifurcation) and distal (at the hilum) bilateral PA branch diameters (anteroposterior and superoinferior) and areas were measured using a combination of the black blood turbo spin echo and magnetic resonance angiographic images. The magnetic resonance angiographic images were used in the first instance in all patients to assess the diameter, because this is a 3-dimensional data set. However, in patients with severe stenosis, the signal can be lost in the magnetic resonance angiographic images, leading to an overestimation of stenosis. Therefore, in patients with severe PA stenosis, the PA diameters and areas were remeasured using black blood spin echo images, because they were not affected by this signal loss. Also, although the images are 2-dimensional, they can give an accurate assessment when the stenoses are severe. The sum of the areas of the proximal right PA branch, proximal left PA branch, and proximal main PA was used as a global measure of the PA tree resistance to blood flow. All variables (diameters, areas, volumes, and flows) were indexed for the body surface area. We arbitrarily defined >70% blood flow to the 1 lung as an abnormal PBF distribution.
The data distribution was tested using the Shapiro-Wilk test. All normally distributed data are expressed as the mean ± SD. Peak VO 2 is expressed as both an absolute value and a percentage of the predicted value. When the relative right PA flow was plotted against the peak VO 2 and VE/VCO 2 slope, it was evident that a parabolic distribution of data points was present. Thus, a low value (suggestive of low right PBF) had the same effect as a high value (suggestive of low left PBF). To transform the relation between relative right PA flow and both peak VO 2 and VE/VCO 2 slope into a line, logarithmic transformation of the ratio was performed, and the absolute value was used. The effect of the demographic, surgical, and magnetic resonance data on peak VO 2 % and VE/VCO 2 slope was assessed using univariate and multivariate analyses. The correlations between the exercise and magnetic resonance data were estimated using Pearson’s correlation. A p value ≤0.05 was accepted as statistically significant.
Results
The right and left PA flow distribution on magnetic resonance imaging was not determined in the first 5 patients and these patients were excluded from the present analysis. The remaining 55 patients represented the cohort analyzed in the present study (mean age 14.4 ± 2.3 years, range 9 to 19; 34 males, 62%). All patients had undergone the arterial switch operation with the Lecompte maneuver in the neonatal period, and 41 had undergone balloon atrial septostomy before surgery. Of the 55 patients, 44 (80%) had the usual coronary artery pattern seen in patients with TGA. The remaining 11 patients had a variant coronary artery pattern. Also, 13 patients had a ventricular septal defect, which had been closed surgically in 10. Three patients had required repair of an associated aortic coarctation. All patients had undergone reparative surgery within the first 4 weeks after birth using the trap-door technique for coronary artery transfer.
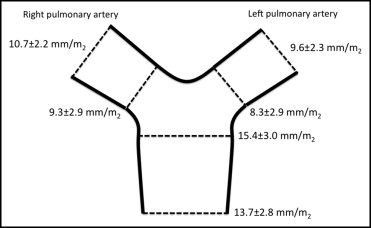
The details of the magnetic resonance image analysis are listed in Table 1 . All patients completed the full magnetic resonance protocol. Aortic regurgitation was present in 12 patients (22%) and pulmonary regurgitation in 18 patients (33%). The left and right ventricular ejection fraction was within the normal range in all subjects. An abnormal PBF distribution (>70% of blood flow to 1 lung) was present in 10 (18%, right lung in 7 patients and left lung in 3). The diameters of the proximal and distal main PA trunk, right PA branch, and left PA branch are shown in Figure 1 . An abnormal right/left PBF distribution was related to focal stenosis in 8 patients (right PA in 4 and left PA in 4) and to entire hypoplasia of the PA in 4 (right PA in 1 and left PA in 3).
| Variable | Value |
|---|---|
| Left ventricular end-diastolic volume (ml/m 2 ) | 85 ± 18 |
| Left ventricular end-systolic volume (ml/m 2 ) | 30 ± 10 |
| Left ventricular ejection fraction (%) | 65 ± 6 (50–79) |
| Left ventricular stroke volume index (ml/beat/m 2 ) | 54 ± 13 |
| Cardiac index (ml/min/m 2 ) | 4.1 ± 0.7 |
| Right ventricular end-diastolic volume (ml/m 2 ) | 86 ± 20 |
| Right ventricular end-systolic volume (ml/m 2 ) | 31 ± 11 |
| Right ventricular ejection fraction (%) | 65 ± 7 (49–81) |
| Right ventricular stroke volume index (ml/beat/m 2 ) | 54 ± 13 |
| Heart rate (beats/min) | 78 ± 15 |
| Aortic regurgitation (%) | 2.6 ± 6.7 (0–35) |
| Pulmonary regurgitation (%) | 2.3 ± 6.4 (0–45) |
| Right pulmonary artery flow (%) | 53 ± 15 (10–90) |
| Left pulmonary artery flow (%) | 47 ± 15 (10–90) |
All patients completed a maximum exercise test. Detailed results of the exercise test are listed in Table 2 . Overall, the exercise capacity was 79 ± 15% of predicted, and 35 patients (64%) had an abnormal peak VO 2 (≤84% of the predicted value). Abnormal ventilatory efficiency (greater than the ninety-fifth percentile for age) was observed in 10 patients (18%). All patients had normal arterial oxygen saturation (≥96%) at rest and during exercise and normal spirometry results.
| Variable | Value |
|---|---|
| Body surface area (m 2 ) | 1.61 ± 0.30 |
| Body mass index (kg/m 2 ) | 21.4 ± 4.2 |
| Vital capacity | |
| Measured value (L) | 3.7 ± 1.1 |
| Percentage of predicted (%) | 95 ± 12 |
| Expired volume in first second | |
| Measured value (L) | 3.2 ± 1.0 |
| Percentage of predicted (%) | 94 ± 13 |
| Peak heart rate | |
| Measured value (beats/min) | 181 ± 14 |
| Percentage of predicted (%) | 98 ± 8 |
| Peak workload | |
| Measured value (W) | 171 ± 64 |
| Percentage of predicted (%) | 90 ± 17 |
| Peak oxygen uptake | |
| Measured value (L/min) | 1.93 ± 0.67 |
| Percentage of predicted (%) | 79 ± 15 |
| Slope of carbon dioxide elimination/minute ventilation | 29.8 ± 3.8 |
| Respiratory exchange ratio | 1.12 ± 0.03 |
On univariate analysis, a reduced peak VO 2 % was associated with a younger age at testing, a lower cardiac index at magnetic resonance imaging, and an abnormal PBF distribution. On multivariate analysis, only younger age at testing and an abnormal PBF distribution were associated with a lower peak VO 2 % ( Table 3 ). Variables that predicted ventilatory inefficiency on univariate analysis were female gender and abnormal PBF distribution; however, only abnormal PBF distribution was predictive of abnormal ventilatory efficiency on multivariate analysis.
| Variable | R | p Value |
|---|---|---|
| Univariate predictors of percentage of peak oxygen uptake | ||
| Age at exercise test (years) | 0.269 | 0.044 |
| Body mass index (kg/m 2 ) | 0.172 | 0.222 |
| Cardiopulmonary bypass time (min) | −0.261 | 0.080 |
| Male gender | −0.062 | 0.663 |
| Ventricular septal defect closure | −0.237 | 0.104 |
| Cardiac index | 0.291 | 0.038 |
| Left ventricular ejection fraction (%) | 0.136 | 0.341 |
| Right ventricular ejection fraction (%) | 0.238 | 0.093 |
| Aortic regurgitation (%) | −0.109 | 0.442 |
| Pulmonary regurgitation (%) | −0.184 | 0.192 |
| Abnormal right/left pulmonary blood flow split | −0.350 | 0.011 |
| Multivariate predictors of percentage of peak oxygen uptake | ||
| Age at exercise test | 0.284 | 0.039 |
| Abnormal right/left pulmonary blood flow split | −0.344 | 0.014 |
| Univariate predictors of slope of carbon dioxide elimination/minute ventilation | ||
| Age at exercise test (years) | −0.013 | 0.927 |
| Body mass index (kg/m 2 ) | −0.133 | 0.347 |
| Cardiopulmonary bypass time (min) | −0.119 | 0.430 |
| Male gender | −0.365 | 0.0078 |
| Ventricular septal defect closure | 0.007 | 0.963 |
| Cardiac index | −0.049 | 0.728 |
| Left ventricular ejection fraction (%) | 0.173 | 0.226 |
| Right ventricular ejection fraction (%) | −0.013 | 0.929 |
| Aortic regurgitation (%) | −0.185 | 0.189 |
| Pulmonary regurgitation (%) | 0.0582 | 0.682 |
| Abnormal right/left pulmonary blood flow split | 0.458 | 0.0006 |
| Multivariate predictors of slope of carbon dioxide elimination/minute ventilation | ||
| Abnormal right/left pulmonary blood flow split | 0.458 | 0.0006 |
Stay updated, free articles. Join our Telegram channel

Full access? Get Clinical Tree


