Ectopic Rhythms and Premature Depolarizations
Ectopic depolarizations can arise from many areas of the heart, but the surface ECG is markedly limited in its ability to precisely define the origin of such ectopic activity. Although various ECG guidelines have been proposed to distinguish supraventricular depolarization from ventricular depolarizations, for example, none are foolproof. Nevertheless, knowledge of the origin of impulse formation has become critical in the current era of catheter ablation. Recording intracardiac electrograms is the most reliable method of defining the origin of ectopic activity. Such recordings have thus provided the most accurate method of localizing and characterizing ectopic activity and have made us aware of the many limitations of the surface ECG in the evaluation of these arrhythmias. More recently, Hariman et al.1,2,3,4 have demonstrated that the use of high-gain specially filtered electrograms (0.1 to 25 to 50 Hz) can be used to detect automaticity in ectopic foci of the ventricle, atrium, and atrioventricular (A-V) junction (AVJ). The frequency with which such signals can be obtained has not yet been evaluated. However, it is logical that, analogous to sinus node electrograms, automaticity could be detected in very well-localized areas. Another potential method to localize and postulate mechanisms of arrhythmias is through the use of recording monophasic action potentials (MAPs) to record afterdepolarizations.5,6,7,8,9 While many accept MAP recordings, much concern exists in my mind as to whether what is recorded is truly responsible for the arrhythmia it is being used to localize. In my opinion, further validation of these techniques demonstrating a causal relationship to arrhythmogenesis is needed before this technique is applied clinically.
Atrial Depolarizations
The ability to assess atrial activity by standard ECG criteria is limited. Atrial anatomy, prior surgery, fibrosis, drugs, and atrial position in the thorax can influence propagation of atrial activity and, therefore, P-wave morphology. Thus, the predictive accuracy of P-wave morphology for sites of ectopic atrial impulses is limited in the presence of these factors. Although a P wave in the surface ECG is the manifestation of atrial activation, even the absence of P waves cannot be taken to exclude the presence of atrial activity. In an occasional patient, the surface ECG demonstrates the absence of P waves, a normal QRS complex, and a regular (Fig. 7-1) or an irregular rhythm (Fig. 7-2), suggesting either a junctional (His bundle) rhythm with atrial quiescence or atrial fibrillation. In such cases, atrial electrograms frequently can be recorded in either the left or right atrium, and in some cases they may be localized to a discrete site within one or both atria (Fig. 7-2).10,11,12 This situation occurs not uncommonly in the setting of chronic heart disease (particularly rheumatic heart disease), with dilated diseased atria.12 Moreover, in our experience, during so-called sinoventricular conduction that is due to hyperkalemia, atrial electrograms have always been recorded. Thus, because atrial activity may be present without representation on the ECG, intracardiac recordings may be the only method of assessing unexplained supraventricular rhythms.
Endocardial mapping of the atria is a tool with which the site of origin of atrial premature depolarizations (APDs) can be ascertained.13 Because P-wave morphology on the surface ECG is determined by the patterns of interatrial and intra-atrial conduction, which can be markedly affected by disease and/or drugs, the ECG cannot always be used accurately before the site of origin of APDs.11,14,15,16
Figure 7-3 demonstrates an APD that originates in the left atrium. The pulmonary veins are an important source of APDs. Haissaguerre et al.17,18 have shown that APDs originating in the pulmonary veins can initiate atrial fibrillation. Cure of atrial fibrillation can be accomplished by ablating such foci.17,18 Other frequent sites of APDs and atrial tachycardias are the atrial appendages, crista terminalis, coronary sinus, ligament of Marshall, superior vena cava, and fibers around the mitral and tricuspid valve. The relative frequency of these sites, and their electrocardiographic features, in a large series of atrial tachycardias was recently reported by Kistler et al. (Fig. 7-4).19 I believe the ECG is limited in precisely localizing the site of atrial foci not only because of limitations sited in preceding paragraphs, but because the entire P wave is frequently not discernible from the T wave. Because superiorly directed P waves can be observed with APDs that originate low in the right atrium, as well as in the left atrium or coronary sinus, intracardiac recording is the only method of localizing the origin of such P waves. Moreover, if P-wave morphologies of APDs appear similar to sinus P waves, the only method of differentiating those premature impulses from sinus arrhythmia or sinus node reentry (see Chapter 8) or ectopic impulses
in the region of the sinus node is mapping the sequence of atrial activation of the early complexes. An atrial activation sequence different from that during sinus rhythm confirms the premature complexes as ectopic, despite a surface P-wave morphology similar to sinus. Automaticity (suggested by recording phase 4 activity) and triggered activity (suggested by recording delayed afterdepolarizations) have been postulated as the mechanism of APDs2,3 based on experimental studies.20,21,22,23 How valid these conclusions are and, if they are, how frequent such mechanisms are operative, remain speculative. Certainly many of the atrial tachycardias that are catecholamine sensitive are likely to be due to these mechanisms. The morphology of the electrogram at the site of origin, that is, fractionated, split, etc., does not determine the mechanism of the APD. It is only a reflection of propagation of the atrial impulse.
in the region of the sinus node is mapping the sequence of atrial activation of the early complexes. An atrial activation sequence different from that during sinus rhythm confirms the premature complexes as ectopic, despite a surface P-wave morphology similar to sinus. Automaticity (suggested by recording phase 4 activity) and triggered activity (suggested by recording delayed afterdepolarizations) have been postulated as the mechanism of APDs2,3 based on experimental studies.20,21,22,23 How valid these conclusions are and, if they are, how frequent such mechanisms are operative, remain speculative. Certainly many of the atrial tachycardias that are catecholamine sensitive are likely to be due to these mechanisms. The morphology of the electrogram at the site of origin, that is, fractionated, split, etc., does not determine the mechanism of the APD. It is only a reflection of propagation of the atrial impulse.
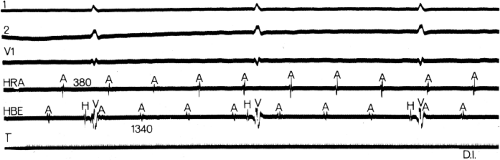 FIGURE 7-1 Atrial tachycardia in the absence of P waves on the surface QRS. Leads 1, 2, and V1 are shown with electrograms from the high-right atrium (HRA), His bundle (HBE), and time lines (T). There is a dissociation of atrial activity and ventricular activity; thus, complete heart block is present. Simultaneously, a regular atrial rhythm at a cycle length of 380 msec is seen in the intracardiac recordings, yet there are no distinct P waves on the surface ECG. Hyperkalemia with so-called “sinoventricular rhythm” was assumed to be present in the patient. |
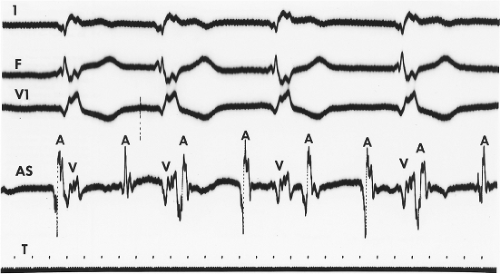 FIGURE 7-2 Atrial tachycardia with absence of P waves on the surface ECG. ECG leads 1, F, and V1 are shown with an atrial electrogram recorded at the low atrial septum (AS). The surface ECG demonstrates an irregular rhythm and no P waves, suggesting atrial fibrillation. However, an intra-atrial electrogram from the AS revealed atrial tachycardia (A-A = 375 msec) with variable block. T, time line. |
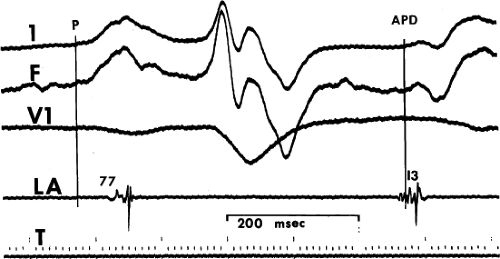 FIGURE 7-3 Atrial mapping to localize the origin of atrial premature depolarization (APD). Multiple APDs with bizarre P-wave morphology arise in the left atrium (LA) near the left inferior pulmonary vein. The local electrogram at that site begins before the onset of the P wave, with the rapid deflection occurring 13 msec after the onset of the P wave in the surface ECG. This was the earliest site recorded from either atria. T, time line. (From Josephson ME, Scharf DL, Kastor JA, et al. Atrial endocardial activation in man. Electrode catheter technique for endocardial mapping. Am J Cardiol 1977;39:972.) |
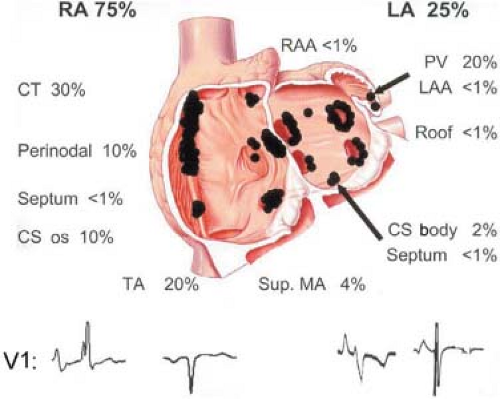 FIGURE 7-4 Sites of origin of atrial tachycardias. The sites of mapped atrial tachycardias are shown on a schema of the heart. P waves characterizing these sites are possible, with limitations. (Modified from Kistler PM, Roberts-Thomson KC, Haqqani HM, et al. P-wave morphology in focal atrial tachycardia: development of an algorithm to predict the anatomic site of origin. J Am Coll Cardiol 2006;48:1010–1017.) |
The site of origin of an atrial impulse can affect the P-R intervals.24,25,26 Such an apparent alteration in A-V conduction (i.e., changing P-R interval) may result from a different input into the A-V node, either qualitatively or in relationship to the activation of the remainder of the atrium. An example of that phenomenon is depicted in Figure 7-5; different atrial rhythms are associated with different P-R intervals despite identical A-H intervals. This situation is a result of an earlier input into the A-V node relative to atrial activation during the rhythm shown on the left. Shorter A-H intervals than sinus are more often observed with ectopic atrial activation originating in the coronary sinus or inferoposterior left atrium (Fig. 7-6). The response of the A-V node to pacing and premature atrial stimulation from different sites suggests that in some instances atrial activation originating in the coronary sinus seems to bypass part of the node, leading to shorter A-V nodal conduction and Wenckebach cycles.
Finally, it is important to distinguish atrial echoes that are due to reentry in the sinus node, A-V node, or via a concealed A-V bypass tract from APDs. The relationship of these reentrant phenomena to conduction delay and the specific patterns of atrial activation associated with these echoes are discussed in Chapters 8 and 10.
Junctional (His Bundle or A-V Nodal) Depolarizations
His bundle depolarizations can be definitively recognized only by intracardiac recordings, especially if their manifestations are concealed. Junctional (most commonly, His bundle depolarizations) most frequently take the form of escape rhythms in the presence of sinus node dysfunction (Chapter 3) or A-V
nodal block (Chapter 4). These escape rhythms usually have a QRS morphology identical to that during sinus rhythm. However, the hallmark of these rhythms is a His bundle deflection that precedes ventricular depolarization by a normal or greater than normal (in the case of bradycardia-dependent intra- or infra-His conduction disturbances) H-V interval (Fig. 7-7). In the latter instance (i.e., intra- or infra-His delay) the QRS usually is aberrant. Retrograde atrial activation may or may not accompany His bundle rhythms, and it depends on the ability of the A-V node to conduct impulses retrogradely at the rate of the His bundle rhythm. Although rapid conduction to the atrium is demonstrated in Figure 7-7, in which atrial activation precedes ventricular activation, variable retrograde conduction patterns may be presented, producing unusual rhythms. One such rhythm is a bigeminal pattern produced by a His bundle rhythm that is due to retrograde dual A-V nodal pathways and A-V nodal echoes (Fig. 7-8; see Chapter 8). Retrograde conduction during His bundle escape rhythms (or those due to triggered activity) is uncommon in the presence of digitalis intoxication, in the absence of catecholamines, because of coexistent impairment of A-V nodal conduction by digitalis. Retrograde conduction can occur in these circumstances in the presence of heightened symptomatic tone that can reverse digitalis A-V nodal blocking effects and enhances its ability to produce enhanced impulse formation. The site of origin of His bundle rhythms may differ. Hariman et al.,1 using high-gain specially filtered unipolar signals, have detected phase 4 slope in such rhythms. He suggested that such junctional rhythms may arise in the node because overdrive suppression by atrial pacing did not depend on the impulse reaching the His bundle (i.e., during A-V nodal block) (Fig. 7-9).1 However, electrotonic interactions within the node at the N-H region could alter the resulting escape rhythm. Theoretically, an automatic His bundle rhythm should demonstrate a greater degree of overdrive suppression than the A-V Node because it is lower in the hierarchy of “pacemaker” activity and it is sodium dependent. This should result in greater overdrive suppression than the calcium-dependent A-V node since overdrive suppression is based on the Na/K exchanger. The speed of retrograde conduction to the atrium has also been suggested as a means to help localize the site of the pacemaker, with a short retrograde conduction time suggesting an A-V nodal origin. This reasoning, however, is not valid, because retrograde conduction may be rapid (even more rapid than anterograde) if a “fast” A-V nodal pathway is used in the retrograde direction (see Chapter 8). Further proof of this is provided by the similarly short
H-A times that can be observed during ventricular stimulation (see Chapter 2).
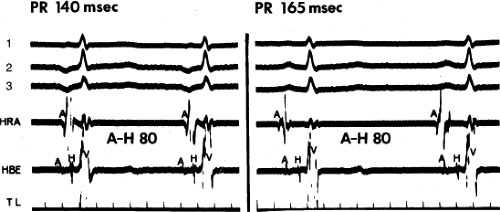 FIGURE 7-5 Different P-R intervals with identical A-H intervals, which is due to altered atrial activation and input into the atrioventricular (A-V) node. ECG leads 1, 2, and 3 are shown with a high-right atrial (HRA) and a His bundle electrogram (HBE). The panel on the left was taken during a low-right atrial rhythm (A in HBE is earliest and precedes the onset of the surface P wave). The panel on the right was taken during sinus rhythm. Note that despite a difference in P-R intervals, A-V nodal conduction remains the same (A-H = 80 msec). TL, time line.
Stay updated, free articles. Join our Telegram channel
Full access? Get Clinical Tree
 Get Clinical Tree app for offline access

|