Evaluation of Antiarrhythmic Agents
The application of recording and stimulation techniques has made it possible to evaluate the electrophysiologic effects and preferential sites of action of the entire spectrum of antiarrhythmic agents. Knowledge of major sites and characteristics of drug action may provide a database for the selection of safe and effective agents for acute and chronic therapy. The reproducible initiation and termination of paroxysmal supraventricular and ventricular tachyarrhythmias allow the electrophysiologist to develop pharmacologic means to predict successful drug therapy. This chapter presents a discussion of the current classification and action of antiarrhythmic agents and how they relate to clinical effects in humans as well as their value as antiarrhythmic agents. The use of programmed stimulation to develop therapy for tachyarrhythmias will also be outlined in detail.
Classification of Antiarrhythmic Agents
Theoretically, the choice of an antiarrhythmic agent should be based on the drug’s known electrophysiologic effects and the relationship of such effects to the arrhythmia in question. Thus, drugs having potent electrophysiologic effects on specific cardiac tissues should be chosen to treat arrhythmias arising from those tissues. The ideal situation would be the ability to select an antiarrhythmic agent that had specific activity against arrhythmia mechanisms (i.e., automaticity, triggered activity, or reentry) involving particular cardiac tissues. In other words, the pharmacologic therapy of an arrhythmia would depend on both the mechanism and the site of the arrhythmia. Unfortunately, this is not the case. As such, choice of the antiarrhythmic agent is dictated solely on the ability of a drug to produce electrophysiologic changes in specific arrhythmogenic tissue. Such empiricism is a consequence of (a) a limited understanding of drug action in vivo and (b) the reliance on in vitro drug classifications, which are based on how drugs affect ionic currents and not on how they influence particular arrhythmias. Therefore, we need a better understanding of how individual drugs work on specific arrhythmogenic tissues in vivo to learn why a given antiarrhythmic agent can behave in either an antiarrhythmic or proarrhythmic manner. This will ultimately provide clinicians with an improved ability to tailor antiarrhythmic drug therapy for particular indications.
In Vitro Classification of Antiarrhythmic Agents
The most commonly used classification of antiarrhythmic drugs is based on the ability of a drug to block specific ionic currents (e.g., sodium, potassium, or calcium), as well as those that block beta-adrenergic receptors.1,2,3 Thus, Class 1 agents are those that primarily block the fast sodium channel. These agents have been further subdivided into lA, lB, and lC agents. Class lA agents include quinidine, procainamide, and disopyramide, all of which are characterized by slowing the maximum rate of rise of the action potential as well as by increasing action potential duration. Class lB drugs are those that allegedly have little effect on the maximum rate of rise of the action potential and tend to shorten action potential duration. Included in this group are lidocaine, phenytoin, mexiletine, and tocainide. Finally, Class lC drugs, which include flecainide, encainide, moricizine, and propafenone, are those that primarily slow conduction by depression of the maximum rate of rise of depolarization of the action potential with minimal prolongation of refractoriness. Class 2 drugs fall under the general heading of beta blockers. Propranolol and metoprolol are the paradigms of this class of agents, but also includes nadolol, timolol, acebutolol, atenolol, and pindolol. Class 3 agents are those that block repolarization currents (i.e., potassium channels) and prolong action potential duration. Included in this group are amiodarone, dofetilide, bretylium, sotalol (also with beta-blocker effects), azimilide, ibutilide (IV only), dronedarone, tedisimil and the major metabolite of procainamide, n-acetyl procainamide. Class 4 agents are those agents that block the calcium channel. These primarily include nondihydropyridine agents verapamil and diltiazem, but also include dihydropyridine agents including amlodipine, felodipine, nifedipine, etc.
In my opinion, this classification suffers many limitations and has little value in assessing the choice of antiarrhythmics for a given arrhythmia. Some of these limitations follow: (a) The classification is based on in vitro studies of isolated cell types, usually the normal Purkinje fiber or, in some instances, on A-V nodal fibers. The failure to consider other tissue types and, more importantly, abnormal tissues
(e.g., ischemic fibers) leads to inadequate, and often misleading, information. For example, ischemic fibers are composed of cells that have lower resting membrane potentials and depressed fast sodium channel activity and, in addition, demonstrate abnormal intercellular coupling.4,5 Such fibers exhibit slow conduction and postrepolarization refractoriness; that is, the refractory period extends beyond completion of repolarization. In such fibers, even Class lB agents readily produce block. (b) Drugs have complex actions. Drugs may affect multiple channels (i.e., sodium channels to depress Vmax and potassium channels to prolong repolarization), and/or may affect both the autonomic nervous system as well as ionic channels (i.e., Class lA agents all have vagolytic activity, and both amiodarone and propafenone have beta-blocking activity). Moreover, antiarrhythmic agents can depress myocardial function, resulting in altered hemodynamics and autonomic reflex activity, which in turn can affect antiarrhythmic drug action. Finally, some drugs have metabolites, which may be more active and/or have different pharmacokinetics than the parent drug, neither of which is tested in vitro (i.e., procainamide and its metabolite n-acetyl procainamide). (c) Drugs exert greater electrophysiologic effects at different rates of stimulation and after prolonged periods of stimulation (i.e., use-dependence).6,7,8,9,10 The ability to bind and dissociate rapidly from channels is highly variable. For example, Class lB drugs have rapid kinetics (i.e., rapid binding and dissociation), while lC drugs have slow kinetics. Class lA drugs are intermediate. Thus, lB agents will demonstrate minimal effects at relatively slow rates, while lC agents will demonstrate significant effects at comparable or even slower rates. In addition, cells that are partially depolarized (e.g., secondary to ischemia) are associated with much slower binding kinetics of antiarrhythmics than those at more negative membrane potentials. This is one of the causes of postrepolarization refractoriness noted in such fibers. (d) Related to use-dependence is a model proposed by Hondeghem and Katzung11,12,13 termed the “modulated receptor hypothesis.” By this hypothesis, antiarrhythmic agents interact with receptors in the membrane in either the resting, activated, or inactivated state. These interactions are voltage and time dependent and appear operative for both sodium and calcium channels. Some drugs are bound primarily in the active state (i.e., Class lA agents), while others are primarily bound in the inactive state (i.e., amiodarone),14 and some (e.g., lidocaine) are bound in both active and inactive states. Use-dependence and the modulated receptor hypothesis are interactive and may lead to totally different conclusions about the electrophysiologic effects of a given agent than if the agent was evaluated on a normal isolated Purkinje fiber at a slow rate. (e) Alterations in cellular metabolism and the intra- and extracellular ionic milieu can affect a drug’s actions. Changes in extracellular potassium, intracellular calcium, and pH can affect active membrane currents through ionic channels and may induce nonspecific ionic channels.5,15,16,17,18 In addition, increased intracellular calcium decreases intercellular coupling and impairs propagation of impulses. The inhibition of the sodium/potassium pump by digitalis and the sodium/calcium pump during ischemia may also affect the action of antiarrhythmic agents. (f) Alterations in circulating catecholamines and in autonomic tone can alter electrophysiologic drug action. Many of the effects on sodium, potassium, and calcium channels can be reversed by enhanced sympathetic tone or circulating catecholamines.19 (g) Little attention has been paid to the influence of drugs on passive membrane properties, in particular, their effects on the coupling of cells and propagation through anisotropic (particularly nonuniform anisotropic) tissues. The effects on passive membrane properties may differ among agents of the same class.20 Preliminary data suggest that an agent may affect conduction longitudinal to fiber orientation differently than that transverse to fiber orientation.21 (h) There are major differences in drug metabolism between subjects, which may greatly affect efficacy and toxicity of antiarrhythmic agents, particularly those with active metabolites.22 One important example of this phenomenon is fast/slow acetylator status for flecainide and propafenone. The developing field of pharmacogenomics will no doubt revolutionize our understanding of antiarrhythmic drug effects. (i) A major new focus for drug development is hoping to take advantage of antiarrhythmic effects that are specific to a particular tissue. Atrial specific Class 3 drugs in development (e.g., AZD 7009, AVE 0118) may be useful in treating atrial fibrillation by blockade of the ultrarapid delayed rectifying current (IKur), which is not present in ventricular tissue. The Vaughan Williams classification has no contingencies to take this sort of specificity into account.
(e.g., ischemic fibers) leads to inadequate, and often misleading, information. For example, ischemic fibers are composed of cells that have lower resting membrane potentials and depressed fast sodium channel activity and, in addition, demonstrate abnormal intercellular coupling.4,5 Such fibers exhibit slow conduction and postrepolarization refractoriness; that is, the refractory period extends beyond completion of repolarization. In such fibers, even Class lB agents readily produce block. (b) Drugs have complex actions. Drugs may affect multiple channels (i.e., sodium channels to depress Vmax and potassium channels to prolong repolarization), and/or may affect both the autonomic nervous system as well as ionic channels (i.e., Class lA agents all have vagolytic activity, and both amiodarone and propafenone have beta-blocking activity). Moreover, antiarrhythmic agents can depress myocardial function, resulting in altered hemodynamics and autonomic reflex activity, which in turn can affect antiarrhythmic drug action. Finally, some drugs have metabolites, which may be more active and/or have different pharmacokinetics than the parent drug, neither of which is tested in vitro (i.e., procainamide and its metabolite n-acetyl procainamide). (c) Drugs exert greater electrophysiologic effects at different rates of stimulation and after prolonged periods of stimulation (i.e., use-dependence).6,7,8,9,10 The ability to bind and dissociate rapidly from channels is highly variable. For example, Class lB drugs have rapid kinetics (i.e., rapid binding and dissociation), while lC drugs have slow kinetics. Class lA drugs are intermediate. Thus, lB agents will demonstrate minimal effects at relatively slow rates, while lC agents will demonstrate significant effects at comparable or even slower rates. In addition, cells that are partially depolarized (e.g., secondary to ischemia) are associated with much slower binding kinetics of antiarrhythmics than those at more negative membrane potentials. This is one of the causes of postrepolarization refractoriness noted in such fibers. (d) Related to use-dependence is a model proposed by Hondeghem and Katzung11,12,13 termed the “modulated receptor hypothesis.” By this hypothesis, antiarrhythmic agents interact with receptors in the membrane in either the resting, activated, or inactivated state. These interactions are voltage and time dependent and appear operative for both sodium and calcium channels. Some drugs are bound primarily in the active state (i.e., Class lA agents), while others are primarily bound in the inactive state (i.e., amiodarone),14 and some (e.g., lidocaine) are bound in both active and inactive states. Use-dependence and the modulated receptor hypothesis are interactive and may lead to totally different conclusions about the electrophysiologic effects of a given agent than if the agent was evaluated on a normal isolated Purkinje fiber at a slow rate. (e) Alterations in cellular metabolism and the intra- and extracellular ionic milieu can affect a drug’s actions. Changes in extracellular potassium, intracellular calcium, and pH can affect active membrane currents through ionic channels and may induce nonspecific ionic channels.5,15,16,17,18 In addition, increased intracellular calcium decreases intercellular coupling and impairs propagation of impulses. The inhibition of the sodium/potassium pump by digitalis and the sodium/calcium pump during ischemia may also affect the action of antiarrhythmic agents. (f) Alterations in circulating catecholamines and in autonomic tone can alter electrophysiologic drug action. Many of the effects on sodium, potassium, and calcium channels can be reversed by enhanced sympathetic tone or circulating catecholamines.19 (g) Little attention has been paid to the influence of drugs on passive membrane properties, in particular, their effects on the coupling of cells and propagation through anisotropic (particularly nonuniform anisotropic) tissues. The effects on passive membrane properties may differ among agents of the same class.20 Preliminary data suggest that an agent may affect conduction longitudinal to fiber orientation differently than that transverse to fiber orientation.21 (h) There are major differences in drug metabolism between subjects, which may greatly affect efficacy and toxicity of antiarrhythmic agents, particularly those with active metabolites.22 One important example of this phenomenon is fast/slow acetylator status for flecainide and propafenone. The developing field of pharmacogenomics will no doubt revolutionize our understanding of antiarrhythmic drug effects. (i) A major new focus for drug development is hoping to take advantage of antiarrhythmic effects that are specific to a particular tissue. Atrial specific Class 3 drugs in development (e.g., AZD 7009, AVE 0118) may be useful in treating atrial fibrillation by blockade of the ultrarapid delayed rectifying current (IKur), which is not present in ventricular tissue. The Vaughan Williams classification has no contingencies to take this sort of specificity into account.
It is clear, therefore, that the simple classification of antiarrhythmic agents that is most widely used provides insufficient information relative to electrophysiologic action in vivo and even less information relative to a drug’s actual antiarrhythmic effects. The “classic” mechanism of action of these antiarrhythmic agents is shown in Table 12-1. One must remember that these “actions,” which are based on data from single-cell microelectrode recordings, whole-cell voltage clamping, and patch clamping, simply reveal how these drugs modify ionic conductance in normal tissues. To better understand how drugs may act in humans, it is important to study the electrophysiologic effects of these agents on the human in vivo so that one might understand a drug’s action on that tissue.
Evaluation of Electrophysiologic Effects of Drugs in Humans
Using standard intracardiac recording and stimulation techniques, one can determine the effects of individual drugs on specific cardiac tissue. As noted in Chapters 2 and 3, measurements of sinoatrial conduction time and automaticity, as well as conduction and refractoriness in the atrium, A-V node, His–Purkinje system, and ventricle during sinus and paced rhythms are readily obtainable and generally reproducible. A summary of the electrophysiologic properties of various currently available and some promising experimental antiarrhythmic agents in humans is shown in Tables 12-2 and
12-3.23,24,25,26,27,28,29,30,31,32,33,34,35,36,37,38,39,40,41,42,43,44,45,46,47,48,49,50,51,52,53,54,55,56,57,58,59,60,61,62,63,64,65,66,67,68,69,70,71,72,73,74,75,76,77,78,79,80,81,82,83,84,85,86,87,88,89,90,91,92,93,94,95,96,97,98,99,100,101,102,103,104,105,106,107,108,109,110,111,112,113 Data used in Table 12-2 apply to the effects of these agents on nonischemic, normal tissues measured in sinus rhythm or during pacing from standard right atrial and right ventricular sites (see Chapter 2). Limitations of such measurements and suggestions for other parameters to be studied are discussed in subsequent paragraphs.
12-3.23,24,25,26,27,28,29,30,31,32,33,34,35,36,37,38,39,40,41,42,43,44,45,46,47,48,49,50,51,52,53,54,55,56,57,58,59,60,61,62,63,64,65,66,67,68,69,70,71,72,73,74,75,76,77,78,79,80,81,82,83,84,85,86,87,88,89,90,91,92,93,94,95,96,97,98,99,100,101,102,103,104,105,106,107,108,109,110,111,112,113 Data used in Table 12-2 apply to the effects of these agents on nonischemic, normal tissues measured in sinus rhythm or during pacing from standard right atrial and right ventricular sites (see Chapter 2). Limitations of such measurements and suggestions for other parameters to be studied are discussed in subsequent paragraphs.
TABLE 12-1 In Vitro Electrophysiologic Characteristics | |||||||||||||||||||||||||||||||||||||||||||||||||||||||||||||||||||||||||||||||||||||||||||||||||||||||||||||||||||||||||||||||||||||||||||||||||||||||||||||||||||||||||||||||||||||||||||||||||||||||||||||||||||||||||||||||||||||||||||||||||||||||||||||||||||||||||
|---|---|---|---|---|---|---|---|---|---|---|---|---|---|---|---|---|---|---|---|---|---|---|---|---|---|---|---|---|---|---|---|---|---|---|---|---|---|---|---|---|---|---|---|---|---|---|---|---|---|---|---|---|---|---|---|---|---|---|---|---|---|---|---|---|---|---|---|---|---|---|---|---|---|---|---|---|---|---|---|---|---|---|---|---|---|---|---|---|---|---|---|---|---|---|---|---|---|---|---|---|---|---|---|---|---|---|---|---|---|---|---|---|---|---|---|---|---|---|---|---|---|---|---|---|---|---|---|---|---|---|---|---|---|---|---|---|---|---|---|---|---|---|---|---|---|---|---|---|---|---|---|---|---|---|---|---|---|---|---|---|---|---|---|---|---|---|---|---|---|---|---|---|---|---|---|---|---|---|---|---|---|---|---|---|---|---|---|---|---|---|---|---|---|---|---|---|---|---|---|---|---|---|---|---|---|---|---|---|---|---|---|---|---|---|---|---|---|---|---|---|---|---|---|---|---|---|---|---|---|---|---|---|---|---|---|---|---|---|---|---|---|---|---|---|---|---|---|---|---|---|---|---|---|---|---|---|---|---|---|---|---|---|---|---|---|
| |||||||||||||||||||||||||||||||||||||||||||||||||||||||||||||||||||||||||||||||||||||||||||||||||||||||||||||||||||||||||||||||||||||||||||||||||||||||||||||||||||||||||||||||||||||||||||||||||||||||||||||||||||||||||||||||||||||||||||||||||||||||||||||||||||||||||
Besides evaluating the effect of antiarrhythmic agents on conduction (intra-atrial, A-V nodal, His–Purkinje, and intraventricular) and refractoriness, measurements of threshold of excitability and strength-interval curves114,115 should also be performed. The frequency-dependent effects of these drugs should be evaluated by assessing the effects of different drive cycle lengths on these parameters. Several investigators have demonstrated use-dependent effects in vivo using canine models as well as in humans.94,114,116,117,118,119 The effects of procainamide on cycle length–induced changes in threshold of excitability of the human atrium as well as on strength-interval curves in the human ventricle are shown in Figures 12-1 and 12-2.114,119 Propafenone caused pronounced cycle length–dependent changes in threshold of excitability in 25% of the patients studied that were associated with marked prolongation of refractoriness and clinical efficacy.120 The effects of procainamide and other agents on cycle length–dependent changes in refractoriness and/or strength-interval curves may therefore be clinically meaningful. For example, the blunting or reversal of cycle length–dependent shortening of refractoriness by an antiarrhythmic agent may signify an important electrophysiologic response that predicts clinical efficacy.7,8 The effect of agents on interval-dependent conduction delay in response to extrastimuli may also provide clinically useful data in the management of certain arrhythmias.119,121 More data are required relating efficacy and frequency or
interval-dependent effects of agents on threshold of excitability, conduction, and refractoriness.
interval-dependent effects of agents on threshold of excitability, conduction, and refractoriness.
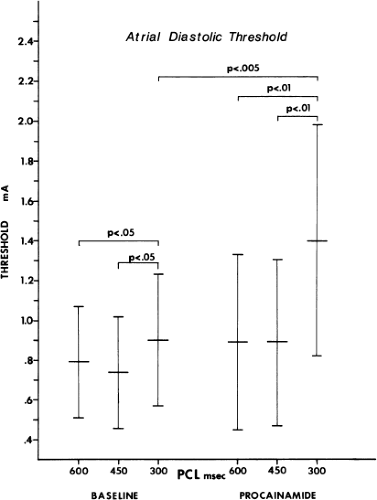 FIGURE 12-1 Effect of procainamide on threshold of excitability. The threshold of excitability is shown on the vertical axis and paced cycle length (PCL) during baseline and following procainamide infusion. During baseline there is no change in excitability as the PCL decreases from 600 to 450 msec; however, at 300 msec the threshold of excitability significantly rises. Following procainamide the threshold of excitability is slightly increased at a PCL of 600 and 450 msec compared to control, but they are not different from each other. At 300 msec there is a marked increase of the threshold of excitability, which is statistically significant from the other PCLs during procainamide infusion and at a PCL of 300 msec before procainamide. (From Buxton AE, Marchlinski FE, Miller JM, et al. The human atrial strength-interval relation. Influence of cycle length and procainamide. Circulation 1989; 79:271–280.) |
TABLE 12-2 In Vivo Electrophysiologic Characteristics of Antiarrhythmic Drugs Electrophysiologic Effects | ||||||||||||||||||||||||||||||||||||||||||||||||||||||||||||||||||||||||||||||||||||||||||||||||||||||||||||||||||||||||||||||
|---|---|---|---|---|---|---|---|---|---|---|---|---|---|---|---|---|---|---|---|---|---|---|---|---|---|---|---|---|---|---|---|---|---|---|---|---|---|---|---|---|---|---|---|---|---|---|---|---|---|---|---|---|---|---|---|---|---|---|---|---|---|---|---|---|---|---|---|---|---|---|---|---|---|---|---|---|---|---|---|---|---|---|---|---|---|---|---|---|---|---|---|---|---|---|---|---|---|---|---|---|---|---|---|---|---|---|---|---|---|---|---|---|---|---|---|---|---|---|---|---|---|---|---|---|---|---|
| ||||||||||||||||||||||||||||||||||||||||||||||||||||||||||||||||||||||||||||||||||||||||||||||||||||||||||||||||||||||||||||||
TABLE 12-3 In Vivo Electrophysiologic Characteristics of Antiarrhythmic Drugs Electrocardiographic Effects | |||||||||||||||||||||||||||||||||||||||||||||||||||||||||||||||||||||||||||||||||||||||||||||||||||||||||||||||||||||||||||||||||||||||||||
|---|---|---|---|---|---|---|---|---|---|---|---|---|---|---|---|---|---|---|---|---|---|---|---|---|---|---|---|---|---|---|---|---|---|---|---|---|---|---|---|---|---|---|---|---|---|---|---|---|---|---|---|---|---|---|---|---|---|---|---|---|---|---|---|---|---|---|---|---|---|---|---|---|---|---|---|---|---|---|---|---|---|---|---|---|---|---|---|---|---|---|---|---|---|---|---|---|---|---|---|---|---|---|---|---|---|---|---|---|---|---|---|---|---|---|---|---|---|---|---|---|---|---|---|---|---|---|---|---|---|---|---|---|---|---|---|---|---|---|---|
| |||||||||||||||||||||||||||||||||||||||||||||||||||||||||||||||||||||||||||||||||||||||||||||||||||||||||||||||||||||||||||||||||||||||||||
As noted previously, the presence of disease states can markedly influence the effect of a drug on conduction or refractoriness. An example is shown in Figure 12-3, in which lidocaine, a drug that is supposed to have no significant effect on A-V nodal or His-Purkinje conduction, produces ventricular asystole in a patient with left bundle branch block and prolonged H-V conduction. Block is produced in the A-V node, as is marked depression of conduction in the His–Purkinje system (H-V increased from 50 to 95 msec on conducted beats). Thus, the presence of abnormal A-V nodal function and His–Purkinje function (manifested by left bundle branch block) can provide a substrate in which lidocaine is able to markedly impair conduction. One must be cognizant of such potential responses when using drugs in patients with diseased conducting systems.
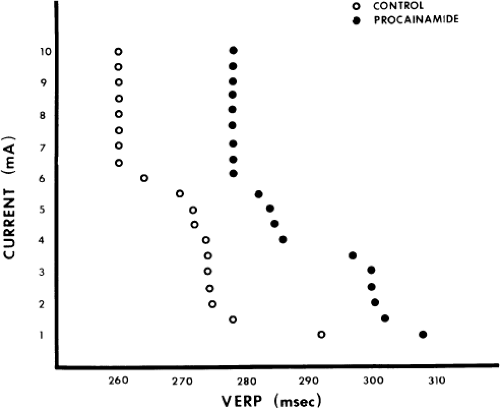 FIGURE 12-2 The effect of procainamide on strength-interval curves. The stimulation strength is shown on the vertical axis and the measured ventricular effect of refractory period (VERP) on the horizontal axis. Following procainamide the curve is shifted somewhat upward and to the right compared to the control. See text for discussion. (From Camardo JS, Greenspan AM, Horowitz LN, et al. Strength-interval relation in the human ventricle: Effect of procainamide. Am J Cardiol 1980;45:856–860.) |
In addition to the limitations of measurements and conduction and refractoriness, discussed previously here and in Chapter 2, other methodologic problems must be considered and understood by the investigator. These problems include the following:
Conduction and refractory period measurements (both of which are based on the ability to record propagated impulses) are generally reproducible (±10 msec) over a period of several hours for the atria, His–Purkinje system, and ventricles. However, they are not nearly as consistent for measurements of electrophysiologic characteristics of the sinus and A-V nodes.119 This discrepancy is due to the important autonomic influence on function of the sinus and A-V nodes that can vary from moment to moment. Such changes in autonomic tone can alter sinoatrial conduction and recovery times, A-H intervals, and A-V nodal refractory periods by as much as 20% during a single study. While there is an influence of the autonomic nervous system on the atrium, His–Purkinje system, and ventricle,67 in most cases it is not significant enough to affect the reproducibility of measurements. However, unless the patient is in a truly basal state throughout the study, the effects of drugs on the sinus and A-V nodes, in particular, must be interpreted with caution.
Refractory period measurements should be performed at comparable stimulus strengths before and after administration of an antiarrhythmic agent. Generally, refractory period measurements are performed using stimuli at twice the diastolic threshold. The current needs to be checked before and after drug administration to ensure that stimulation is carried out at comparable current strengths
relative to threshold. This also provides information about the drug’s effect on threshold of excitability, which as stated above, may be clinically relevant. In the performance of strength-interval curves, as the current used is increased from threshold to 10 mA, we have observed a decrease in the measured refractory period of 20 to 100 msec (mean ≈40 msec) in the atrium and ventricle.115 Of interest is the fact that once the absolute value of current exceeds 5 to 6 mA (using 1-msec pulse width), there is little change in the measured refractoriness; that is, the steep portion of the strength-interval curve has been reached. Thus, while most laboratories use twice diastolic threshold to measure refractoriness, strength-interval curves, or the use of 10 mA routinely may provide more reliable information since the steep portion of the strength-interval curve appears to always be reached by 10 mA. Whether use of this measurement has clinical significance is uncertain; it would, however, ensure that local tissue refractoriness is not the limiting factor in induction of arrhythmias. This has to be weighed against the induction of atrial or ventricular
fibrillation using these current strengths. However, it is important that investigators use comparable current strengths before and after an antiarrhythmic agent.
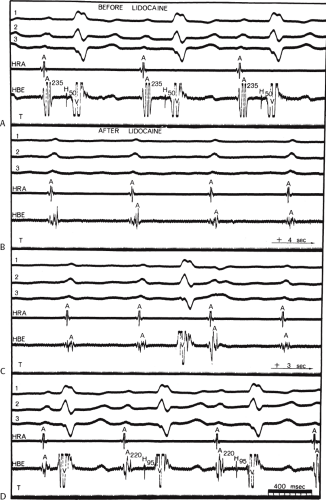
FIGURE 12-3 Effect of lidocaine on abnormal tissue. A to D: Top to bottom, leads 1, 2, 3, high right atrial (HRA), His bundle electrogram (HBE), and time lines (T). Before lidocaine administration, left bundle branch block with prolonged (A-V) conduction is observed. The A-H interval is 235 msec and H-V is 50 msec. Following lidocaine complete A-V block is produced with failure of conduction localized to the A-V node. Conduction resumes in 3 seconds, at which time the H-V is markedly increased to 95 msec. See text for discussion.
Assessment of refractory periods of the A-V node or His–Purkinje system is impossible if the functional and/or effective refractory period of the atrium exceeds the refractory period of these subatrial structures. Similarly, if the functional refractory period of the A-V node exceeds the relative and effective refractory period of the His–Purkinje system, the latter measurement cannot be determined. Difficulties may be encountered during the control study, or they may be produced following antiarrhythmic drug administration. Therefore, it may not be possible to determine the effect of a drug on A-V nodal or His–Purkinje refractoriness if atrial refractoriness is prolonged beyond the A-V nodal refractory period.
The effect of an antiarrhythmic agent administered intravenously may not be the same as the effect of a drug given orally, even when blood levels are comparable. This is particularly true of an antiarrhythmic drug’s effect on sinus and A-V nodal function, especially if the drug has effects that are mediated via the autonomic nervous system. Moreover, if the diluent in which the drug is prepared has vasodilatory properties, or if the drug itself induces alterations in systemic blood pressure, this may result in enhanced sympathetic tone, producing a different electrophysiologic effect than when the drug is administered orally. This was shown by Klein et al.91 to be particularly important in assessing the effect of verapamil on the anterograde refractoriness of an A-V bypass tract. Whereas intravenous verapamil produces hypotension, and secondarily enhances sympathetic tone producing a decrease in the refractory period of the bypass tract, oral administration of that agent does not significantly affect the refractory period of the bypass tract.91 Moreover, hypotension may limit the amount of a drug that can be administered intravenously; in such cases, higher doses of these agents can be given orally, resulting in higher plasma levels and greater electrophysiologic effects. In our experience, electrophysiologic effects of intravenously administered Group lA drugs (procainamide and quinidine) are similar to the effects ascertained following oral administration.41 This is remarkable, particularly for procainamide, since its major metabolite, n-acetyl procainamide, has electrophysiologic effects. Nonetheless, we have demonstrated that the clinical efficacy of these agents can be predicted if administered acutely, as long as hypotension and myocardial depression do not take place. In view of the fact that the rate of administration can markedly influence the hemodynamic response, we recommend that Class 3 studies always be determined on chronic oral doses of various agents. This observation suggests limited clinical antiarrhythmic efficacy of n-acetyl procainamide.
A single dose of a given agent may be inadequate to assess its range of effects; therefore, multiple incremental doses should be evaluated, particularly if no effects are noted initially. For example, minimal effects on His–Purkinje function may be noted in response to Group lA drugs at one plasma level, whereas at a slightly higher level, marked and potentially dangerous depression of conduction can be observed. This is especially true if the use-dependent effects of the antiarrhythmic agents are assessed.117 Thus, the electrophysiologic properties of antiarrhythmic agents should be evaluated with respect to the potential doses and plasma levels that might be used clinically. One should not neglect the use-dependent effects of antiarrhythmic agents at any dose. This is important in assessing their clinical efficacy and toxicity since these agents are usually used to treat tachyarrhythmias; thus, the effect of a single dose of an agent at baseline heart rate may not yield information relative to its action during a tachycardia. We routinely use exercise testing to assess the effect of heart rate on use-dependent effect of Class 1C agents. Prolongation of the QRS during exercise testing predicts QRS widening during tachycardias.122
The electrophysiologic effects of antiarrhythmic agents may differ if administered during acute ischemic states rather than if measured during stable conditions. There are only limited data available on the effects of antiarrhythmic agents during acute infarction or ischemia, but as noted previously, ischemia-associated depression of sodium channels can markedly influence the potency of various antiarrhythmic agents on conduction and refractoriness.5 Similarly, the effects of antiarrhythmic drugs may be different in patients with and without conduction disturbances, and progression of conduction defects may be noted in response to individual agents. This was shown earlier in a case of lidocaine-induced heart block. Thus, apparent conduction defects can be aggravated, and latent defects can be unmasked in the presence of a specific antiarrhythmic agent. As noted in Chapter 4, this phenomenon may provide a pharmacologic “stress test” for the A-V conduction system in patients with prior conduction defects.
Electrophysiologic effects of antiarrhythmic agents on the atrium and ventricle are generally determined at sites of stimulation in the high right atrium and right ventricular apex. These are frequently normal sites and not the sites of arrhythmogenesis. It would be more important to assess the effects of drugs on the arrhythmogenic tissue than on normal tissue. Little data of the effect of drugs on arrhythmogenic substrates are available. We have analyzed the effects of lidocaine and procainamide on arrhythmogenic ventricular tissue, that is, tissue manifesting abnormal fractionated electrical activity (see Chapters 2 and 11). These areas of fractionated electrical activity in the left ventricle occur as a result of infarction, which leads to separation of viable muscle fibers by scar tissue. We have shown that these are areas from which ventricular tachycardias (VTs) arise. We have studied the effect of lidocaine and procainamide on these fractionated and abnormal electrograms and compared their effects to that on normal electrograms from the right ventricle (Tables 12-4 to 12-6).123 These studies reveal lidocaine had little effect on electrogram duration from both normal and
abnormal sites during sinus rhythm or ventricular pacing at 600 msec (Fig. 12-4). On the other hand, procainamide had a similar effect on the duration of normal and abnormal electrograms (Fig. 12-5). These findings suggest that the tissue from which the electrograms arise is composed of nearly normal ventricular myocytes. If the arrhythmogenic myocardium was composed of fibers exhibiting depressed sodium channels or slow response fibers, lidocaine would have affected them markedly, and procainamide would have not affected them had they been associated with calcium-mediated slow responses. In fact, in a few patients we have been able to study the effect of verapamil on such abnormal electrograms and, indeed, no effect of the drug on fragmented electrograms was noted (Fig. 12-6). Of note, the QRS duration in sinus rhythm and during ventricular pacing increased following procainamide but not following lidocaine (Tables 12-4 and 12-5). All of these observations support the belief that the arrhythmogenic substrate is in fact composed of normally polarized fibers, but the fractionated electrograms are due to saltatory conduction produced by poor coupling of cells and nonuniform anisotropy. While Kadish et al.21 have suggested that procainamide may affect conduction parallel to longitudinal orientation slightly more than conduction transverse to fiber orientation tissues in relatively uniform anisotropic canine tissue at paced rates of 1,000 to 400 msec, no data are available concerning the directional effects of propagation in nonuniform anisotropic tissue. A study from our laboratory124 demonstrated that procainamide had a greater effect on conduction through the abnormal arrhythmogenic substrate than a normal tissue at fast paced rates, that is, cycle lengths of 300 msec (Figs. 12-7 and 12-8). While pacing at 600 and 400 msec showed no significant change in electrogram duration in normal and abnormal sites, when the paced cycle length was reduced to 300 msec, a significant increase in electrogram duration at abnormal sites was noted following procainamide. While there was a small increase in electrogram duration at normal sites produced by procainamide at all cycle lengths, which was comparable to the increase in electrogram duration in abnormal sites
at 600 and 400 msec, at paced cycle lengths of 300 msec, the increase in electrogram duration was significantly greater in abnormal sites (Fig. 12-7). Occasionally, loss of a component of an electrogram could be noted and, in some instances, progressive prolongation of the electrogram led to initiation of VT (see Chapter 11). These findings suggest that in arrhythmogenic ventricular tissue procainamide produces a cycle length–dependent effect on saltatory conduction that is beyond its use-dependent effects. More research is mandatory to study the effects of antiarrhythmic agents on arrhythmogenic tissue. It is only through such studies that one may begin to understand the antiarrhythmic effects of antiarrhythmic agents. This last point is one of the major limitations in evaluating antiarrhythmic efficacy and mechanism. To summarize, drug effects are not generally measured at the arrhythmogenic site. Thus, extrapolation of measurements from either the right atrium or right ventricle to arrhythmogenic sites in either the atria or left ventricle is not necessarily valid; that is, tissue other than at sites of atrial and right ventricular stimulation (e.g., left atrium and left ventricle) may differ in active and passive electrophysiologic properties. Further discussion on evaluation of antiarrhythmic drug action will be discussed later in this chapter.
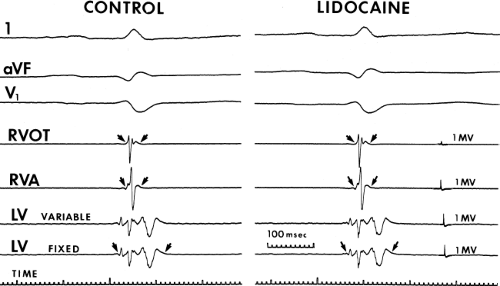 FIGURE 12-4 Effect of lidocaine on normal and fragmented electrograms. Leads 1, aVF, and V1 are shown with electrograms from the right ventricular outflow tract (RVOT), right ventricular apex (RVA), and the left ventricle (LV) at variable and fixed gains. Time lines and calibration signals are shown. The small arrows denote the sites of measurement of electrograms. Note that the normal electrograms from the RV and markedly abnormal electrogram from the LV are unaffected by lidocaine. See text for discussion. (From Schmitt CG, Kadish AH, Marchlinski FE, et al. Effects of lidocaine and procainamide on normal and abnormal intraventricular electrograms during sinus rhythm. Circulation 1988;77:1030–1037.) |
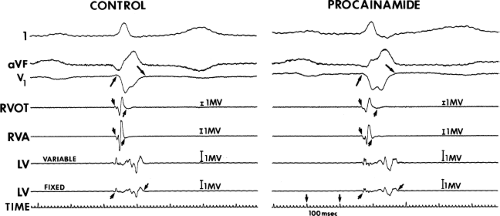 FIGURE 12-5 Effect of procainamide on normal and abnormal electrograms. This tracing is organized the same as Figure 12-4. The small arrows denote width of electrogram. Following procainamide, the QRS width, electrograms from the RV, and LV all prolong. A relatively similar increase of normal and abnormal electrograms in response to procainamide suggests that the fibers responsible for their generation are not associated with slow potentials. See text for discussion. (From Schmitt CG, Kadish AH, Marchlinski FE, et al. Effects of lidocaine and procainamide on normal and abnormal intraventricular electrograms during sinus rhythm. Circulation 1988;77:1030–1037.) |
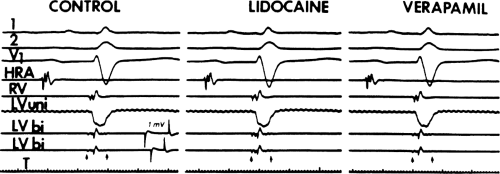 FIGURE 12-6 Comparison of lidocaine and verapamil on abnormal electrograms. Leads 1, 2, and V1 are shown with electrograms from the HRA, RV, and unipolar and two bipolar electrograms from an abnormal LV site. The small arrows denote the width of the abnormal electrogram. Following lidocaine and verapamil, there is no significant change in electrogram configuration or duration. See text for discussion. |
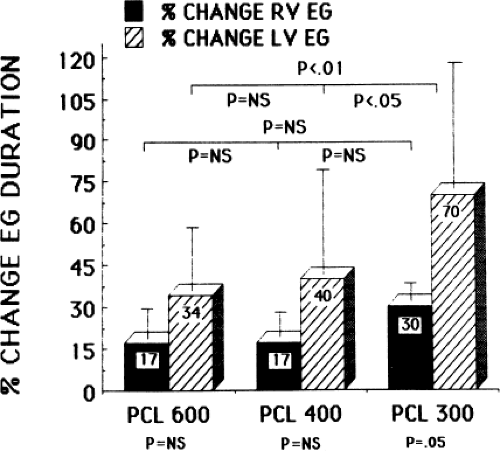 FIGURE 12-7 Effect of procainamide on electrogram duration at various paced cycle lengths. The percentage (%) of change in electrogram (EG) duration is shown on the vertical axis, and the paced cycle lengths (PCL) at which electrogram durations were measured are shown on the horizontal axis. Following procainamide, there is a significant increase in both normal and abnormal electrograms at a PCL of 300 msec. While the difference in effect on normal and abnormal electrograms at a PCL of 600 and 400 msec is not significantly different, the marked increase in electrogram duration at abnormal sites following procainamide at a PCL of 300 msec is significantly different from abnormal electrograms at other PCLs. See text for discussion. (From Schmitt C, Kadish AH, Balke WC, et al. Cycle length–dependent effects on normal and abnormal intraventricular electrograms: effect of procainamide. J Am Coll Cardiol 1988;12:395–403.) |
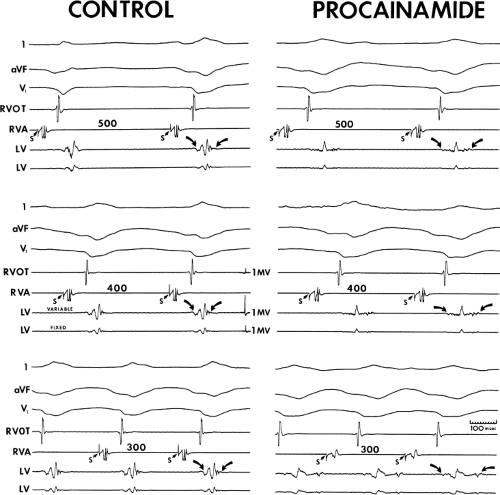 FIGURE 12-8 Effect of procainamide on fractionated electrograms. This tracing is set up similarly to Figure 12-5. Curved arrows denote width of LV electrogram. Pacing from the RVA at cycle lengths of 500, 400, and 300 msec is shown before and after procainamide. In the control state no significant change in the fractionated electrogram is shown at each paced cycle length. Similarly, in a qualitative sense, there is no change in the electrogram from the RVOT. Following procainamide, although there is a minimal change in duration of the RVOT electrogram, the electrogram from the LV becomes markedly splintered and at a paced cycle length of 300 msec is split. See text for discussion. (From Schmitt C, Kadish AH, Balke WC, et al. Cycle length-dependent effects on normal and abnormal intraventricular electrograms: effect of procainamide. J Am Coll Cardiol 1988;12:395–403.) |
TABLE 12-4 Effects of Lidocaine on QRS Width and Electrogram Duration (msec) | |||||||||||||||||||||||||||||||||||||||||||||
|---|---|---|---|---|---|---|---|---|---|---|---|---|---|---|---|---|---|---|---|---|---|---|---|---|---|---|---|---|---|---|---|---|---|---|---|---|---|---|---|---|---|---|---|---|---|
| |||||||||||||||||||||||||||||||||||||||||||||
TABLE 12-5 Effects of Procainamide on QRS Width and Electrogram Duration (msec) | ||||||||||||||||||||||||||||||||||||||||||||||||||||||||||||||||||||||||||||||||||||||||||||||||||
|---|---|---|---|---|---|---|---|---|---|---|---|---|---|---|---|---|---|---|---|---|---|---|---|---|---|---|---|---|---|---|---|---|---|---|---|---|---|---|---|---|---|---|---|---|---|---|---|---|---|---|---|---|---|---|---|---|---|---|---|---|---|---|---|---|---|---|---|---|---|---|---|---|---|---|---|---|---|---|---|---|---|---|---|---|---|---|---|---|---|---|---|---|---|---|---|---|---|---|
| ||||||||||||||||||||||||||||||||||||||||||||||||||||||||||||||||||||||||||||||||||||||||||||||||||
TABLE 12-6 Amplitude (in mV) | |||||||||||||||||||||||||||||||||||||||||||||||||||||||||||||||||||||
|---|---|---|---|---|---|---|---|---|---|---|---|---|---|---|---|---|---|---|---|---|---|---|---|---|---|---|---|---|---|---|---|---|---|---|---|---|---|---|---|---|---|---|---|---|---|---|---|---|---|---|---|---|---|---|---|---|---|---|---|---|---|---|---|---|---|---|---|---|---|
| |||||||||||||||||||||||||||||||||||||||||||||||||||||||||||||||||||||
Limitations of studying the electrophysiologic properties of antiarrhythmic agents in humans are summarized in Table 12-7.
TABLE 12-7 Limitations in Evaluating Antiarrhythmic Drug Action | |
|---|---|
|
Selection of Antiarrhythmic Drug Therapy for Reentrant Tachycardias
Use of Programmed Stimulation
The ability to reproducibly initiate a tachycardia provides an objective method by which the efficacy of an antiarrhythmic agent in preventing the arrhythmia can be tested. The use of electrophysiologic testing to analyze the effects of different drugs, singly or in combination, can provide a relatively rapid and rational method of selecting drug therapy.125,126,127,128,129,130,131,132,133,134,135,136,137,138,139,140,141,142,143 Support for this method has evolved because of the realization that patients with the same arrhythmia can respond quite differently to antiarrhythmic agents of the same group. Such an approach can save substantial time involved in empiric “trial and error therapy,” the efficacy of which must be based on the frequency of symptoms, the ability of ambulatory monitoring to record such events, and in the case of malignant ventricular arrhythmias, sudden death. The paroxysmal nature of most reentrant arrhythmias makes the use of Holter monitoring less reliable as an indicator of effective therapy. The limitations of Holter monitoring for the management of such arrhythmias are (a) the infrequent nature of spontaneous ectopy, (b) the spontaneous variability of such activity, and (c) the inability of suppression of ambient ectopy to predict prevention of the sustained arrhythmias for which the therapy is given. This is particularly true in the case of ventricular
arrhythmias (Fig. 12-9). The ease of placement and safety of insertable cardiac monitors have helped to overcome some of these limitations.
arrhythmias (Fig. 12-9). The ease of placement and safety of insertable cardiac monitors have helped to overcome some of these limitations.
The use of an electrophysiologic protocol for drug selection is based on two assumptions: (a) The tachycardia initiated in the laboratory by programmed stimulation is identical to that occurring spontaneously, and (b) the response of antiarrhythmic agents in the laboratory predicts the clinical response. Both of these assumptions appear well established in the case of paroxysmal supraventricular tachycardias and sustained uniform VT (as long as a 12-lead electrogram during the spontaneous episode is available to compare to the induced arrhythmia). While it is rarely possible to record the rhythm initiating cardiac arrest, as has been discussed in detail in Chapter 11, most episodes appear to be initiated by either a uniform VT, which produces hemodynamic collapse or degenerates into ventricular fibrillation, or a rapidly accelerating VT, uniform or polymorphic, degenerating into ventricular fibrillation after a variable amount of time. Our experience and that of many institutions have supported the clinical utility of programmed stimulation for developing drug therapy for these arrhythmias.130,131,132,133,134,135,136,137,138,139,140,141,142,143 While pharmacologic therapy has assumed a secondary role for the treatment of malignant ventricular arrhythmias because of the demonstrated superiority of ICDs in preventing sudden death, pharmacologic therapy is still required to (a) prevent recurrences resulting in multiple ICD discharges and (b) slow the VT cycle length to facilitate antitachycardia pace termination (see Chapter 13).
Grayboys et al.144 suggested that noninvasive methods (Holter monitoring and exercise testing) yield a similar outcome to programmed stimulation. Several small studies suggested that programmed stimulation more accurately predicts success of pharmacologic therapy than Holter monitoring in the case of sustained ventricular tachyarrhythmias.139,145,146 The electrophysiologic versus electrocardiographic monitoring (EVSEM) trial was a prospective multicenter trial that compared the outcome of patients in whom antiarrhythmic therapy with Class 1 agents or sotalol was guided by serial electrophysiologic study with the outcome of patients in whom therapy was guided by ambulatory ECG monitoring. The 486 patients in this trial had documented sustained ventricular arrhythmias (85%) or resuscitated sudden death that were inducible during electrophysiologic study (EPS) and had significant, measurable ectopy (>10 PVCs/hr) on Holter monitoring. Two-thirds had failed “standard” Class 1 agents. The patients were randomized to electrophysiologic testing or Holter monitoring to predict drug efficacy and received up to six drugs in random order until one was predicted to be effective.147,148
This trial showed that Holter monitoring and electrophysiologic testing had similar accuracy in predicting antiarrhythmic drug efficacy.147,148,149 Drug efficacy, predicted by Holter or electrophysiologic testing, was associated with improved mortality.150 Sotalol was shown to have greater efficacy and lower cost when compared to Class 1 agents, but the patient population was biased against Class 1 agents.147,148,151,152 The study had many flaws which were never addressed. Sotalol had to be tolerated in high enough doses to be effective which preselects patients without CHF and/or significantly reduce ejection fraction. Two-thirds of patients had previously failed Class 1 agents, an observation which selects patients likely to fail other Class 1 agents. The stimulation protocol was inadequate in both number of extrastimuli and sites of stimulation. Finally, I believe the incidence of such patients with frequent enough ectopy on Holter monitoring to allow evaluation of drug suppression was significantly exaggerated. In my experience less than 15% of our patients with sustained VT of VF have such frequent ectopy.
A trial conducted by Steinbeck et al.153,154 prospectively looked at beta-blocker monotherapy compared to EPS-guided antiarrhythmic drug therapy plus beta-blocker therapy in 170 patients. The patient population included those with sustained VT, resuscitated sudden death, or syncope presumed to be due to VT. All patients underwent EPS. Those who were noninducible received metoprolol. Those who were inducible were randomized to receive metoprolol or serial EPS-guided antiarrhythmic drug therapy with propafenone, flecainide, disopyramide, sotalol, or amiodarone. Drugs were assigned randomly, but amiodarone was used last. All patients received metoprolol as well except those who were taking amiodarone or sotalol. Surprisingly, the left ventricular ejection fraction was >40% in the average patient enrolled in this study.
Using a combined endpoint of symptomatic arrhythmia recurrence or arrhythmic death, outcome was better in those who at baseline were noninducible when compared to those who were inducible. There was no significant difference
between the two groups who were inducible and received beta blockers or beta blockers and antiarrhythmic medication. However, when stratified on the basis of the results of EP testing, those who were inducible but suppressed by antiarrhythmic therapy fared best even when compared to those who were noninducible at outset.154 Outcome was not stratified by drugs in this study, but others showed, as was the case with Class 1 agents in the ESVEM trial, that EPS-guided suppression of arrhythmia by amiodarone administration confers a favorable prognosis.155
between the two groups who were inducible and received beta blockers or beta blockers and antiarrhythmic medication. However, when stratified on the basis of the results of EP testing, those who were inducible but suppressed by antiarrhythmic therapy fared best even when compared to those who were noninducible at outset.154 Outcome was not stratified by drugs in this study, but others showed, as was the case with Class 1 agents in the ESVEM trial, that EPS-guided suppression of arrhythmia by amiodarone administration confers a favorable prognosis.155
High-risk survivors of cardiac arrest were evaluated in the CASADE study.156 Empiric therapy with amiodarone was compared to EPS-guided therapy with antiarrhythmic agents (generally Class 1 agents) in patients resuscitated from out-of-hospital sudden death with poor LV function. Those who were inducible at EPS had antiarrhythmic therapy guided by serial study. At 6 years, survival free of cardiac death and sustained VT was higher in those taking amiodarone compared to those on Class 1 agents (41% vs. 21%; p <0.001). When amiodarone-treated patients were compared to those whose arrhythmias were suppressed on Class 1 agents at 2 years, there was a trend toward superiority with amiodarone (83% vs. 60%; p <0.09). Again, it should be recognized that in this population with coronary disease and prior infarction, beta-blocker use was extremely low (5% to 6%), particularly in those treated with Class 1 agents, and may have modified the findings. This trial was the first to suggest greater efficacy of amiodarone, but did not address the utility of programmed stimulation.
When interpreting data presented in the preceding paragraphs, it is critical to recognize the differing baseline risk of arrhythmic death within the heterogeneous populations enrolled in these trials when comparing results within and between these studies. For instance, people who are noninducible at EPS or have normal left ventricular ejection fractions have better survival when compared to those with impaired left ventricular function and who remain inducible despite serial drug testing. In addition, drug failure end points should be different in patients with sustained uniform, tolerated VT, and those with cardiac arrest. Sudden death should be an end point for patients presenting with cardiac arrest, but it should not be used for someone who presents with sustained, tolerated uniform VT, since sudden death is uncommon in these patients. In such patients, recurrent sustained VT is the appropriate end point. Finally patients with different disease substrates (e.g., coronary artery disease with prior infarction, dilated or hypertrophic cardiomyopathy, or no overt organic heart disease) behave differently to programmed stimulation (see Chapter 11) and antiarrhythmic agents.
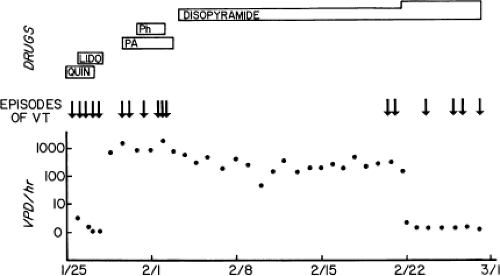 FIGURE 12-9 A lack of correlation of spontaneous ectopy with recurrences of ventricular tachycardia (VT). The number of ventricular premature depolarizations (VPD) per hour is shown on the vertical axis in a logarithmic scale, and the dates over which recordings were made are shown on the horizontal axis. Episodes of spontaneous sustained VT are shown with the inverted vertical arrows. The timing of administration of various antiarrhythmic agents is shown in rectangular boxes. An increase in the box width represents an increase in the dose. Note that recurrent episodes of sustained VT occur following all antiarrhythmic agents and there is no relationship to the presence or absence of spontaneous ectopy. (From Horowitz LN, Josephson ME, Kastor JA. Intracardiac electrophysiologic studies as a method for the optimization of drug therapy in chronic ventricular arrhythmia. Prog Cardiovasc Dis 1980;23:81–98.) |
The use of electrophysiologic testing to guide pharmacologic therapy for nonsustained ventricular arrhythmias is controversial. Prior studies suggested that EPS-guided therapy was superior to other forms of therapy for the management of nonsustained VT associated with coronary artery disease in whom the left ventricular ejection fraction is <40% and in whom sustained uniform VT is inducible.157,158,159,160 One study161 did not find electrophysiologic testing of value in patients with prior myocardial infarction and nonsustained VT; however, a high-risk subgroup was not identified and used as a selected target for such therapy. Recently, the multicenter unsustained tachycardia trial (MUSTT) showed that electrophysiologically guided antiarrhythmic therapy with implantable defibrillators, but not with antiarrhythmic drugs, reduced the risk of sudden death in high-risk patients with coronary disease, asymptomatic unsustained VT, and left ventricular ejection fraction <40%.162
It is unclear whether or not the use of programmed stimulation is useful in patients with nonsustained VT in patients without coronary artery disease (i.e., cardiomyopathy). Buxton et al.160 did not find programmed stimulation useful in identifying a high-risk subgroup of patients with cardiomyopathy and nonsustained VT, and therefore, we do not believe that the technique can or should be used to effectively assess therapy in such patients.
Other investigators163,164 have suggested the use of signal-averaged electrocardiography to identify the high-risk subgroup of patients with coronary artery disease and low ejection fractions in whom nonsustained VT should be treated by programmed stimulation.163,164,165,166,167 We, however, have not found the signal-averaged electrocardiogram to be of independent value in selecting patients with prior infarction and nonsustained VT who are at high risk for developing sustained VT or sudden cardiac death.168 At least for sustained ventricular arrhythmias, the electrophysiologic approach appears to be cost effective.169
Stay updated, free articles. Join our Telegram channel

Full access? Get Clinical Tree


