The geometries and sizes of persistent iatrogenic atrial septal defects (IASDs) after transseptal puncture during catheter-based mitral valve clip insertion (MVCI) have not been detailed. In this study, 11 IASDs were investigated in 10 patients who underwent MVCI using a guide catheter (24Fr proximally and 22Fr at the atrial septum). The diameters of the long and short axes and the area at maximum and minimum during a cardiac cycle were measured after MVCI using real-time 3-dimensional (RT3D) transesophageal echocardiography (TEE). A circular shape was assumed on 2-dimensional TEE, resulting in an area calculation of π × (dimension/2) 2 . The anatomic geometries of IASDs were visualized in a 3-dimensional en face view of the atrial septum. Furthermore, 1 month after MVCI, IASDs were evaluated using echocardiography. The IASDs had a variety of irregular geometries. The mean long-axis diameter was 1.0 ± 0.24 cm, the mean short-axis diameter was 0.51 ± 0.22 cm, and the mean area was 0.40 ± 0.24 cm 2 on RT3D TEE. The diameters and area changed significantly between the maximal and minimal values during the cardiac cycle. Importantly, 2-dimensional TEE underestimated the maximal diameters of IASDs (0.54 ± 0.17 vs 1.0 ± 0.24 cm by RT3D TEE, p <0.01) and the maximal areas of IASDs (0.25 ± 0.15 vs 0.40 ± 0.23 cm 2 by RT3D TEE, p <0.05). One month after MVCI, the smallest and the second smallest IASDs had closed, and the other 9 remained open. In conclusion, RT3D TEE is useful to assess the irregular geometries of IASDs created during MVCI.
Catheter-based mitral valve clip insertion (MVCI) has recently evolved into a therapeutic alternative for patients with significant mitral regurgitation. MVCI requires the puncture of the atrial septum to deliver the mitral clip, resulting in an iatrogenic atrial septal defect (IASD). In previous studies, IASDs have been investigated using 2-dimensional (2D) echocardiographic methods in patients with pulmonary vein isolation and closure of the left atrial appendage. However, IASDs have not been evaluated using real-time 3-dimensional (RT3D) transesophageal echocardiography (TEE). Besides, these 2D data were obtained from patients after transseptal puncture using 8Fr to 14Fr catheters. In contrast, the catheter used in MVCI possesses a larger cross-sectional area of 22Fr at the atrial septum. The true morphology of an IASD should be clarified to assess persistent shunting and paradoxical embolism. The aims of this study were to elucidate the true morphology of IASDs after MVCI using RT3D TEE and to compare morphology between 2D transthoracic echocardiography and RT3D TEE.
Methods
The study included 11 IASDs in 10 patients with mitral regurgitation treated with the MitraClip device (Abbott Laboratories, Abbott Park, Illinois). All patients had moderate to severe (3+) or severe (4+) functional or degenerative mitral regurgitation with symptoms or, if asymptomatic, with compromised left ventricular function (ejection fraction <60% or end-systolic dimension >40 mm). The MitraClip system uses a triaxial catheter system with an implantable clip in MVCI. The guide catheter is 22Fr at the atrial septum and is delivered with a tapered dilator. The procedure is performed with the patient under general anesthesia using transesophageal echocardiographic guidance. After transseptal puncture, the transseptal sheath is exchanged for the steerable guide catheter and dilator. Using echocardiographic and fluoroscopic guidance, the clip is steered until axially aligned and centered over the origin of the regurgitant jet. The clip is advanced into the left ventricle below the mitral leaflets and retracted until both leaflets are grasped and then closed to coaptation between the mitral leaflets.
Two-dimensional transthoracic echocardiography was performed using the iE33 ultrasound system (Phillips Medical Systems, Andover, Massachusetts) equipped with an S5-1 phased-array (5 to 1 MHz broadband) transducer (Phillips Medical Systems) when 2D transthoracic echocardiographic standard views were obtained.
All patients underwent 2D TEE in MVCI using the iE33 ultrasound system equipped with a 3-dimensional matrix-array transesophageal transducer (X7-2t; Philips Medical Systems). The maximal diameters of IASDs were measured from the midesophageal position during a cardiac cycle. The maximal and minimal IASD areas were also calculated as a circular profile (π × [dimension/2] 2 ).
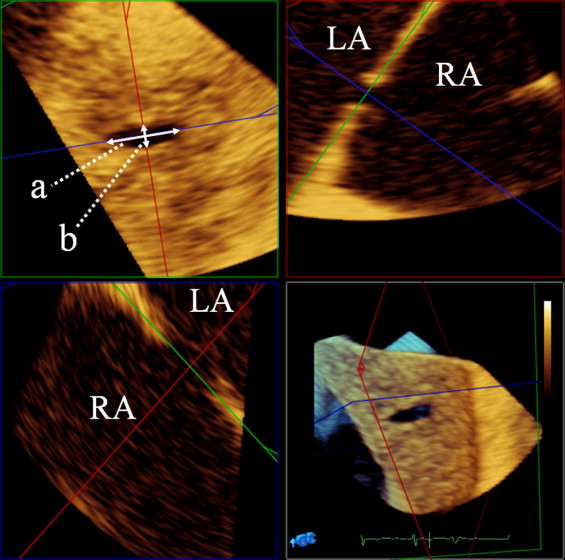
After the evaluation of 2D TEE, RT3D TEE was performed using the same devices. From the midesophageal position, images of IASDs were acquired in zoomed Live 3D mode. All images were analyzed off-line using 3D-QLAB (Philips Medical Systems). The cardiovascular mode was used for correct alignment and measurement. Two specific frames of the largest and smallest dimensions and areas of IASDs during the cardiac cycle were defined from a series of frames ( Figure 1 ) . The percentage changes in the dimensions and area during the cardiac cycle were then calculated as percentage change during the cardiac cycle = [(largest measurement − smallest measurement)/largest measurement] × 100%. Moreover, schemes of IASDs were depicted to compare to the cross-sectional area of the catheter. Additionally, patients were scheduled for 2D transthoracic echocardiography to observe IASDs 1 month after the procedure, and all adverse events, including full neurologic and embolic events, were reviewed.
Continuous data are expressed as mean ± SD and categorical data as numbers and percentages. Two-sided paired Student’s t tests were used to compare 2 continuous variables. One-way analysis of variance followed by Scheffé’s multiple comparison test was used to determine the difference among diameters on 2D TEE and short long axes on RT3D TEE. Two-tailed p values <0.05 were considered significant. All statistical analyses were performed using commercial statistical software (GraphPad Prism version 5.01; GraphPad Software, Inc., La Jolla, California). The study was approved by the ethics committee of the institution.
Results
The study included 11 IASDs in 10 patients (5 [50%] men), including patients with degenerative or combined degenerative and functional disease (n = 7 [70%]) and patients with functional mitral regurgitation (n = 3 [30%]) ( Table 1 ). The mean age was 69 ± 15 years (range 39 to 90). One patient needed 2 punctures in the atrial septum to obtain optimal positioning of the mitral valve clip. Mitral regurgitation grade decreased from 3.7 ± 0.48 to 1.3 ± 0.48, and mitral regurgitation was reduced to ≤2+ after MVCI in all patients. The velocity of tricuspid valve regurgitation decreased 1 month after MVCI in all patients.
| Case | Age (Years)/Gender | Reason for Mitral Regurgitation | IASD Number in Figure 2 | LVDd (mm) | LAD (mm) | EF (%) | Mitral Regurgitation Grade (Pre/Post) | Peak Tricuspid Regurgitation (cm/s) (Pre/Post) |
|---|---|---|---|---|---|---|---|---|
| 1 | 39/F | Functional | 11 | 52 | 37 | 20 | 4+/1+ | 295/243 |
| 2 | 56/M | Degenerative | 2 | 70 | 58 | 39 | 4+/2+ | 289/246 |
| 3 | 61/M | Degenerative | 4, 6 | 50 | 42 | 65 | 4+/1+ | 243/216 |
| 4 | 65/F | Degenerative | 1 | 49 | 43 | 60 | 4+/1+ | 344/285 |
| 5 | 67/F | Degenerative | 8 | 53 | 73 | 72 | 3+/1+ | 269/263 |
| 6 | 70/M | Degenerative | 9 | 55 | 48 | 62 | 4+/1+ | 363/308 |
| 7 | 74/F | Functional | 3 | 70 | 55 | 35 | 4+/2+ | 322/278 |
| 8 | 84/M | Degenerative | 10 | 59 | 40 | 42 | 4+/2+ | 338/287 |
| 9 | 86/F | Degenerative | 7 | 40 | 55 | 60 | 3+/1+ | 297/217 |
| 10 | 90/M | Functional | 5 | 52 | 58 | 55 | 3+/1+ | 316/175 |
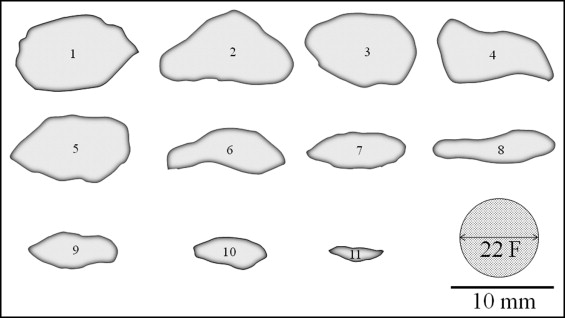
The shapes of IASDs were not specific but included a variety of irregular geometries ( Figure 2 ) . The long-axis diameters at the maximum and minimum were 1.0 ± 0.24 and 0.69 ± 0.35 cm, the short-axis diameters were 0.51 ± 0.22 and 0.28 ± 0.16 cm, and the areas were 0.40 ± 0.24 and 0.19 ± 0.16 cm 2 , respectively, on RT3D TEE ( Figure 3 ) . The percentage change of the long-axis diameter was 34 ± 27%, that of the short-axis diameter was 43 ± 25%, and that of the area was 56 ± 23%. The maximum area was obtained at late systole to early diastole in all but 2 cases, and the minimum area was obtained at late diastole.