Duplex Scanning in the Evaluation of Renal Arterial Occlusive Disease


Duplex Scanning in the Evaluation of Renal Arterial Occlusive Disease


R. Eugene Zierler


Duplex ultrasound scanning was developed in the 1970s as a direct noninvasive method for evaluating the extracranial carotid arteries. Subsequent advances in ultrasound technology, particularly the improved B-mode imaging systems, color-flow Doppler imaging, and lower-frequency ultrasound transducers, have extended the applications of duplex scanning to the more complex and deeply located vessels of the abdomen including the renal vasculature. Duplex scanning is currently the only noninvasive laboratory method available for evaluating the renal arteries.


Scanning Technique


The general principles of renal duplex scanning are identical to those for other arterial sites. After a renal artery is visualized using B-mode and color flow imaging, the pulsed Doppler sample volume is placed within the vessel. Spectral waveform analysis is then used to characterize the blood-flow pattern and classify the severity of disease. A localized flow disturbance with a high-velocity jet indicates the presence of a high-grade stenosis.


The challenge in renal artery scanning is to locate the vessels and obtain satisfactory pulsed Doppler information. Renal arteries are especially difficult to examine because of their small size, deep location, and variable anatomy. The effects of respiratory motion and overlying bowel gas can also limit the success of renal duplex scanning.


Whenever possible, patients should be examined after an overnight fast to minimize problems with abdominal gas. Low-frequency phased array or curved linear ultrasound transducers (2.25–3.0 MHz) are required for adequate depth penetration. Color-flow imaging is extremely helpful when performing abdominal vascular evaluations to help define anatomic relationships and identify blood vessels.


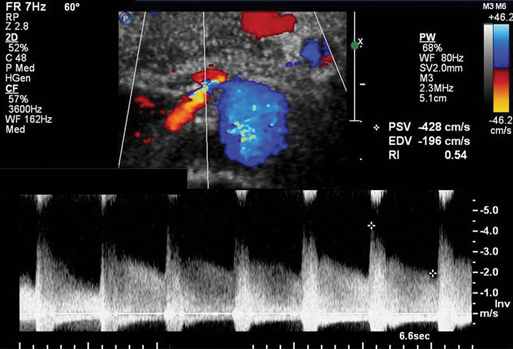
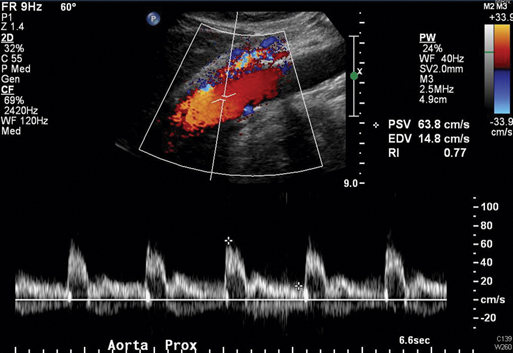
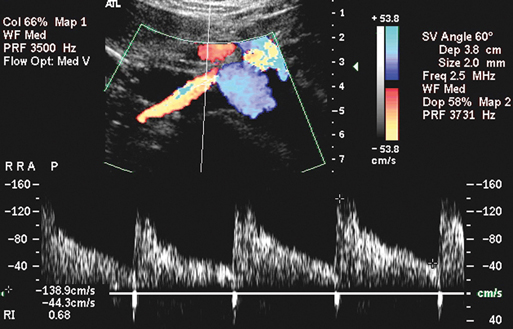
The abdominal aorta is evaluated initially to determine if there is aneurysmal or occlusive disease, and the aortic peak systolic velocity (PSV) is measured at the level of the superior mesenteric artery (Figure 1). The origins of the main renal arteries are most commonly identified from a midline approach, with the aorta in transverse view, located just distal to the superior mesenteric artery, and near the level of the left renal vein as it crosses anterior to the aorta. An attempt should also be made to locate and evaluate accessory renal arteries.


Velocity spectral waveforms are recorded along the course of both main renal arteries and any accessory renal arteries, with particular emphasis on focal areas of increased velocity. The angle between the Doppler ultrasound beam and arterial wall should be 60 degrees or less for all velocity measurements. The distal renal arteries, as well as the hilar and parenchymal flow patterns, can be evaluated from a flank approach if they are not adequately imaged transabdominally. Measurements of kidney length have diagnostic value and should be included in the routine renal duplex evaluation.


Interpretation


Classification of renal arterial occlusive disease by duplex scanning is based on velocity waveforms from the renal artery and adjacent abdominal aorta. The triphasic flow pattern seen in the aortoiliac and lower extremity arteries is a result of the relatively high vascular resistance of the normal peripheral circulation. In contrast, the normal kidney offers a low vascular resistance, and the renal artery velocity waveform is monophasic with forward flow throughout the cardiac cycle (Figure 2). This low-resistance waveform is also characteristic of the normal internal carotid artery and celiac axis. Renal artery narrowing results in a focally increased renal artery PSV.


Normal renal arteries typically show PSV values of less than 180 cm/sec. Because the PSV associated with a significant renal artery stenosis increases relative to aortic PSV, the ratio of peak systolic velocities in the renal artery and aorta can be used as an index of severity of a renal artery stenosis. This is referred to as the renal-to-aortic ratio (RAR). An RAR of 3.5 or greater is commonly used to identify a 60% or greater renal artery stenosis (Figure 3). However, like the ankle-to-brachial pressure index, this diagnostic ratio compares the arterial site of interest to a normal reference site.


Only gold members can continue reading. Log In or Register to continue

Stay updated, free articles. Join our Telegram channel

Aug 25, 2016 | Posted by in CARDIOLOGY | Comments Off on Duplex Scanning in the Evaluation of Renal Arterial Occlusive Disease

Full access? Get Clinical Tree

Get Clinical Tree app for offline access