Early-stage chronic kidney disease (CKD) is an under-recognized highly prevalent cardiovascular (CV) risk factor. Despite a clustering of conventional atherosclerotic risk factors, it is hypothesized that nonatherosclerotic processes, including left ventricular (LV) hypertrophy and fibrosis, account for a significant excess of CV risk. This cross-sectional observational study of 129 age- (mean age 57 ± 10 years) and gender-matched subjects examined: nondiabetic CKD stages 2 to 4 (mean glomerular filtration rate 50 ± 22 ml/min/1.73 m 2 ) with no history of CV disease, subjects who are hypertensive with normal renal function, and healthy controls. Cardiac magnetic resonance imaging was performed for assessment of LV volumes and systolic function (myocardial deformation). Diffuse myocardial fibrosis was assessed using T1 mapping for native myocardial T1 times before contrast and myocardial extracellular volume (ECV) after gadolinium administration in combination with standard late gadolinium enhancement techniques for detection of coarse fibrosis. Patients with CKD had increased native T1 times (986 ± 37 ms) and ECV (0.28 ± 0.04) compared with controls (955 ± 30 ms, 0.25 ± 0.03) and subjects who are hypertensive (956 ± 31 ms, 0.25 ± 0.02, p <0.05). Both T1 times and ECV were correlated with impaired systolic function as assessed by global longitudinal systolic strain (r = −0.22, p <0.05, and r = −0.43, p <0.01, respectively). There were no differences in LV volumes, ejection fraction, or LV mass. T1 times and ECV did not correlate with conventional CV risk factors. In conclusion, diffuse myocardial fibrosis is increased in early CKD and is associated with abnormal global longitudinal strain, an early feature of uremic cardiomyopathy and a key indicator of adverse CV prognosis.
Large cross-sectional studies have demonstrated that cardiovascular (CV) risk begins to increase in early-stage chronic kidney disease (CKD) when estimated glomerular filtration rate (eGFR) levels are ∼75 ml/min/1.73 m 2 and that risk increases progressively as eGFR decreases. There is increasing evidence that adverse changes in cardiac structure and function are present early in the course of CKD; the prevalence of left ventricular (LV) hypertrophy on 2-dimensional echocardiography increases with a graded inverse relation to eGFR, and subclinical systolic and diastolic dysfunctions are detectable using tissue Doppler echocardiography. It is not known, however, whether diffuse interstitial fibrosis occurs in early-stage CKD and, if present, whether it is associated with adverse changes in LV function. We hypothesized that diffuse interstitial fibrosis measured using cardiac magnetic resonance (CMR) imaging is present in early-stage CKD and is associated with myocardial dysfunction.
Methods
Patients were prospectively recruited from renal clinics at the Queen Elizabeth Hospital Birmingham, England, from 2012 to 2014. Inclusion criteria were CKD stage 2 (eGFR 60 to 89 ml/min/1.73 m 2 with other evidence of kidney disease: proteinuria/hematuria/structural abnormality/genetic), stage 3 (eGFR 30 to 59 ml/min/1.73 m 2 ), and stage 4 (15 to 29 ml/min/1.73 m 2 ) with no history or symptoms of CV disease or diabetes. Estimated GFR was measured by the 4-Variable Modification of Diet in Renal Disease formula. Subjects were compared with (1) age- and gender-matched healthy controls recruited as part of an ongoing clinical study and (2) age- and gender-matched, treated patients who are hypertensive referred to a dedicated hypertension clinic. The study was approved by the National Research Ethics Service—South Birmingham (12/WM/0250), and all subjects gave informed consent.
Subjects underwent CMR (1.5 T Avanto; Siemens Healthcare, Erlangen, Germany). LV and right ventricular (RV) volumes, mitral annular plane systolic excursion, ejection fraction (EF) and LV mass index (LVMI) were acquired in line with standard CMR protocols. Left atrial (LA) volumes were calculated using the biplane area-length method. The 4-chamber and short-axis steady-state free precession (SSFP) cine images (electrocardiogram-gated; temporal resolution 40 to 50 ms, repetition time 3.2 ms, echo time 1.6 ms, flip angle 60°, slice thickness 7 mm) at the mid-LV (papillary muscle) were used for myocardial deformation analysis. An SSFP single-breath hold–modified look-locker inversion recovery sequence was used for T1 mapping in the LV basal and mid-ventricular short-axis levels before and between 15 and 20 minutes after contrast administration (8-mm slice with a 192 read-out matrix, 6 of 8-phase partial Fourier with 81% phase resolution, field of view 320 × 320, repetition time 2.4 ms, echo time 1.01 ms, 11 phases [3, 3, 5 scheme], and total breath hold 17 R-R intervals). Late gadolinium enhancement (LGE) imaging was performed 7 to 10 minutes after 0.15 mmol/kg of gadolinium contrast bolus (Gadovist Bayer Health Care, Newbury, Berkshire, England). All patients were consented to receive intravenous gadolinium 0.15 mmol/kg.
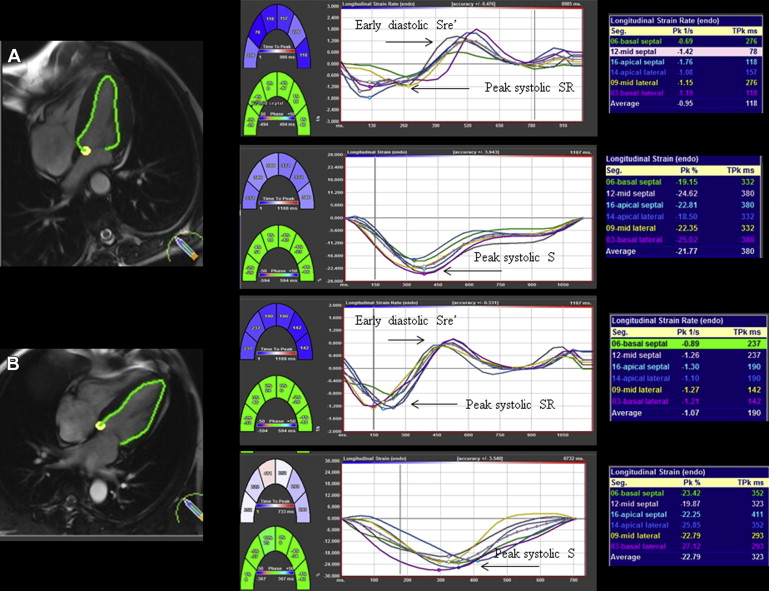
CMR analysis was performed off-line using CVI 42 software (Circle Cardiovascular Imaging Inc., Calgary, Canada). Myocardial deformation was assessed using Diogenes CMR-FT software (TomTec Imaging Systems, Munich, Germany), a vector-based analysis tool, for subendocardial strain analysis in the LV 4-chamber SSFP image ( Figure 1 ). Endocardial borders were drawn manually in the end-diastolic frame for each image. The CMR-FT software automatically propagated the contour and followed it through the cardiac cycle. Global longitudinal peak systolic strain (GLS), peak systolic strain rate (GLSR), and early diastolic strain rate (GLSRe) were derived.
Quantitative parametric T1 images were generated using Argus software (Siemens Healthcare) with manual contouring to define a region of interest (ROI) in the LV septum at basal and mid-myocardial levels. Global native (noncontrast) myocardial T1 time (ms) was calculated from the averaged T1 times in the LV septum basal and mid-ventricular ROIs before contrast administration and global extracellular volume (ECV) after contrast using validated formulae :
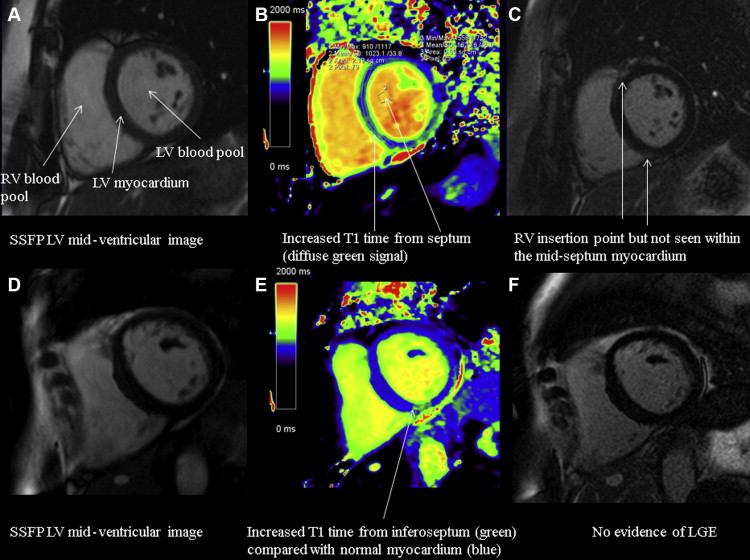
Hct refers to the hematocrit recorded on a venous blood sample at the time of scan, ΔR1 = 1/T1 time postcontrast – 1/T1 time precontrast. Lambda (λ) refers to (1/T1 myocardium postcontrast – 1/T1 myocardium precontrast)/(1/T1 blood postcontrast – 1/T1 blood precontrast). ROIs were drawn to exclude any areas of LGE consistent with previously undiagnosed infarction and RV insertion point LGE, consistent with previously published methodology ( Figure 2 ). Myocardial intracellular volume was also calculated as 1 − ECV, providing a measure of cell volume that is important when interpreting the composition of the myocardium with LV hypertrophy. All data were analyzed by a single experienced observer (NCE).
Continuous variables are expressed as mean ± SD if normally distributed or median (twenty-fifth to seventy-fifth percentile) if non-normally distributed by the Shapiro-Wilk test. Paired group comparisons were performed using independent t test and 1-way analysis of variance with Bonferroni post hoc tests or Kruskal-Wallis test, as appropriate. Correlations between variables were assessed by bivariate analysis as appropriate. Statistical tests were 2 tailed, and a p value <0.05 was considered to indicate statistical significance.
Results
In total, 129 subjects were studied across the 3 groups without significant differences in age and gender. The leading causes of renal disease were primary glomerular nephropathy (37%), adult polycystic kidney disease (21%), and quiescent vasculitis (systemic lupus erythematosus, Wegeners granulomatosis, 16%). Patient characteristics are presented in Table 1 .
| Variable | CKD n = 43 | Controls n = 43 | Hypertension n = 43 |
|---|---|---|---|
| Age (years) | 57 ± 10 | 57 ± 10 | 57 ± 10 |
| Men | 24 (56%) | 24 (56%) | 24 (56%) |
| Body Surface Area (m 2 ) | 1.9 ± 1.2 | 1.9 ± 1.2 | 1.9 ± 1.2 |
| Body Mass Index (Kg/m 2 ) | 26 ± 3 ∗ | 26 ± 5 | 28 ± 5 |
| Haemoglobin (g/L) | 127 ± 16 ∗ † | 138 ± 11 | 136 ± 14 |
| Haematocrit (%) | 0.38 ± 0.04 ∗ † | 0.41 ± 0.04 | 0.41 ± 0.04 |
| Serum creatinine (mg/dL)) | 1.38 (0.78-2.09) ∗ | 0.9 ± 0.16 | 0.95 ± 0.18 |
| N-terminal pro B Natriuretic peptide (ng/L) # | 76 (47-187) ∗ | 3 (3-173) | 7 (5-20) |
| Glomerular Filtration Rate (ml/min/1.73m 2 )# | 50 ± 22 ∗ † | 80 ± 11 | 81 ± 8 |
| Stage 2 n | 16 | – | – |
| Stage 3 n | 16 | – | – |
| Stage 4 n | 11 | – | – |
| Total cholesterol (mg/dL) | 185 ± 31 | 201 ± 43 | 189 ± 35 |
| Systolic blood pressure (mmHg) | 127 ± 12 † | 126 ± 11 | 143 ± 17 |
| Diastolic blood pressure (mmHg) | 69 ± 11 † | 77 ± 8 | 93 ± 11 |
| Medications | |||
| Angiotensin converting enzyme inhibitor or angiotensin receptor blocker | 37 (86%) ∗ † | 0 (0%) | 11 (26%) |
| Diuretic | 9 (21%) ∗ | 0 (0%) | 7 (16%) |
| Beta blocker | 4 (9%) | 2 (5%) | 2 (5%) |
| Calcium channel blocker | 9 (21%) ∗ | 1 (2%) | 11 (26%) ‡ |
∗ p<0.05 CKD vs. Controls, † p<0.05 CKD vs. hypertension, ‡p<0.05 hypertension vs. controls.
Stay updated, free articles. Join our Telegram channel

Full access? Get Clinical Tree


