Thrombotic events while receiving antiplatelet agents (APAs) are more common in subjects with versus without chronic kidney disease (CKD). Data on antiplatelet effects of APA in CKD are scarce and limited by lack of baseline platelet function before APA treatment. We hypothesized subjects with stages 4 to 5 CKD versus no CKD have greater baseline platelet aggregability and respond poorly to aspirin and clopidogrel. In a prospective controlled study, we measured whole blood platelet aggregation (WBPA) in 28 CKD and 16 non-CKD asymptomatic stable outpatients not on APA, frequency-matched for age, gender, obesity, and diabetes mellitus. WBPA was remeasured after 2 weeks of each aspirin and aspirin plus clopidogrel. The primary outcome was percent inhibition of platelet aggregation (IPA) from baseline. The secondary outcome was residual platelet aggregability (RPA; proportion with <50% IPA). Baseline platelet aggregability was similar between groups except adenosine diphosphate–induced WBPA, which was higher in CKD versus non-CKD; median (interquartile range) = 13.5 (9.5 to 16.0) versus 9.0 (6.0 to 12.0) Ω, p = 0.007. CKD versus non-CKD participants had lower clopidogrel-induced IPA, 38% versus 72%, p = 0.04. A greater proportion of CKD versus non-CKD participants had RPA after clopidogrel treatment (56% vs 8.3%, p = 0.01). There were no significant interactions between CKD and the presence of cytochrome P450 2C19 polymorphisms for platelet aggregability in clopidogrel-treated participants. In conclusion, CKD versus non-CKD subjects exhibited similar platelet aggregation at baseline, similar aspirin effects and greater RPA on clopidogrel, which was independent of cytochrome P450 2C19 polymorphisms.
Patients with chronic kidney disease (CKD) are at a greater risk for thrombotic cardiovascular events compared to those without CKD. Although there are several factors explaining increased thrombotic events in patients with CKD, poor efficacy of antiplatelet agents (APAs) is a well-known risk factor for increased thrombotic events. However, previous studies reporting the presence of residual platelet aggregability (RPA) were limited by the use of less physiological techniques, such as optical aggregometry, to measure platelet function, and the inclusion of primarily end stage renal disease (ESRD) and not patients with non-dialysis CKD, where earlier intervention for secondary cardiovascular prevention may be more efficacious. These studies also suffered from failure to measure before and after treatment effects of APA on platelet aggregability and lacked non-CKD controls. Surprisingly, there are little data on how baseline platelet function may differ in stable CKD versus non-CKD subjects. It is also unclear whether there are differences in platelet aggregation in response to APA on the basis of the presence or absence of CKD or as related to the presence of cytochrome P450 polymorphisms such as cytochrome P450 2C19 (CYP2C19), a major drug metabolic enzyme involved in the conversion of ingested clopidogrel prodrug into its active metabolite.
Methods
We conducted the Whole Blood Platelet Aggregation in Chronic Kidney Disease on Aspirin study, an open-label prospective clinical trial, to compare the degree of platelet inhibition from baseline by aspirin (81 mg/day) and by a combination of aspirin (81 mg/day), and clopidorgrel (75 mg/day) in a frequency-matched cohort of asymptomatic patients with non-dialysis CKD and controls without CKD. We hypothesized that compared to those without kidney disease, those with CKD: (1) have greater platelet aggregability at baseline as measured by ex vivo whole blood impedance platelet aggregation and (2) have a reduced response to aspirin and clopidogrel, as measured by lower inhibition of platelet aggregation (IPA) from baseline and greater RPA. Finally, we explored whether there was an interaction between CKD and the presence of CYP2C19 polymorphisms for platelet aggregability in clopidogrel-treated patients. Institutional review board approval was obtained. Adults aged ≥ 21 years were recruited from outpatient clinics at Parkland, Dallas Veterans Affairs, and the University of Texas Southwestern Medical Centers in Dallas, Texas from December 10, 2012, to January 31, 2014. Non-CKD participants were included if there was no evidence of kidney disease as defined by estimated glomerular filtration rate ≥90 ml/min/1.73 m 2 , urine albumin-to-creatinine ratio <30 mg/g and no detectable kidney disease by other methods defined by National Kidney Foundation guidelines. Patients with CKD were those with non-dialysis CKD stages 4 to 5, with an estimated glomerular filtration rate of <30 ml/min/1.73 m 2 for at least 3 months, calculated using the 4-variable Modified Diet and Renal Disease equation. Exclusion criteria were similar to those used in previous platelet studies : the presence of ESRD or kidney transplantation, hospitalization or surgery within 3 months, cardiovascular event within 12 months, history of blood dyscrasias, active bleeding or bleeding diathesis, gastrointestinal bleeding in the past 6 months, active malignancy or liver disease, ongoing use of APA or antithrombotic drugs, <30 days treatment with a glycoprotein IIb/IIIa antagonist, hematocrit <25%, white blood cell count >20,000/μL, or platelet count <50,000/μL. Patients who were taking aspirin for primary cardiovascular prevention were included but asked to discontinue use for at least 2 weeks before baseline measurements. The 2 groups were frequency matched for decade of age, gender, presence of diabetes, and each 5 kg/m 2 of body mass index, as these characteristics were reported to influence platelet function.
On visit 1, demographic, clinical, and medication use data were collected. Data on the following variables were obtained: (1) diabetes mellitus (defined as glycosylated hemoglobin level ≥6.3%, fasting blood glucose level ≥126 mg/dl, or use of hypoglycemic agents); (2) hyperlipidemia (use of antilipid medications, total cholesterol ≥240 mg/dl, or serum low-density lipoprotein ≥160 mg/dl), current smoking (any cigarette smoking in the past 30 days); and (3) hypertension (an average of 4 office blood pressure readings ≥140/90 mm Hg and/or use of antihypertensive medication). Dietary supplements were discontinued for 2 weeks before the study. Patients were also asked to not smoke or eat foods known to affect platelet function (coffee, chocolate, grapes, and alcohol) 48 hours before every sample collection. Diet and physical activity were assessed at every visit by the administration of the Modified 24-hour Dietary Recall and the Stanford 7-day Physical Activity Recall interviewer-administered questionnaires. Venipuncture was also performed at each visit for complete blood count, whole blood platelet aggregation (WBPA) measurements, and adenosine triphosphate (ATP) secretions. Patients were dispensed chewable aspirin 81 mg/day. After 2 weeks, patients returned for visit 2. WBPA and ATP secretion measurements were repeated. Two buccal swabs were collected for genotype analysis. Aspirin 81 mg/day and clopidogrel 75 mg/day were dispensed. Patients returned in 2 weeks for visit 3. WBPA induced by adenosine diphosphate (ADP) was measured to analyze clopidogrel effect. Patients were asked to take APA on the morning of venipuncture so that everyone received phlebotomy within 3 to 4 hours of pill intake. Pill counts were performed for adherence.
The primary outcome measure was the IPA, defined as follows :%IPA = (baseline aggregation) − (posttreatment aggregation)/(baseline aggregation). The secondary outcome measure was RPA, defined as the proportion with <50% inhibition of aggregation from baseline. WBPA was measured by ex vivo whole blood impedance platelet aggregometry (Chrono-Log Corporation, Havertown, Pennsylvania). ATP secretion was measured using the firefly luciferin–luciferase reaction (Chrono-Log). Genotyping of all CYP2C19 alleles was performed from buccal swabs using real-time polymerase chain reaction (Harmonyx Diagnostics Inc., Cordova, Tennessee). Major alleles, CYP2C19*2 and CYP2C19*17 genotypes were classified on the basis of the standardized metabolic phenotypes. For the purposes of testing 2-way interactions with CKD, intermediate (CYP2C19*1/*2 and CYP2C19*2/*17) and poor (CYP2C19*2/*2) metabolic groups were collapsed into one category as poor metabolic phenotype.
For sample size calculations, we used published data on healthy volunteers as historical controls and unpublished pilot data from the Chronic Kidney Disease Antidepressant Sertraline Trial for patients with CKD. From log-transformed pilot data (non-Gaussian), a coefficient of variation of 0.84 (SD/Mean = 1.35/1.6 in log units) was calculated. With a sample of 30 patients (20 CKD and 10 non-CKD) and a 2-sided alpha of 0.05, the study would have 84% power to detect at least a 4 Ω between-group difference in the geometric means of WBPA induced by 0.5 mM arachidonic acid (AA) at baseline or on treatment with APA. Student t test or Wilcoxon rank-sum test was used to compare continuous and Fisher’s exact test to compare categorical variables in CKD versus non-CKD groups. Mixed model repeated measures analyses were used to compare WBPA induced by 0.5 mM AA, 2 μg/ml collagen, and ADP responses (change) to aspirin and dual therapy between groups. The model had group factor, treatment factor (repeated, before vs after), and interaction between group and treatment as covariates; the participant was modeled as a random effect. RPA was compared between groups using the Fisher’s exact test. Proportions of metabolic phenotypes of CYP2C19 polymorphisms were analyzed between groups on the basis of the presence of CKD and compared using Fisher’s exact test. Analysis of variance was used to test any 2-way interactions of poor (vs normal) metabolic phenotype X CKD and rapid (vs normal) metabolic phenotype X CKD on IPA after clopidogrel treatment. All available data were included in the analyses; the mixed model can accommodate cases with incomplete data. Analyses were performed with SAS version 9.3 (SAS Institute, North Carolina).
Results
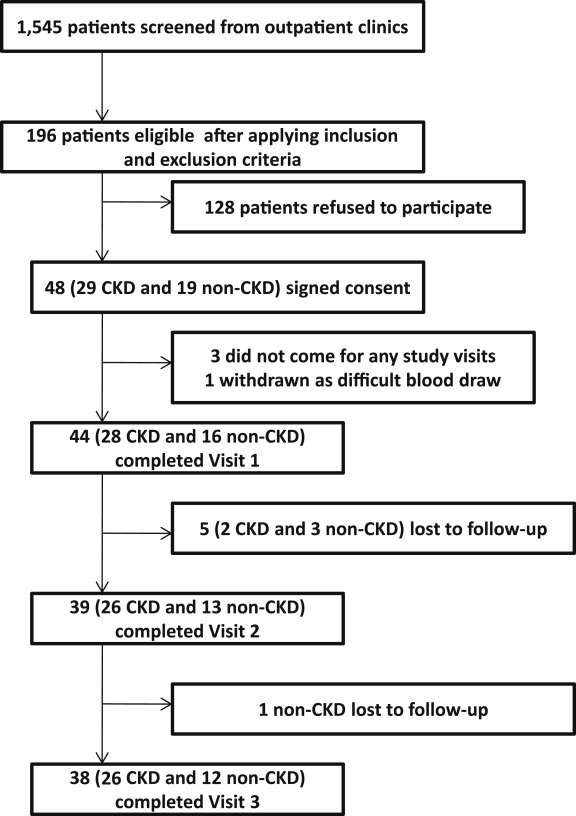
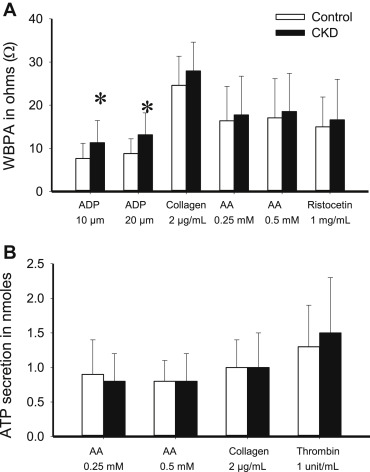
Figure 1 shows the exclusionary cascade for derivation of the cohorts. Baseline characteristics, on the basis of the presence or absence of CKD, are listed in Table 1 . A greater proportion of participants with CKD versus no CKD reported use of β blockers and statins ( Table 1 ). Those with CKD compared with no CKD had a lower mean hemoglobin concentration and higher glycosylated hemoglobin, serum uric acid, phosphorus, and intact parathyroid hormone levels ( Table 1 ). There were no between-group differences in the baseline values for ATP secretions and WBPA except when induced by ADP ( Table 2 and Figure 2 ).
| Variable | Chronic Kidney Disease | p-value | |
|---|---|---|---|
| No (n =16) | Yes (n =28) | ||
| Age (years) | 49 ± 11 | 52 ± 10 | 0.48 ∗ |
| BMI (kg/m 2 ) | 29.8 ± 4.9 | 32.0 ± 5.5 | 0.19 ∗ |
| Woman | 8 (50%) | 12 (43%) | 0.65 |
| Black | 4 (25%) | 15 (54%) | 0.06 |
| Diabetes mellitus | 7 (44%) | 13 (46%) | 0.86 |
| Proton pump inhibitor use | 1 (6%) | 1 (4%) | 1.00 |
| Beta blocker use | 0 | 21 (75%) | <0.0001 |
| Statin use | 5 (31%) | 19 (68%) | 0.02 |
| Angiotensin converting enzyme inhibitor or angiotensin receptor blocker use | 5 (31%) | 12 (43%) | 0.45 |
| Allopurinol use | 0 | 6 (21%) | 0.07 |
| Baseline use of aspirin | 4 (25%) | 12 (43%) | 0.24 |
| eGFR (mL/min/1.73 m 2 ) | 101 ± 15 | 17 ± 7 | <0.0001 ∗ |
| Urine albumin-to-creatinine ratio (mg/g) | 5 (2.5-8.8) | 1,282 (143-1,848) | <0.0001 † |
| Hemoglobin (g/dL) | 14.4 ± 1.7 | 11.2 ± 1.7 | <0.0001 ∗ |
| Hematocrit (%) | 42.6 ± 4.2 | 33.9 ± 5.1 | <0.0001 ∗ |
| White blood cell count (K per μL) | 6 ± 2 | 8 ± 2 | 0.06 ∗ |
| Platelet count (K per μL) | 217 ± 55 | 232 ± 55 | 0.43 ∗ |
| Serum total cholesterol (mg/dL) | 180 ± 33 | 170 ± 42 | 0.46 ∗ |
| Serum triglycerides (mg/dL) | 112 (55-211) | 124 (104-161) | 0.44 † |
| Serum low density lipoprotein (mg/dL) | 106 (70-124) | 94 (61-118) | 0.38 † |
| Serum total bilirubin (mg/dL) | 0.6 (0.4-0.7) | 0.3 (0.2-0.5) | 0.02 † |
| Glycosylated hemoglobin (%) | 6.4 ± 0.4 | 6.8 ± 0.4 | <0.0001 ∗ |
| Serum albumin (g/dL) | 4.2 ± 0.4 | 4.0 ± 0.5 | 0.13 ∗ |
| Serum uric acid (mg/dL) | 5.1 ± 1.8 | 8.9 ± 2.0 | <0.0001 ∗ |
| Serum calcium (mg/dL) | 9.3 ± 0.3 | 9.1 ± 0.8 | 0.31 ∗ |
| Serum phosphorus (mg/dL) | 3.3 ± 0.3 | 4.6 ± 1.1 | <0.0001 † |
| Serum parathyroid hormone (pg/mL) | 42 (34-46) | 197 (143-358) | <0.0001 † |
| Serum 25-hydroxyvitamin D (ng/mL) | 29 ± 15 | 28 ± 14 | 0.80 ∗ |
∗ Student t test used for comparison.
| Profile | Chronic kidney disease | |||
|---|---|---|---|---|
| No | Yes | p-value | ||
| Visit 1: Baseline | ||||
| Aggregation to 0.5 mM arachidonic acid (Ω) | 18.0 (10.0, 20.0) | 21.0 (10.5, 24.5) | 0.27 | |
| Aggregation to 0.25 mM arachidonic acid (Ω) | 17.0 (9.0, 21.0) | 19.5 (12.0, 22.0) | 0.43 | |
| Aggregation to 20 μM adenosine diphosphate (Ω) | 9.0 (6.0, 12.0) | 13.5 (9.5, 16.0) | 0.007 ∗ | |
| Aggregation to 10 μM adenosine diphosphate (Ω) | 8.0 (5.0, 11.0) | 12.5 (8.0, 14.5) | 0.02 ∗ | |
| Aggregation to 2 μg/mL collagen (Ω) | 25.0 (20.0, 30.0) | 28.5 (23.5, 31.5) | 0.21 | |
| Aggregation to 1 mg/mL ristocetin (Ω) | 14.0 (9.0, 22.0) | 14.0 (9.5, 20.0) | 0.92 | |
| Secretion to 0.5 mM arachidonic acid (nmoles) | 0.81 (0.65, 0.98) | 0.67 (0.52, 1.05) | 0.79 | |
| Secretion to 0.25 mM arachidonic acid (nmoles) | 0.92 (0.60, 1.33) | 0.75 (0.5, 0.94) | 0.24 | |
| Secretion to 2 μg/mL collagen (nmoles) | 1.05 (0.79, 1.28) | 0.92 (0.62, 1.32) | 0.72 | |
| Secretion to 1 unit/mL thrombin (nmoles) | 1.28 (0.82, 1.64) | 1.32 (0.93, 1.84) | 0.54 | |
| Visit 2: On Aspirin | ||||
| Aggregation to 0.5 mM arachidonic acid (Ω) | 0 | 0 | 0.67 | |
| Aggregation to 0.25 mM arachidonic acid (Ω) | 0 | 0 | 0.50 | |
| Aggregation to 20 μM adenosine diphosphate (Ω) | 10.0 (8.0, 11.0) | 11.0 (8.0, 16.0) | 0.19 | |
| Aggregation to 10 μM adenosine diphosphate (Ω) | 9.0 (7.0, 11.0) | 10.5 (8.0, 14.0) | 0.14 | |
| Aggregation to 2 μg/mL collagen (Ω) | 19.0 (16.0, 22.0) | 19.5 (16.0, 26.0) | 0.72 | |
| Aggregation to 1 mg/mL ristocetin (Ω) | 6.0 (4.0, 6.0) | 7.5 (6.0, 12.0) | 0.04 | |
| Secretion to 0.5 mM arachidonic acid (nmoles) | 0 | 0 (0, 0.15) | 0.03 ∗ | |
| Secretion to 0.25 mM arachidonic acid (nmoles) | 0 (0, 0.1) | 0 (0, 0.11) | 1.0 | |
| Secretion to 2 μg/mL collagen (nmoles) | 0.48 (0.4, 0.61) | 0.59 (0.4, 0.83) | 0.20 | |
| Secretion to 1 unit/mL thrombin (nmoles) | 0.82 (0.77, 1.55) | 1.32 (1.09, 1.47) | 0.21 | |
| Visit 3: On Aspirin/Clopidogrel | ||||
| Aggregation to 20 μM adenosine diphosphate (Ω) | 3.0 (0, 4.0) | 8.0 (1.0, 12.0) | 0.04 ∗ | |
| Aggregation to 10 μM adenosine diphosphate (Ω) | 1.0 (0, 3.0) | 7.0 (1.0, 12.0) | 0.02 ∗ | |
∗ Denotes statistically significant p values for Wilcoxon rank-sum test comparing CKD yes versus no.
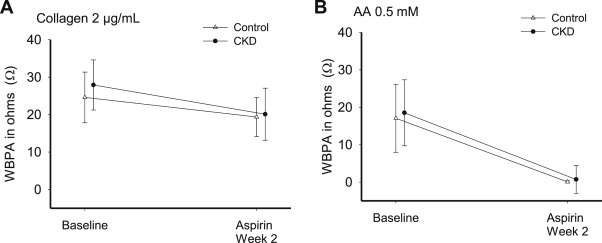
Aspirin effect ( Table 2 ; Figure 3 ) was evaluated at visit 2 by the change from baseline (visit 1) in platelet aggregation induced by AA and collagen after 2 weeks of aspirin 81 mg/day. Both groups had near complete IPA to AA on aspirin ( Table 3 ), group × time interaction p = 0.78. Response to collagen was incomplete in both groups, group × time interaction p = 0.29. Finally, proportion of patients with RPA on aspirin was not different between groups ( Table 4 ). Clopidogrel effect was evaluated at visit 3 by ADP response after 2 weeks of aspirin/clopidogrel ( Table 2 ; Figure 4 ). IPA in response to clopidogrel was significantly lower in patients with CKD versus without CKD ( Table 3 ). In addition, a greater proportion of CKD versus non-CKD participants had RPA after clopidogrel treatment ( Table 4 ). Group × time interaction was not significant (p = 0.46 for 10 μM ADP and p = 0.42 for 20 μM ADP). There were no differences in the metabolizer phenotypes between groups ( Table 5 ). Figure 5 shows platelet inhibitory responses to clopidogrel in the 2 groups on the basis of the 4 metabolic phenotypes (CKD × metabolic phenotype interaction p >0.1). There were no hospitalizations or bleeding episodes requiring APA discontinuation or blood transfusion. Three CKD and 2 non-CKD participants experienced self-limited spontaneous bruises or nose bleeds on aspirin alone. Two patients with CKD and 7 patients without CKD experienced similar episodes on aspirin/clopidogrel.
Stay updated, free articles. Join our Telegram channel

Full access? Get Clinical Tree


