John M. Miller, Douglas P. Zipes
Diagnosis of Cardiac Arrhythmias
In managing clinical arrhythmias, physicians must evaluate and treat the whole patient, not just the rhythm disturbance.1 Some arrhythmias are hazardous to the patient, regardless of the clinical setting (e.g., ventricular fibrillation [VF]), whereas others are hazardous because of the clinical setting (e.g., rapidly conducted atrial fibrillation [AF] in a patient with severe coronary artery stenoses). Some rhythm abnormalities, such as premature ventricular complexes (PVCs), may be highly symptomatic but not associated with any adverse outcomes, whereas some patients with AF have no symptoms at all but may still be at significant risk for stroke. Evaluation of the patient begins with a careful history and physical examination and should usually progress from the simplest to the most complex test, from the least invasive and safest to the most invasive and risky, and from the least expensive out-of-hospital evaluations to those that require hospitalization and sophisticated, costly, and potentially risky procedures. On occasion, depending on the clinical circumstances, the physician may wish to proceed directly to an expensive procedure associated with some risk, such as an electrophysiologic study (EPS), before obtaining a 24-hour electrocardiographic recording. In most cases, management of arrhythmia has a dual purpose: evaluation and treatment must address not only the patient’s symptoms but also whatever risks that the arrhythmia poses to the individual.
History
Patients with disturbances in cardiac rhythm can have various complaints, but symptoms such as palpitations, syncope, presyncope, or dyspnea commonly cause them to seek a physician’s help. Their awareness of palpitations and a regular or irregular cardiac rhythm varies greatly. Some patients perceive slight variations in their heart rhythm with uncommon accuracy, whereas others are oblivious to even sustained episodes of ventricular tachycardia (VT); still others complain of palpitations when they actually have regular sinus rhythm.
In assessing a patient with a known or suspected arrhythmia, several key pieces of information should be obtained that can help determine a diagnosis or guide further diagnostic testing. The mode of onset of an episode may provide clues about the type of arrhythmia or preferred treatment option. For example, palpitations that occur in the setting of exercise, fright, or anger are often caused by catecholamine-sensitive automatic or triggered tachycardias that may respond to adrenergic blocking agents (see Chapter 35); palpitations that occur at rest or that awaken the patient may be caused by vagal initiation, such as AF. Lightheadedness or syncope occurring in the setting of a tightly fitting collar, shaving the neck, or turning the head suggests carotid sinus hypersensitivity. The triggering event may help establish the presence of an inherited ion channel abnormality (see Chapter 32). The mode of termination of episodes can also be helpful: palpitations that are reliably terminated by breath-holding or by Valsalva or other vagal maneuvers probably involve the atrioventricular (AV) node as an integral part of a tachycardia circuit; on occasion, focal atrial tachycardias or VTs can be terminated with vagal maneuvers. Patients should be asked about the frequency and duration of episodes and the severity of symptoms. In some women the features of their episodes vary according to the menstrual cycle. These features can help guide how aggressively and quickly the physician needs to pursue a diagnostic or therapeutic plan (a patient with daily episodes associated with near-syncope or severe dyspnea warrants a more expeditious evaluation than does one with infrequent episodes of mild palpitations and no other symptoms). Patients can sometimes report their heart rate during an episode (either rapid or slow, regular or irregular) by counting the pulse directly or by using an automatic blood pressure or heart rate monitor or smart phone application. Characteristics of the mode of onset and frequency of episodes can guide the choice of diagnostic tests (see later).
A careful drug and dietary history should also be sought; some nasal decongestants can provoke tachycardia episodes, whereas beta-adrenergic blocking eye drops for the treatment of glaucoma can drain into tear ducts, be absorbed systemically, and precipitate syncope secondary to bradycardia. Dietary supplements, particularly those containing stimulants such as ephedrine, can cause arrhythmias. A growing list of drugs can directly or indirectly affect ventricular repolarization and produce or exacerbate long–QT interval–related tachyarrhythmias (see Chapter 9; see also www.crediblemeds.org). The patient should be questioned about the presence of systemic illnesses that may be associated with arrhythmias, such as chronic obstructive pulmonary disease, thyrotoxicosis (see Chapter 81), pericarditis (see Chapter 71), and chronic heart failure (see Chapters 24 and 25), as well as previous chest injury, surgery, or radiation therapy or chemotherapy. A family history of rhythm disturbances is often present in those with long-QT syndrome, AF or other inherited arrhythmia syndromes, hypertrophic cardiomyopathy (see Chapter 66), and muscular or myotonic dystrophy (see Chapter 87).
Physical Examination
Examination of a patient during an arrhythmia episode can be revealing. Heart rate and blood pressure should be evaluated, as well as how ill the person appears. Assessment of jugular venous pressure and waveform can disclose the rapid oscillations of atrial flutter or “cannon” A waves indicative of contraction of the right atrium against a closed tricuspid valve in patients with AV dissociation in disorders such as complete heart block or VT. Variations in the intensity of the first heart sound and systolic blood pressure have the same implications.
Physical maneuvers during tachycardia can have diagnostic and therapeutic value. As noted, the Valsalva maneuver2 (as well as carotid sinus massage) causes a transient increase in vagal tone; tachyarrhythmias that depend on the AV node for continuation can terminate or slow with these maneuvers but may also show no change. Even though focal atrial and VTs occasionally terminate in response to vagal stimulation, sinus tachycardia slows slightly but returns to its original rate soon thereafter; the ventricular response during atrial flutter and fibrillation and other atrial tachycardias can decrease briefly. During wide-QRS tachycardias with a 1:1 relationship between P waves and QRS complexes, vagal influence can terminate or slow a supraventricular tachycardia (SVT) that depends on the AV node for perpetuation; on the other hand, vagal effects on the AV node can transiently block retrograde conduction and thus establish the diagnosis of VT by demonstrating AV dissociation. Because the effect of either of these physical maneuvers typically lasts only seconds, clinicians must be ready to observe or record any changes in rhythm on an electrocardiogram (ECG) when the maneuver is performed or the response may not be appreciated.
Carotid massage is performed with the patient supine and comfortable and the head tipped away from the side being stimulated. Careful auscultation for carotid bruits must always precede any attempt at carotid massage (embolic events have been associated with massage3). The area of the carotid sinus, at the artery’s bifurcation, is palpated with two fingers at the angle of the jaw until a good pulse is felt. Even this minimal amount of pressure can induce a hypersensitive response in susceptible individuals. If no initial effect is noted, a side-to-side or rotating motion of the fingers over the site is performed for up to 5 seconds. A negative response is lack of effect on the ECG after 5 seconds of pressure adequate to cause mild discomfort. Because responses to carotid massage may differ on the two sides, the maneuver can be repeated on the opposite side; however, both sides should never be stimulated simultaneously. Findings may not be readily reproducible, even within minutes of a prior attempt.
Physical findings can suggest the presence of structural heart disease (and thus generally a clinically more serious situation with a worse overall prognosis), even in the absence of an arrhythmia episode. For example, a laterally displaced or dyskinetic apical impulse, a regurgitant or stenotic murmur, or a third heart sound in an older adult can denote significant myocardial or valvular dysfunction or damage.
Electrocardiogram
The ECG is the primary tool for analysis of arrhythmias (see Chapter 12); an EPS, in which intracardiac catheters are used to record activity from several regions of the heart at one time, is more definitive but not always immediately available. Initially, a 12-lead ECG is recorded. In addition, a long continuous recording with use of the lead that shows distinct P waves is often helpful for closer analysis; typically, this is one of the inferior leads (2, 3, aVF), V1, or aVR. The ECG obtained during an arrhythmia episode may be diagnostic by itself and obviate the need for further diagnostic testing. Figure 34-1 depicts an algorithm for the diagnosis of specific tachyarrhythmias from the 12-lead ECG (see Chapter 37). A major branch point in the differential diagnosis concerns the QRS duration: wide-QRS (>0.12 second) tachycardias are often VTs, and narrow-QRS (≤0.12 second) tachycardias are almost always SVTs, but there is some overlap (Table 34-1). Next, the most important questions to answer, regardless of QRS width, concern the characteristics of P waves. If P waves are not clearly visible on the regular ECG, atrial activity can occasionally be discerned by placing the right and left arm leads in various anterior chest positions (so-called Lewis leads), by recording atrial electrograms using intracardiac right atrial recordings (via permanent or temporary transvenous pacing leads), or by using esophageal electrodes or an echocardiogram; the last methods are not readily available in most clinical situations and consume valuable time when dealing with a sick patient. A long rhythm strip can usually be obtained and may yield important clues by revealing P waves if perturbations occur during the arrhythmia (e.g., changes in rate, premature complexes, sudden termination, and effect of physical maneuvers, as noted earlier).
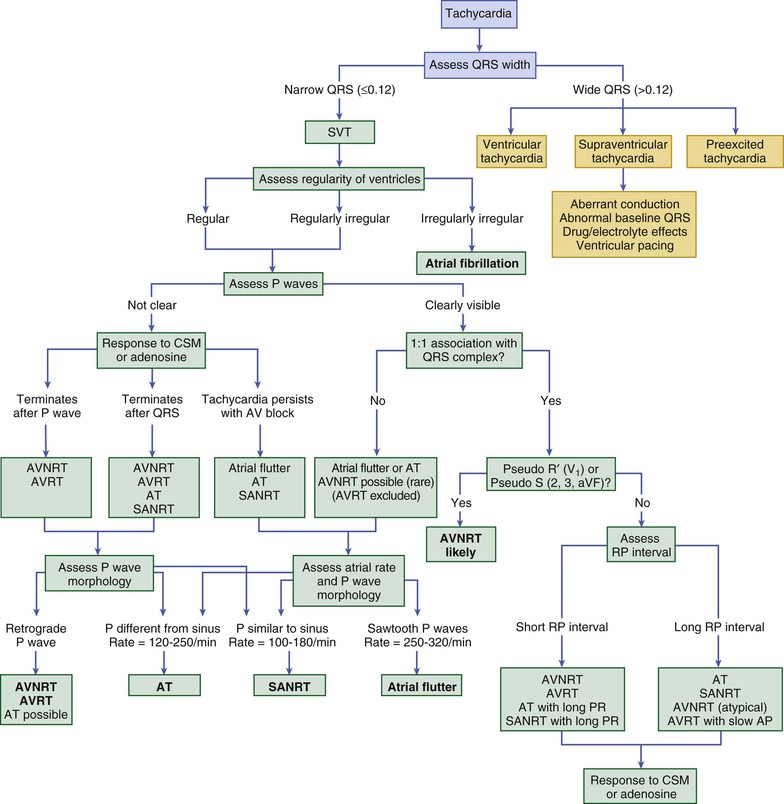
TABLE 34-1
Electrocardiographic Distinctions for Diagnosis of Wide–QRS Complex Tachycardia
| FAVOR SUPRAVENTRICULAR TACHYCARDIA | FAVOR VENTRICULAR TACHYCARDIA |
| Initiation with a premature P wave | Initiation with a premature QRS complex |
| Tachycardia complexes identical to those in resting rhythm | Tachycardia beats identical to PVCs during sinus rhythm |
| “Long-short” sequence preceding initiation | “Short-long” sequence preceding initiation |
| Changes in the P-P interval preceding changes in the R-R interval | Changes in the R-R interval preceding changes in the P-P interval |
| QRS contours consistent with aberrant conduction (V1, V6) | QRS contours inconsistent with aberrant conduction (V1, V6) |
| Slowing or termination with vagal maneuvers | AV dissociation or other non-1:1 AV relationship |
| Onset of the QRS to its peak (positive or negative) <50 msec | Onset of the QRS to its peak (positive or negative) ≥50 msec |
| Fusion beats, capture beats | |
| QRS duration ≤0.14 sec | QRS duration >0.14 sec |
| Left axis deviation (especially −90° to 180°) | |
| Concordant R wave progression pattern | |
| Contralateral bundle branch block pattern from the resting rhythm | |
| Initial R, q, or r >40 msec or notched Q in aVR | |
| Absence of an “rS” complex in any precordial lead |
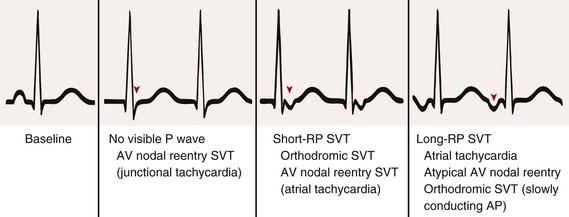
Each arrhythmia should be approached in a systematic manner to answer several key questions; as suggested earlier, many of these questions relate to P wave characteristics and underscore the importance of assessing the ECG carefully for them. If P waves are visible, are the atrial and ventricular rates identical? Are the P-P and R-R intervals regular or irregular? If irregular, is it a consistent, repeating irregularity? Is there a P wave related to each QRS complex? Does the P wave seem to precede (long RP interval) or follow (short RP interval) the QRS complex (Fig. 34-2)? Are the resultant RP and PR intervals constant? Are all P waves and QRS complexes identical? Is the P wave vector normal or abnormal? Are P, PR, QRS, and QT durations normal? Once these questions have been addressed, one needs to assess the significance of the arrhythmia in view of the clinical setting. Should it be treated, and if so, how? For SVTs with a normal QRS complex, a branching decision tree such as that shown in Figure 34-1 may be useful.4
The Ladder Diagram
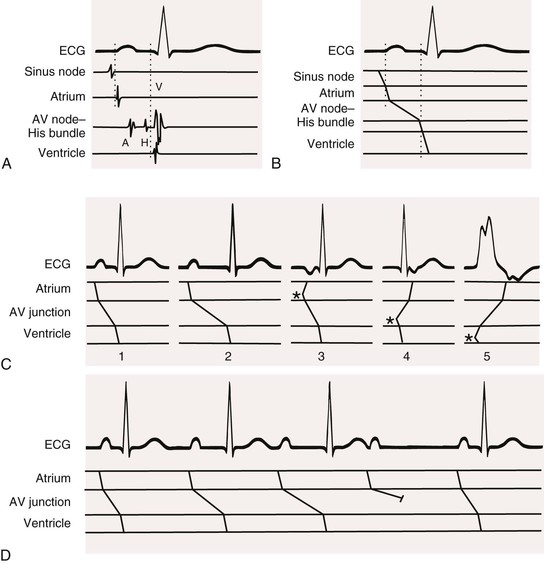
A ladder diagram, derived from the ECG, is used to depict depolarization and conduction schematically to aid in understanding the rhythm. Straight or slightly slanting lines drawn on a tiered framework beneath an ECG represent electrical events occurring in the various cardiac structures (Fig. 34-3). Because the ECG and therefore the ladder diagram represent electrical activity against a time base, conduction is indicated by the lines of the ladder diagram sloping in a left-to-right direction. A steep line represents rapid conduction; more slanting lines depict slower conduction. A short bar drawn perpendicular to a sloping line represents blocked conduction. Activity originating in an ectopic site such as the ventricle is indicated by lines emanating from that tier. Sinus nodal discharge and conduction and, under certain circumstances, AV junctional discharge and conduction can only be inferred; their activity is not directly recorded on the ECG.
Additional Tests
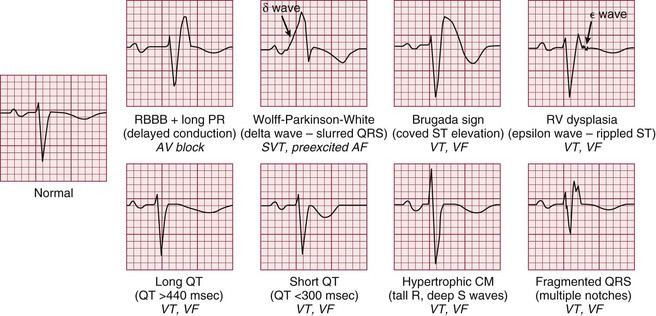
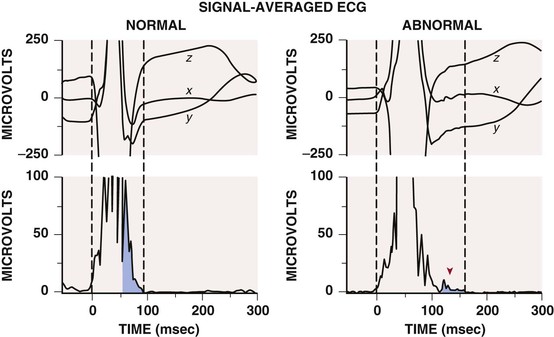
Most patients have only occasional episodes of arrhythmia and spend most of the time in their baseline rhythm (e.g., sinus, AF). The ECG during the patient’s resting rhythm can provide clues about the presence of a substrate for arrhythmia (i.e., structural or physiologic abnormalities from which arrhythmias can arise). Several of these abnormalities are shown in Figure 34-4. Recently, the common finding on the ECG of early repolarization (in the lateral precordial and inferior leads) has been observed in some patients with primary VF (i.e., without identifiable structural heart disease). In most patients with SVT (aside from those with Wolff-Parkinson-White syndrome), findings on the resting ECG are normal. This is also true for many patients with ventricular tachyarrhythmias. Thus although it is capable of showing an abnormality with possible arrhythmic implications, the resting ECG is not a very sensitive tool. In light of this, the following additional tests can be used to evaluate patients who have cardiac arrhythmias. The physician’s choice of which test to use depends on the clinical circumstances. For example, a patient with multiple daily episodes of presyncope is likely to have an event recorded on a 24-hour ambulatory electrocardiographic (Holter) monitor, whereas in a patient who complains of infrequent exercise-induced palpitations, exercise stress testing may be more likely to provide a diagnosis.
Exercise Testing
Exercise can induce various types of supraventricular and ventricular tachyarrhythmias and, uncommonly, bradyarrhythmias (see Chapter 13). Ventricular ectopy develops in approximately a third of normal subjects in response to exercise testing. Ectopy is more likely to occur at faster heart rates, usually in the form of occasional PVCs of constant morphology or even pairs of PVCs, and is often not reproducible from one stress test to the next. Three to six beats of nonsustained VT can occur in normal patients, especially the elderly, and its occurrence does not establish the existence of ischemic or other forms of heart disease or predict increased cardiovascular morbidity or mortality. PVCs are often more common during exercise than at rest and increase in frequency with age; their occurrence does not imply the presence of structural heart disease. A persistent elevation in heart rate after the end of exercise (delay in return to baseline) is associated with a worse cardiovascular prognosis.
PVCs develop in approximately 50% of patients with coronary artery disease in response to exercise testing. Ventricular ectopy appears in these patients at lower heart rates (<130 beats/min) than in the normal population and often occurs in the early recovery period as well. Frequent (>7 PVCs/min) or complex ectopy is associated with a worse prognosis. Exercise reproduces sustained VT or VF in less than 10% of patients with spontaneous VT or VF late after myocardial infarction, and these patients have a worse prognosis. The relationship of exercise to ventricular arrhythmia in patients with structurally normal hearts has no prognostic implications.
Patients who have symptoms consistent with an arrhythmia induced by exercise (e.g., syncope, sustained palpitations) should be considered for stress testing. Stress testing may be indicated to provoke supraventricular and ventricular arrhythmias, to determine the relationship of the arrhythmia to activity, to aid in choosing antiarrhythmic therapy and uncovering proarrhythmic responses, and possibly to provide some insight into the mechanism of the tachycardia. The test can be performed safely; however, prolonged ambulatory recording is more sensitive than exercise testing in detecting most arrhythmias. Because either technique can uncover serious arrhythmias that the other technique misses, both examinations may be indicated for selected patients. Stress testing is frequently useful in patients with long-QT syndrome and catecholaminergic VT (see Chapters 13 and 32).5
In-Hospital Electrocardiographic Recording
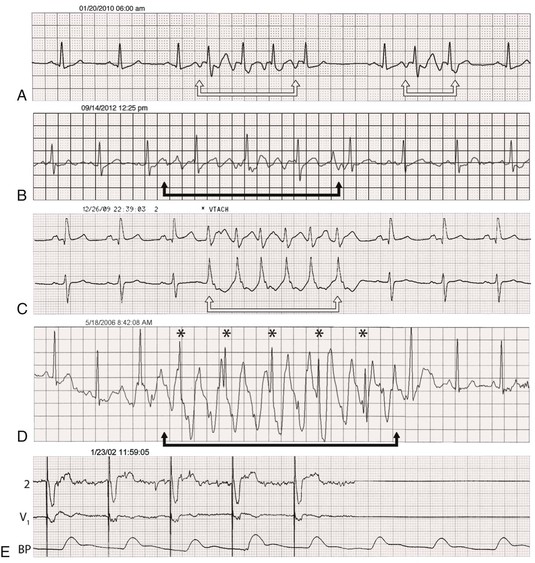
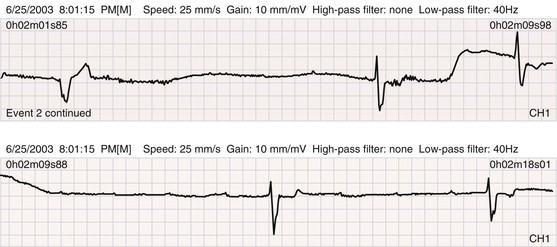
Electrocardiographic monitoring systems are used in increasing proportions of inpatients regardless of history or suspicion of arrhythmias. These systems can provide valuable information about rhythm abnormalities, including mode of onset and termination, and allow prompt acquisition of a full 12-lead ECG for more detail. Telemetry may disclose intermittent heart block in a patient with presyncope that may warrant consideration of pacemaker implantation or reveal nonsustained VT in a patient with previous myocardial infarction and left ventricular dysfunction and prompt an electrophysiology study for further assessment of risk. As often as telemetry is helpful in such cases, however, it can be misleading: artifact can simulate VT or VF, heart block, or asystole. Careful scrutiny is necessary to avoid unnecessary tests and procedures in patients with these artifactual arrhythmias (Fig. 34-5; real and artifact on monitor).
Long-Term Electrocardiographic Recording
Prolonged electrocardiographic recording in patients engaged in normal daily activities is the most useful noninvasive method to document and quantitate the frequency and complexity of an arrhythmia, to correlate the arrhythmia with the patient’s symptoms, and to evaluate the effect of antiarrhythmic therapy on spontaneous arrhythmia. For example, recording normal sinus rhythm during the patient’s typical symptomatic episode effectively excludes cardiac arrhythmia as a cause. In addition, some recorders can document alterations in QRS, ST, and T contours.
Ambulatory Electrocardiographic (Holter) Recording
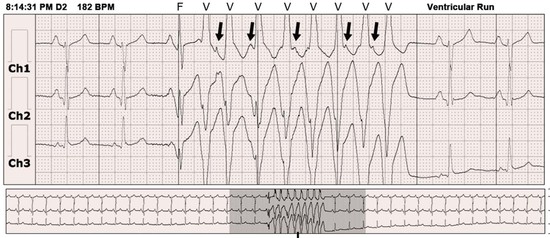
Continuous electrocardiographic tape recorders represent the traditional Holter monitor and digitally record three or more electrocardiographic channels for 24 to 48 hours. Computers scan the recording media, with human oversight, to provide a report with snapshot recordings of symptomatic events and other important findings (asymptomatic arrhythmias, ST-segment changes). All systems can potentially record more information than the physician needs or can assimilate. As long as the system detects important episodes of ectopic activity, VT, or asystolic intervals and semiquantitates these abnormalities, the physician probably receives all the clinical information that is needed. Twenty-five percent to 50% of patients experience a complaint during a 24-hour recording; in 2% to 15% the complaint is caused by an arrhythmia (Fig. 34-6). The ability to correlate symptoms temporally with abnormalities on the ECG is one of the strengths of this technique.
Significant rhythm disturbances are uncommon in healthy young persons. Sinus bradycardia with heart rates of 35 to 40 beats/min, sinus arrhythmia with pauses exceeding 3 seconds, sinoatrial exit block, type I (Wenckebach) second-degree AV block (often during sleep), wandering atrial pacemaker, junctional escape complexes, and premature atrial complexes and PVCs can be observed and are not necessarily abnormal. Frequent and complex atrial and ventricular rhythm disturbances are less commonly observed, however, and type II second-degree AV conduction disturbances (see Chapter 37) are not recorded in normal patients. Elderly patients (see Chapter 76) have a higher prevalence of arrhythmias, some of which may be responsible for neurologic symptoms (Fig. 34-7; also see Chapter 87). The long-term prognosis in asymptomatic healthy subjects with frequent and complex PVCs usually resembles that of the healthy U.S. population, without an increased risk for death. However, frequent PVCs (>15% of the total) have recently been shown to produce cardiomyopathy and heart failure in some people, which can be reversed following elimination of the PVCs.
Most patients with ischemic heart disease, particularly after myocardial infarction (see Chapters 51 and 52), exhibit PVCs when they are monitored for 24 hours. The frequency of PVCs progressively increases during the first several weeks and then decreases at about 6 months after infarction. Frequent and complex PVCs are associated with a twofold to fivefold increased risk for cardiac or sudden death in patients after myocardial infarction, but treating these PVCs may not improve the prognosis. CAST (Cardiac Arrhythmia Suppression Trial) showed that PVCs identified patients at increased risk for sudden death but that successful suppression of PVCs with flecainide, encainide, or moricizine was associated with increased mortality in comparison to placebo. Recent data indicate that ablation of PVCs after myocardial infarction may improve previously depressed ventricular function.
Long-term recording of the ECG has also exposed potentially serious arrhythmias and complex ventricular ectopy in patients with left ventricular hypertrophy, as well as in those with hypertrophic, dilated, and ischemic cardiomyopathy; in those with mitral valve prolapse (see Chapter 63); in those with otherwise unexplained syncope (see Chapter 40) or transient vague cerebrovascular symptoms; and in those with conduction disturbances, sinus node dysfunction, bradycardia-tachycardia syndrome, Wolff-Parkinson-White syndrome (see Chapter 37), and pacemaker malfunction (see Chapter 36). It has been shown that asymptomatic AF occurs far more often than symptomatic episodes in patients with AF.
Variations of Holter recording have been used for particular applications. Some monitoring systems are able to reconstruct a full 12-lead ECG from a 7-electrode recording system. This is especially useful in trying to document the electrocardiographic morphology of VT before an ablation procedure or a consistent morphology of PVCs that may arise from an ablatable focus of VT or VF. Most Holter recording and analysis systems can place a clearly recognizable deflection on the recording when a pacemaker stimulus is detected. This greatly facilitates diagnosis of potential pacemaker malfunction. On occasion, artifacts on the ECG caused by alterations in tape recording or playback speed can mimic bradycardias or tachycardias and lead to erroneous therapy. Newer digital Holter systems are less subject to this phenomenon. Finally, most systems can also provide heart rate variability and QT data (see later). Use of these systems for detection of myocardial ischemia (ST-segment analysis) has yielded mixed results (in both specificity and sensitivity).
Event Recording
In many patients, the 24- or 48-hour snapshot provided by the Holter recording is incapable of documenting the cause of the patient’s symptoms. Longer-term monitoring, such as with an event recorder, is necessary in these cases, which occur frequently. These devices are about the size of a pager and are kept by the patient for 30 days. During that time, digital recordings can be made during symptomatic episodes and be transmitted to a receiving station over standard telephone lines at the patient’s convenience (see Fig. 34-7). Some of these recorders store more than 30 seconds of the ECG before the patient activates the recording. These loop recorders record continuously, but only a small window of time is present in memory at any moment; when the event button is pressed by the patient, the current window is frozen while the device continues recording for another 30 to 60 seconds, depending on how it is configured. Event recorders are highly effective in documenting infrequent events, but the quality of the recordings is more subject to motion artifact than with Holter recorders, and usually only one channel can be recorded. With some systems the patient must be able to press the event button to begin recording; if syncope occurs without warning and the patient is not able to actuate the device, it cannot provide diagnostic information. With other systems, the device automatically begins recording the rhythm when the heart rate increases or decreases outside preset parameters. Some systems incorporate cell phone technology that automatically notifies a central monitoring facility when certain conditions are met (e.g., extreme bradycardia or tachycardia). In this way the time between occurrence and effective treatment of serious arrhythmias can be significantly shortened.6
Most currently available pacemakers and implantable defibrillators are capable of providing Holter-like data when premature beats or tachycardia episodes occur and can store electrograms of these events from the implanted leads.7 The device can then be interrogated and the electrograms printed for analysis. Many implanted device systems incorporate remote monitoring so that if symptoms develop, patients can perform device interrogation at home; the information is then transmitted via the Internet to the physician’s office and thus enables more prompt diagnosis and treatment than if the patient had to schedule an outpatient visit.
Implantable Loop Recorder
For patients with very infrequent symptoms, neither Holter recorders nor 30-day event recorders may yield diagnostic information. In such patients, an implantable loop recorder may be used. This device (about the size of a pack of chewing gum) is inserted under the skin at about the second rib on the left front aspect of the chest and is activated by passing a special magnet over the device. It is capable of recording up to 42 minutes of a single channel of the ECG that can be partitioned for one to seven episodes, with up to 20 minutes of the preactivation ECG being saved for subsequent downloading to a programming unit for analysis. Both P waves and QRS complexes can usually be identified. The device can be configured to store patient-activated episodes, automatically activated recordings (heart rate outside preset parameters), or a combination of these. In one report of patients with unexplained syncope, a diagnosis was ultimately made in 80% by long-term monitoring, in 26% of them after 18 months of monitoring.8
A variety of additional noninvasive tests have been developed primarily to assess the risk for arrhythmic death in different groups of patients; although each has some applicability, none has enjoyed widespread use because of suboptimal sensitivity and specificity. Several of these tests are discussed in the following sections.
T Wave Alternans
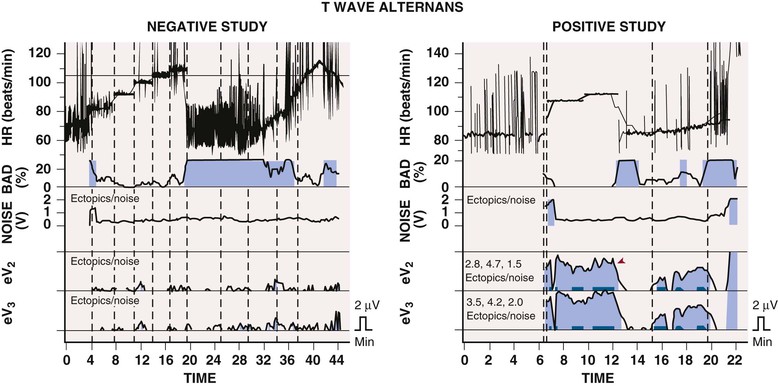
Beat-to-beat alternation in the amplitude or morphology of the electrocardiographic recording of ventricular repolarization, the ST segment and T wave, has been found in conditions favoring the development of ventricular tachyarrhythmias, such as ischemia and long-QT syndrome, and in patients with ventricular arrhythmias. The electrophysiologic basis appears to be the alternation of repolarization of ventricular myocytes. In the presence of a long QT interval, the cellular basis of alternation may be beat-to-beat repolarization changes in midmyocardial cells (so-called M cells). Whether this mechanism applies to different disease states is not known. T wave alternans testing requires exercise or atrial pacing to achieve a heart rate of 100 to 120 beats/min with relatively little atrial or ventricular ectopic activity. The test is less useful in patients with a wide QRS complex (>120 milliseconds). A positive T wave alternans test result (![]() Fig. e34-2) has been associated with a worse arrhythmic prognosis in various disorders, including ischemic heart disease and nonischemic cardiomyopathy. Although the predictive value of a positive test result varies greatly, depending on the population studied, a negative test result strongly predicts freedom from VT and VF in all group studied thus far, at least during a short follow-up period. Thus the test’s best application appears to be in patients whose arrhythmic risk is equivocal, in whom a negative T wave alternans test result suggests low risk for the development of life-threatening ventricular arrhythmias. T wave alternans testing alone has not helped segregate patients more likely to benefit from implantable cardioverter-defibrillator (ICD) use (positive test result) from those who are not (negative test result) and should therefore not undergo ICD implantation. Both frequency domain (spectral method) and time domain (modified moving average) analyses have usefulness in risk stratification. T wave alternans may represent a fundamental marker of an electrically unstable myocardium prone to the development of VT or VF, but because of its relatively minor incremental value in defining arrhythmic risk, it is not frequently used at present.14
Fig. e34-2) has been associated with a worse arrhythmic prognosis in various disorders, including ischemic heart disease and nonischemic cardiomyopathy. Although the predictive value of a positive test result varies greatly, depending on the population studied, a negative test result strongly predicts freedom from VT and VF in all group studied thus far, at least during a short follow-up period. Thus the test’s best application appears to be in patients whose arrhythmic risk is equivocal, in whom a negative T wave alternans test result suggests low risk for the development of life-threatening ventricular arrhythmias. T wave alternans testing alone has not helped segregate patients more likely to benefit from implantable cardioverter-defibrillator (ICD) use (positive test result) from those who are not (negative test result) and should therefore not undergo ICD implantation. Both frequency domain (spectral method) and time domain (modified moving average) analyses have usefulness in risk stratification. T wave alternans may represent a fundamental marker of an electrically unstable myocardium prone to the development of VT or VF, but because of its relatively minor incremental value in defining arrhythmic risk, it is not frequently used at present.14

Stay updated, free articles. Join our Telegram channel

Full access? Get Clinical Tree


