Although the beneficial effect of statins in secondary prevention of cardiac events is well established, their effectiveness in primary prevention is questionable when most evidence derives from randomized controlled trials and not “real-life” data. To evaluate the association between persistent use of statins and risk of acute nonfatal cardiovascular events in primary prevention patients in community settings, we retrospectively analyzed a cohort of 171,535 adults 45 to 75 years old with no indication of cardiovascular disease who began statin therapy from 1998 to 2009 in a large health maintenance organization in Israel. Persistence with statins was measured by the proportion of days covered with dispensed prescriptions of statins during the follow-up period. Main outcome measurements were occurrence of myocardial infarction or performance of a cardiac revascularization procedure. Incidence of acute cardiovascular events during the follow-up period (993,519 person-years) was 10.22 per 1,000 person-years. Persistence with statins was associated with a lower risk of incident cardiac events (p for trend <0.01). The most persistent users (covered with statins for ≥80% of their follow-up time) had a hazard ratio of 0.58 (95% confidence interval 0.55 to 0.62) compared to nonpersistent users (proportion of days covered <20%). Similar results were found when analyses were limited to patients with >5 years of follow-up. Treatment with high efficacy statins was associated with a lower risk of cardiac events. In conclusion, our large and unselected community-based study supports the results of randomized controlled trials regarding the beneficial effect of statins in the primary prevention of acute cardiac events.
Large meta-analyses of randomized controlled trials (RCT) addressing primary prevention in patients have provided substantial controversy about the effects of statin use on mortality and major cardiovascular disease (CVD) morbidity. Although the meta-analysis published by Ray et al found a borderline nonsignificant all-cause mortality risk decrease, meta-analyses by Brugts et al and Taylor et al found significantly decreased nonfatal coronary morbidity and all-cause mortality. However, the latter analyses were criticized for including some patients with prevalent CVD, thus overestimating the primary preventive effect of statins. Moreover, it has been suggested that the effectiveness of statins as measured in RCTs could be overestimated because of premature truncation, selective inclusion of high-risk patients, high level of patient care, and titration management. These may affect their generalizability to everyday practice. Population-based studies can tackle these limitations and quantify the true effect size of statins in “real-world” community practice with higher external validity. In light of this uncertainty and the limitations of RCTs we undertook our previous database study, which demonstrated a negative association between persistent use of statins and all-cause mortality. In the present study we aimed to evaluate the effect of statins on CVD morbidity in a large and diverse cohort of patients without pre-existing coronary heart disease (CHD).
Methods
All data were obtained from the computerized databases of Maccabi Healthcare Services (MHS), a 2 million-member health maintenance organization in Israel. These longitudinal databases and study cohort have been previously described. Briefly, electronic patient records of men and women 45 to 75 years old who had their first dispensed statins (index date) from 1998 to 2007 were screened for study eligibility. Patients with a history of CVD before the index date were excluded. To ensure capturing incident CHD events, patients who died, left MHS (switched to a different health maintenance organization or left the country, <2% of patients), or were diagnosed with the study end point before 1 year of follow-up were excluded from analysis (n = 21,200). Also excluded were patients who purchased an exceptionally large amount of statins that was >15% above the amount required for complete coverage (0.3% of eligible population).
Using the MHS computerized CVD registry we collected information on first diagnosis of CHD including acute myocardial infarction and vascular diseases such as ischemic heart disease, congestive heart failure, peripheral vascular disease, cerebrovascular disease, or atrial fibrillation. To better capture CHD morbidity we also obtained information on performance of the following cardiac procedures: coronary artery bypass grafting or percutaneous coronary intervention.
The primary end point of our study was the first occurrence of a major coronary event defined as a composite of myocardial infarction or revascularizations as reported from hospital charge records (percutaneous coronary intervention or coronary artery bypass grafting; Internation Classification of Diseases, Ninth Revision codes 36, 410 to 412,414, 429, v15.1, v45.81, v45.82, 36,411, 414, 429, 793, 794, and 996, Current Procedural Terminology codes 33,999, 33,510, 92,984, 92,982, and 92,980). We also conducted a sensitivity analysis considering a composite end point of the earlier of myocardial infarction, revascularization, or stroke (defined as cerebrovascular accident or transient ischemic attack, Internation Classification of Diseases, Ninth Revision codes v12.40, 342, 344, 362, 388, 433 to 436, 438, 997.02).
Last follow-up date of exposure was December 31, 2009, which also was used as the censorship date for the observed events.
Baseline characteristics were computed based on the year before the index date. We calculated statin persistence level with the proportion of days covered (PDC) by dividing the total prescription days of statins dispensed by the total interval from index date to disenrollment from MHS, death, or July 1, 2007, whichever occurred first.
PDC was categorized into 5 groups (<20%, 20% to 39%, 40% to 59%, 60% to 79%, ≥80%). Statin types and dosages at each purchase during follow-up time were converted to simvastatin 20-mg equivalent according to the World Health Organization daily defined dosage index (simvastatin 20 mg = pravastatin 20 mg = lovastatin 30 mg = fluvastatin 40 mg = atorvastatin 16 mg = cerivastatin 0.16 mg = rosuvastatin 6 mg = pitavastatin 1.6 mg). Cumulative doses purchased by each patient were divided by prescription days and in addition to the statin type were used to create an average efficacy per day of statin use. This efficacy was categorized into 3 groups (simvastatin equivalent <20, 20 to 39, ≥40 mg/day). Socioeconomic level was defined by the 1995 national census according to the poverty index of the member’s enumeration area, ranging between 1 (lowest) to 20 (highest). The poverty index was based on several parameters including household income, education, crowding, material conditions, and car ownership. Long-term co-morbid conditions were identified based on the MHS database including a registry of patients diagnosed with diabetes mellitus. Cancer diagnosis was based on the Israel National Registry of Cancer. The MHS database was used to elicit smoking history and body mass index levels (categorized into 3 groups). Median baseline level of plasma low-density lipoprotein cholesterol concentrations was categorized into 5 groups (<130, 130 to 159, 160 to 189, >190, missing). Median baseline level of increased plasma C-reactive protein levels was divided into 2 groups (<2 and ≥2 mg/dl).
Chi-square test for categorical variables and Kruskal–Wallis test for continuous variables were performed to determine significant differences in baseline characteristics between PDC levels. Event rates for different PDC groups were compared using Cox proportional-hazard regression model to adjust for length of follow-up. Hazard ratios (HRs) and 95% confidence intervals (CIs) were computed, controlling for potential confounders associated with increased risk of a cardiac event. The full multivariable model included efficacy of statin therapy and the following baseline values: age, gender, residential socioeconomic level, diabetes mellitus, hypertension, use of health services in the year before index date (number of visits to primary physician), and median baseline lipids levels. The variable of baseline triglyceride level was transformed with the natural logarithm owing to high skewness. The proportional hazard assumption was tested based on Schoenfeld residuals regressed on follow-up time. Trends of risk with PDC level were tested with chi-square trend test. We also used a multinomial logit propensity model with a method published by Rosenbaum and Rubin and extended to >2 groups by Imbens. All these variables were used in the propensity model except for statin efficacy. Using Cox proportional-hazard regression model, HRs and 95% CIs were computed controlling for propensity scores and statin efficacy. As an exploratory analysis, the Kaplan–Meier method was used to depict unadjusted survival rates, and log-rank test was used to test the statistical significance of the observed difference between the PDC groups. We performed a sensitivity analysis using cumulative incidence curves (deemed appropriate when competing risks are present) adjusting for death as a competing risk and performed the test of Gray to compare CVD event rates between PDC groups; however, results were very similar to the standard Kaplan–Meier estimates and thus not shown. All analyses were stratified by gender (instead of using it as a covariate) because of its interaction with several risk factors.
The study protocol was approved by the Assuta Health System’s institutional review board.
Results
In total 171,535 patients were eligible for analysis, of whom 4% (n = 6,234) were censored owing to death and 2% (n = 2,966) to leaving MHS before the end of the study period. Table 1 lists baseline characteristics in the year before the index date according to the level of PDC with statins. Persistent users (PDC with statins >80%) were more likely to be older, reside in areas of higher socioeconomic level, more likely to have long-term conditions, and visited their primary physician more often. Incidence density rates by gender and persistence with statins are listed in Table 2 . During a mean follow up of 5.79 years there were 10,159 nonfatal CHD events (3,379 of which were myocardial infarctions), with a mean incidence density rate of 10.22 per 1,000 person-years, where the rate in men was 3 times higher than in women.
| PDC With Statins | Total (n = 171,535) | p Value | |||||
|---|---|---|---|---|---|---|---|
| <20% | 20%–39% | 40%–59% | 60%–79% | ≥80% | |||
| (n = 42,017, 25%) | (n = 23,554, 14%) | (n = 25,883, 15%) | (n = 31,756, 19%) | (n = 48,325, 28%) | |||
| Age (years), mean ± SD | 56.61 ± 7.95 | 57.06 ± 7.86 | 57.72 ± 7.90 | 58.05 ± 7.88 | 59.14 ± 7.83 | 57.82 ± 7.94 | <0.001 |
| Men | 18,928 (45.05%) | 9,766 (41.46%) | 10,400 (40.18%) | 13,067 (41.15%) | 20,438 (42.29%) | 72,599 (42.32%) | <0.001 |
| Socioeconomic level, mean ± SD ⁎ | 11.36 ± 4.45 | 11.30 ± 4.42 | 11.59 ± 4.49 | 12.02 ± 4.54 | 12.69 ± 4.56 | 11.88 ± 4.53 | <0.001 |
| Low-density lipoprotein cholesterol (mg/dl), mean ± SD | 157.81 ± 37.88 | 163.39 ± 37.37 | 164.20 ± 37.49 | 164.48 ± 36.73 | 161.79 ± 36.16 | 161.94 ± 37.14 | <0.001 |
| Missing data | 4,835 (11.65%) | 1,797 (7.75%) | 1,950 (7.71%) | 2,140 (6.95%) | 3,370 (6.6%) | 14,092 (8.2%) | |
| Co-morbid conditions | |||||||
| Obesity (body mass index >30 kg/cm 2 ) | 9,565 (22.76%) | 6,374 (27.06%) | 6,637 (25.64%) | 8,010 (25.22%) | 12,068 (24.97%) | 42,654 (24.87%) | <0.001 |
| Missing body mass index | 14,289 (34.01%) | 7,230 (30.7%) | 8,541 (33%) | 10,410 (32.78%) | 15,581 (32.24%) | 56,051 (32.68%) | <0.001 |
| Cancer | 1,596 (3.80%) | 893 (3.79%) | 1,014 (3.92%) | 1,410 (4.44%) | 2,719 (5.63%) | 7,632 (4.45%) | <0.001 |
| Diabetes mellitus | 5,887 (14.01%) | 4,762 (20.22%) | 5,265 (20.34%) | 6,618 (20.84%) | 11,136 (23.04%) | 33,668 (4.45%) | <0.001 |
| Hypertension | 17,890 (42.58%) | 11,763 (49.94%) | 12,844 (49.62%) | 15,723 (49.51%) | 25,661 (53.10%) | 83,881 (48.90%) | <0.001 |
| Number of hospitalizations | <0.001 | ||||||
| 0 | 38,332 (91.22%) | 21,541 (91.50%) | 23,810 (91.93%) | 29,261 (92.14%) | 44,333 (91.74%) | 157,277 (91.69%) | |
| 1 | 2,972 (7.08%) | 1,616 (6.80%) | 1,637 (6.42%) | 2,006 (6.33%) | 3,118 (6.44%) | 11,349 (6.62%) | |
| ≥2 | 713 (1.70%) | 397 (1.69%) | 436 (1.65%) | 489 (1.53%) | 874 (1.81%) | 2,909 (1.70%) | |
| Number of general practitioner visits | <0.001 | ||||||
| <7 | 26,652 (63.43%) | 14,026 (59.55%) | 14,702 (56.8%) | 17,727 (55.8%) | 24,282 (50.25%) | 97,389 (56.78%) | |
| 7–12 | 9,234 (21.98%) | 5,768 (24.49%) | 6,708 (25.92%) | 8,304 (26.15%) | 13,757 (28.47%) | 43,771 (25.52%) | |
| ≥13 | 6,131 (14.59%) | 3,760 (15.96%) | 4,473 (17.28%) | 5,725 (18.03%) | 10,286 (21.29%) | 30,375 (17.71%) | |
| Statin efficacy | <0.001 | ||||||
| Low | 15,751 (37.49%) | 21,117 (43.7%) | 8,057 (34.21%) | 9,842 (38.02%) | 13,115 (41.3%) | 67,882 (39.57%) | |
| Moderate | 21,372 (50.87%) | 23,268 (48.15%) | 12,709 (53.96%) | 13,185 (50.94%) | 15,653 (49.29%) | 86,187 (50.24%) | |
| High | 4,894 (11.65%) | 3,940 (8.15%) | 2,788 (11.84%) | 2,856 (11.03%) | 2,988 (9.41%) | 17,466 (10.18%) | |
| PDC With Statins | Follow-Up (years) | Person-Years at Risk ⁎ | Events | IDR † | |
|---|---|---|---|---|---|
| Mean ± SD | Median (range) | ||||
| Men | |||||
| <20% (n = 18,928) | 4.92 ± 2.67 | 4.37 (1–12) | 92,702 | 1,898 | 20.47 (19.55–21.4) |
| 20%–40% (n = 9,766) | 5.34 ± 2.88 | 4.88 (1–12) | 51,766 | 1,036 | 20.01 (18.79–21.23) |
| 40%–60% (n = 10,400) | 5.69 ± 2.99 | 5.19 (1–12) | 58,842 | 997 | 16.94 (15.89–18) |
| 60%–80% (n = 13,067) | 5.84 ± 3.02 | 5.38 (1–12) | 75,900 | 1,162 | 15.31 (14.43–16.19) |
| >80% (n = 20,438) | 5.91 ± 3.12 | 5.39 (1–12) | 120,361 | 1,881 | 15.63 (14.92–16.33) |
| Total (n = 72,599) | 5.53 ± 2.97 | 4.99 (1–12) | 401,031 | 6,974 | 17.39 (16.98–17.8) |
| Women | |||||
| <20% (n = 23,089) | 5.31 ± 2.78 | 4.8 (1–12) | 122,283 | 702 | 5.74 (5.32–6.17) |
| 20%–40% (n = 13,788) | 5.81 ± 2.99 | 5.3 (1–12) | 79,723 | 518 | 6.50 (5.94–7.06) |
| 40%–60% (n = 15,483) | 6.23 ± 3.05 | 5.81 (1–12) | 96,109 | 514 | 5.35 (4.89–5.81) |
| 60%–80% (n = 18,689) | 6.33 ± 3.06 | 5.89 (1–12) | 117,846 | 545 | 4.62 (4.24–5.01) |
| >80% (n = 27,887) | 6.26 ± 3.12 | 5.76 (1–12) | 174,338 | 906 | 5.20 (4.86–5.54) |
| Total (n = 98,936) | 5.98 ± 3.03 | 5.49 (1–12) | 591,758 | 3,185 | 5.38 (5.2–5.57) |
⁎ Excluding first year of follow-up.
† The p values for trend of incidence density rate according to category of proportion of follow-up days covered are 0.02 and 0.21 in men and women, respectively.
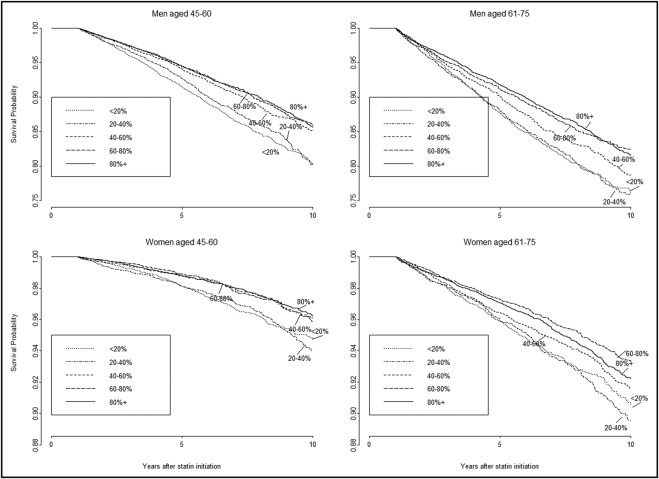
Figure 1 depicts unadjusted Kaplan–Meier survival curves according to 5 PDC categories stratified by gender and 2 age groups. In all panels, persistent users had a favorable survival compared to nonpersistent users. On average, persistent users had a 22.72% (95% CI 22.30 to 23.10) lower probability of an event within 10 years compared to nonpersistent users. Results of Cox proportional-hazards multivariable analysis for survival are presented in Table 3 . After adjustment for covariates there was a significant decrease in events with each increasing PDC category (p for trend = 0.006 for women and 0.003 for men). High efficacy statins were associated with a decreased risk of cardiac events (HR 0.67, 95% CI 0.61 to 0.73, for high vs low efficacy). Adjustment for propensity scores derived for the 5 categories of PDC produced similar results ( Table 3 ). Another analysis was performed within a single specific type and dosage of statins (simvastatin 20 mg initially used by 42% of the cohort) with a significant similar effect of PDC on risk of cardiac events (HR 0.56, 95% CI 0.51 to 0.62 for PDC ≥80% vs <20%).
| Women | Men | |||
|---|---|---|---|---|
| (n = 98,936, 58%) | (n = 72,599, 42%) | |||
| HR (95% CI) | p Value | HR (95% CI) | p Value | |
| Explicit multivariable model | ||||
| Age per 1 year | 1.05 (1.04–1.05) | <0.001 | 1.03 (1.02–1.03) | <0.001 |
| General practitioner visits ⁎ | ||||
| <7 | 1 (reference) | 1 (reference) | ||
| 7–12 | 0.99 (0.90–1.09) | 0.894 | 1.09 (1.02–1.16) | 0.012 |
| ≥13 | 1.24 (1.13–1.37) | <0.001 | 1.14 (1.05–1.23) | 0.001 |
| Hospitalizations ⁎ | ||||
| 0 | 1 (reference) | 1 (reference) | ||
| 1 | 1.17 (1.02–1.34) | 0.029 | 1.22 (1.11–1.34) | <0.001 |
| ≥2 | 1.30 (1.03–1.65) | 0.028 | 1.18 (0.99–1.41) | 0.067 |
| Diabetes | ||||
| Yes vs no | 2.19 (2.00–2.39) | <0.001 | 1.49 (1.40–1.59) | <0.001 |
| Hypertension | ||||
| Yes vs no | 1.28 (1.18–1.39) | <0.001 | 1.19 (1.13–1.26) | <0.001 |
| Body mass index (kg/m 2 ) | ||||
| <30 | 1 (reference) | 1 (reference) | ||
| ≥30 | 1.15 (1.00–1.31) | 0.043 | 1.08 (1.00–1.18) | 0.060 |
| Unknown | 1.13 (1.01–1.25) | 0.028 | 0.95 (0.89–1.01) | 0.079 |
| Natural log-transformed triglycerides (mg/dl) | 1.46 (1.32–1.60) | <0.001 | 1.25 (1.18–1.32) | <0.001 |
| Low-density lipoprotein (mg/dl) | ||||
| <130 | 1 (reference) | 1 (reference) | ||
| 130–159 | 1.01 (0.89–1.14) | 0.880 | 1.12 (1.04–1.22) | 0.004 |
| 160–189 | 1.12 (0.99–1.27) | 0.067 | 1.27 (1.17–1.37) | <0.001 |
| ≥190 | 1.58 (1.39–1.80) | <0.001 | 1.48 (1.35–1.62) | <0.001 |
| Missing | 2.08 (1.07–4.04) | 0.030 | 1.50 (0.87–2.60) | 0.145 |
| High-density lipoprotein | ||||
| Low vs high † | 1.40 (1.29–1.53) | <0.001 | 1.30 (1.22–1.38) | <0.001 |
| Smoker | ||||
| Never | 1 (reference) | 1 (reference) | ||
| Ever | 1.36 (1.20–1.55) | <0.001 | 1.19 (1.11–1.27) | <0.001 |
| Unknown | 1.08 (0.97–1.21) | 0.149 | 1.00 (0.92–1.09) | 0.916 |
| Statin efficacy | ||||
| Low | 1 (reference) | 1 (reference) | ||
| Moderate | 0.80 (0.74–0.87) | <0.001 | 0.78 (0.74–0.83) | <0.001 |
| High | 0.62 (0.52–0.74) | <0.001 | 0.62 (0.55–0.69) | <0.001 |
| Proportion of follow-up days covered with statins | ||||
| <20% | 1 (reference) | 1 (reference) | ||
| 20%–40% | 0.90 (0.79–1.02) | 0.091 | 0.89 (0.82–0.97) | 0.010 |
| 40%–60% | 0.70 (0.62–0.79) | <0.001 | 0.71 (0.65–0.77) | <0.001 |
| 60%–80% | 0.57 (0.50–0.64) | <0.001 | 0.59 (0.54–0.64) | <0.001 |
| >80% | 0.58 (0.51–0.64) | <0.001 | 0.59 (0.55–0.64) | <0.001 |
| Propensity score adjusted model ‡ | ||||
| Statin efficacy | ||||
| Low | 1 (reference) | 1 (reference) | ||
| Moderate | 0.86 (0.75–0.98) | 0.019 | 0.80 (0.74–0.87) | <0.001 |
| High | 0.67 (0.59–0.77) | <0.001 | 0.60 (0.55–0.65) | <0.001 |
| Proportion of days covered with statins | ||||
| <20% | 1 (reference) | 1 (reference) | ||
| 20%–40% | 0.93 (0.82–1.05) | 0.237 | 0.95 (0.87–1.03) | 0.182 |
| 40%–60% | 0.71 (0.63–0.80) | <0.001 | 0.75 (0.69–0.81) | <0.001 |
| 60%–80% | 0.57 (0.51–0.65) | <0.001 | 0.64 (0.59–0.69) | <0.001 |
| >80% | 0.59 (0.53–0.66) | <0.001 | 0.60 (0.56–0.64) | <0.001 |
Stay updated, free articles. Join our Telegram channel

Full access? Get Clinical Tree


