Computed Tomography of the Lungs, Pleura, and Chest Wall
Jenny K. Hoang
Lacey Washington
Wallace T. Miller Jr.
Computed tomography (CT) is now firmly established as an indispensable radiologic modality for the evaluation of the chest. The advantages of CT over plain radiography include resolution of smaller differences in density and the provision of greater anatomic detail as well as visualization of structures without superimposition. CT may be used for the detection of abnormalities in the mediastinum, lungs, pleura, and chest wall and in many cases is helpful for further characterization of processes seen in the mediastinum, lungs, and pleura on plain chest radiographs.
Indications for Computed Tomography of the Chest
Thoracic CT is, with the possible, controversial exception of lung cancer screening, not a screening procedure. The high radiation dose of CT when compared with chest radiography should limit its use to patients in whom a specific clinical question must be addressed. Additionally, although an institution may have a standard CT protocol, multiple operator-dependent variables must be selected on each CT examination in order to optimize the information acquired in light of the particular clinical question posed. Variables that must be addressed include slice thickness, slice spacing, field of view, and reconstruction algorithm as well as whether to give intravenous contrast and how to time its administration. Sometimes, a limited CT of the chest may be performed to address a specific, localized problem (most commonly, to evaluate for stability of a previously seen nodule). For all of these reasons, it is important that adequate clinical information be provided with requests for CT of the chest.
There are multiple long-accepted indications for chest CT and a variety of indications that are more experimental or are gaining acceptance. Many common indications for CT of the chest are reviewed in the American College of Radiology (ACR) Appropriateness Criteria. A summary of common lung, pleural, and chest wall indications for CT of the chest is found in Table 10-1. Mediastinal abnormalities are discussed in Chapter 168.
Techniques
Computed Tomography Acquisition
A CT image is acquired using the same physical principles as plain radiography: the passage of x-rays through tissue, allowing the detection of differences in “density” or attenuation of x-ray beams caused by different atomic numbers. CT passes multiple, highly collimated x-ray beams at various angles through an anatomic plane. Detectors opposite the x-ray source register the radiation after being attenuated by the patient. The information acquired by detectors is then reconstructed with complex computer algorithms to create an image of the plane through which the beams have passed. This image is essentially a map of tissue densities. Density differences of only 0.5% can be recognized with CT, in contrast to the 10% density differences required for visualization on plain radiographs.11
From the early sequential CT scanners, which acquired one slice of data at a time and were too slow for breath-hold imaging, there have been massive improvements in CT technology. In the late 1980s, “spiral” or “helical” scanners were developed whereby an x-ray tube emits a beam as it rotates around a continuously moving patient. A major advantage of the helical technique was that a contiguous data set was obtained and the entire chest could usually be imaged in one or two breath holds, reducing or eliminating the problem of “respiratory misregistration.”
Improvements in CT technology subsequently led to the development of multidetector CT (MDCT) scanners, a newer generation of helical scanner, characterized by multiple rows of detectors along the z-axis (longitudinal axis) allowing imaging of greater anatomic distances per exposure. The effect was faster scan time and ability to perform longer scan ranges without requiring time intervals for tube cooling. Faster scanning reduces motion artifact. This is particularly true in patients who are not able to maintain or cooperate with long breath holds, such as surgical or trauma patients, particularly those who are acutely ill. Longer scan ranges are particularly helpful in CT angiography, allowing coverage of larger body area with one contrast dose. Furthermore, thin-collimation technique, with a slice thickness as small as 0.5 mm, produces near isotropic imaging (i.e., the longitudinal resolution approximates the in-plane
resolution). In clinical practice, these features translate to improved resolution of smaller structures, including nodules and small pulmonary emboli,77,80 and the transformation of CT from a transaxial cross-sectional technique into a three-dimensional imaging modality that allows for arbitrary cut planes as well as excellent three-dimensional reconstructions of the data volume.
resolution). In clinical practice, these features translate to improved resolution of smaller structures, including nodules and small pulmonary emboli,77,80 and the transformation of CT from a transaxial cross-sectional technique into a three-dimensional imaging modality that allows for arbitrary cut planes as well as excellent three-dimensional reconstructions of the data volume.
Table 10-1 Indications for Chest Computed Tomography to Evaluate the Lung, Pleura, and Chest Wall | ||||||||||||||||||||||||||||||||||||||
|---|---|---|---|---|---|---|---|---|---|---|---|---|---|---|---|---|---|---|---|---|---|---|---|---|---|---|---|---|---|---|---|---|---|---|---|---|---|---|
| ||||||||||||||||||||||||||||||||||||||
CT dual- or split-detector systems have been available since the early 1990s; systems with four active detector arrays were introduced in 1998; and systems with 8, 10, 16, 32, or more active detector arrays became available early in the new millennium.71 The 64-slice CT systems introduced in 2004 allow even faster scan times, greater scan coverage, and thinner slices. The advantage is primarily for cardiac and vascular imaging, for which motion
artifact and time constraints related to the contrast bolus are important.
artifact and time constraints related to the contrast bolus are important.
Future Directions in Image Acquisition
CT technology is an ongoing area of development; it is uncertain what direction that technology will take in the years to come. One area of current research is a flat-panel CT scanner, whose detector geometry would allow scanning of large longitudinal volumes—for example, the entire heart—without table movement. Another promising area of development is dual-source CT, which is now available for clinical applications. This is a scanner composed of two acquisition systems mounted onto the rotating gantry with angular offset of 90 degrees.17 The advantage of two tubes and two corresponding detectors acquiring images simultaneously has three applications. First, the combined power of two tubes can be used to scan larger patients, providing improved image quality. Acquisition of the data with differing tube energies can be used for postprocessing subtraction and further characterization of tissue densities. Finally, the advantage of improved temporal resolution is valuable to advances in cardiac imaging.
Image Reconstruction
Data acquired by the CT scanner are subsequently reconstructed into images for viewing. In the single-detector CT era, slice thickness was determined by the slice thickness at which data were acquired. In the MDCT era, the data acquisition determines the thinnest images that can be reconstructed, but images are now commonly reviewed as thicker axial slices, since these are sufficient for diagnosis in most instances and are less challenging to view and store than much larger numbers of thinner images. The slice thickness commonly used for viewing will vary by institution, with 5 mm being a common choice.
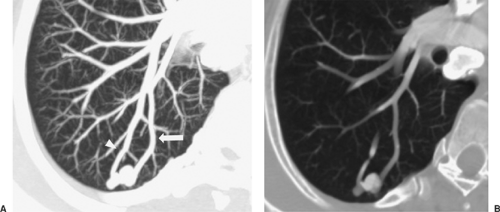
In some cases, multiplanar imaging can be performed to add confidence to interpretations and assist surgeons and bronchos- copists in planning procedures. In order to accomplish this, thinner slices of 0.5 to 1 mm are sent to a workstation for multiplanar and three-dimensional rendering manipulation by the radiologist or technician. Two-dimensional multiplanar reconstruction (MPR) is most commonly performed and simply involves changing the plane in which volumetric data are displayed, most commonly by creating images in the coronal or sagittal plane but also in various degrees of obliquity (Fig. 10-1). For objects that travel in and out of a two-dimensional plane—such as vessels—curved reformatted images (curved MPR) allow a structure to be traced and displayed as if it lay along a single axis. The main three-dimensional techniques currently available include maximum intensity projection (MIP), minimum intensity projection (MinIP), shaded surface display (SSD), and volume rendering (VR). MIP and MinIP are obtained by passing parallel rays through the volume data and displaying only the highest- or lowest-attenuation voxels, respectively. MinIP techniques show structures of lower density, such as cysts, emphysema, and air trapping (Fig. 10-1), while MIP techniques are superior for assessing vessels and micronodular disease of the lung (Fig. 10-2). SSD reformats the data around a threshold that defines the interface of tissues. It does not reveal internal detail and is mainly used for imaging the bony chest wall or the mucosal surface of the airways. VR is a three-dimensional weighted representation of all the densities of the chest, with depth information and various levels of opacity assigned to tissues of interest (Fig. 10-2). VR can be performed from an internal perspective, allowing the user to “fly through” hollow structures. This produces images similar to those obtained at bronchoscopy, which are seldom used in primary image interpretation but may be used as an adjunctive way of displaying information.
The calculated tissue densities are expressed on a scale of CT numbers or Hounsfield units, or HU (named after G. N. Hounsfield, the inventor of the original CT scanner). The scale is designed such that the CT number for air is -1,000 and the CT number for dense bone is +1,000, with water having a CT number of 0. On this scale, fat has a CT number of approximately -100. There is considerable variability in the Hounsfield unit measurements acquired, depending on scanner manufacturer and other technologic differences, so these numbers may vary somewhat and should be viewed as estimates.6
The wide range of density values detected by CT cannot be displayed on a single set of images; therefore multiple “windows” are used to display a single scan. In the chest, a set of “mediastinal windows,” with relatively high contrast, is used to demonstrate the narrow density differences in the mediastinum (between fat and soft tissue). Similarly, a set of “lung windows” is used to display the lung parenchyma, “bone windows” are examined to assess for osseous abnormalities, and an “angiographic window” should be used to evaluate pulmonary emboli. A “window” is specified by a “level,” or the density that is approximately average for the tissue being displayed, which will be displayed at a medium shade of gray, and a “width,” which determines the range of CT numbers that will be displayed in gray, between the values assigned to black and white. Different viewers and therefore different institutions will have different preferences for the exact levels and window widths at which images are displayed. Conventionally, CT images were printed on film and stored as hard copy. However, CT data are inherently digital and may be stored on a variety of electronic media. It is becoming increasingly common for radiology studies, including CT, to be stored on a picture archiving and communication system (PACS). Images that are stored electronically and recovered may be displayed in any window. These are commonly transferred among institutions on CDs, which usually contain both the processed CT image data and a program for displaying the data; they can then either be viewed on any computer or transferred into a new institution’s PACS and displayed using the PACS program.
Other CT Techniques
Electron-beam CT (EBCT) is a sequential (nonhelical) scanning technique based on an electron gun used to produce an x-ray beam from a tungsten target ring.17 It was originally advantageous because of the absence of moving parts, which reduces the scan time significantly compared with other CT scanners, but in a manner that causes other limitations. While images can be obtained very rapidly at a single level with EBCT, only 3 cm of longitudinal imaging can be acquired at a time. The technique causes artifacts related to scatter and has dose limitations that preclude imaging larger patients; it also involves an inefficient distribution of radiation dose. Because of all these issues, EBCT is now regarded as inadequate for general radiologic applications.
Intravenous Contrast Media
In planning a CT examination of the chest, one important consideration is whether intravenous contrast is to be administered. Iodinated contrast media increase the density within the vessels when given intravenously, allowing a distinction to be made between vessels and soft tissue. They also increase the density of any tissue in proportion to the blood supply to that tissue, thus allowing soft tissue structures that are otherwise the same density to be distinguished. This can be particularly striking when there is tissue necrosis, with an absent blood supply, contrasted with adjacent enhancing tissue. In evaluating mediastinal structures, intravenous contrast is not always necessary. It is frequently possible to distinguish between blood vessels and soft tissue structures such as enlarged lymph nodes by the expected position of the blood vessels and their continuous nature on multiple images. When assessment of the vessels themselves is indicated, particularly assessment of a vessel lumen for filling defects such as thrombi or webs, intravenous contrast is necessary.
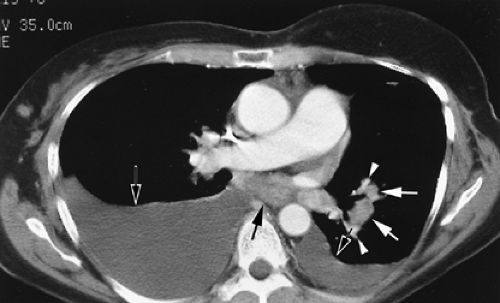
Evaluation of hilar structures, in contrast to mediastinal structures, depends more heavily on the use of intravenous contrast. Hilar lymph nodes can be very difficult to distinguish from blood vessels in the absence of intravenous contrast enhancement; it is therefore important to use intravenous contrast, if possible, in any patient in whom assessment for hilar lymphadenopathy or mass is important (Fig. 10-3).
Special uses of intravenous contrast include CT for pulmonary emboli and CT of pulmonary nodules. Pulmonary
emboli are seen as nonenhancing areas within otherwise enhanced vessels. Images are obtained with thin-section imaging during administration of intravenous contrast at high injection rates (4 to 6 mL/s), with various techniques used to optimize the timing of image acquisition so that the contrast densely enhances the vessels. Notably, for high contrast injection rates, large-bore intravenous cannulas in larger veins are required to optimize contrast enhancement and minimize complications of contrast extravasation. When intravenous contrast is used to evaluate a pulmonary nodule, serial images through the nodule are obtained over a time interval of about 5 minutes. The change in attenuation is measured over time.
emboli are seen as nonenhancing areas within otherwise enhanced vessels. Images are obtained with thin-section imaging during administration of intravenous contrast at high injection rates (4 to 6 mL/s), with various techniques used to optimize the timing of image acquisition so that the contrast densely enhances the vessels. Notably, for high contrast injection rates, large-bore intravenous cannulas in larger veins are required to optimize contrast enhancement and minimize complications of contrast extravasation. When intravenous contrast is used to evaluate a pulmonary nodule, serial images through the nodule are obtained over a time interval of about 5 minutes. The change in attenuation is measured over time.
High-Resolution Computed Tomography
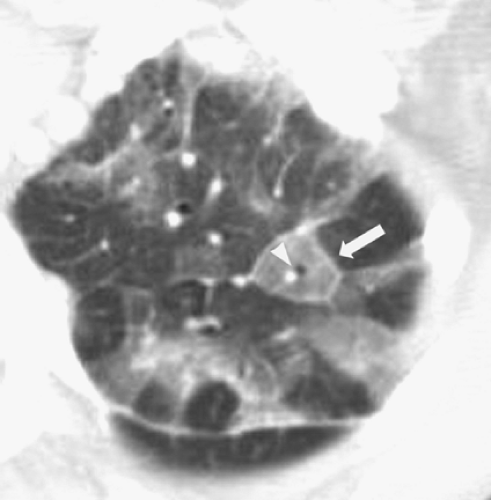
HRCT is most commonly described as a form of imaging of the lung developed to allow improved diagnostic accuracy, sensitivity, and specificity in the evaluation of interstitial lung disease, emphysema, and bronchiectasis. (The term may also, more broadly, be used for any thin-section imaging—for example, images obtained through a pulmonary nodule to evaluate for calcification or fat.) HRCT was originally developed to help address the weaknesses of the chest radiograph, which may be normal in up to 10% of patients with biopsy-proven lung disease and may give false-positive impressions of diffuse lung disease, particularly in obese patients.28 In contrast to conventional CT of sections 5 to 10 mm thick, HRCT consists of sections 1.0 or 1.5 mm thick. These are reconstructed with a high-spatial-frequency reconstruction algorithm, which distinguishes HRCT from CT with sections 1.0 to 1.5 mm thick often acquired during vascular imaging. The combination of thin-section images and the high-spatial-frequency reconstruction algorithm results in marked improvement in the spatial resolution of lung parenchyma.97 Visualization of the secondary pulmonary lobule (the functional unit of the lung made up of terminal bronchovascular structures and alveoli gathered within connective tissue septations carrying lymphatic drainage) is similar to macroscopic pathologic specimens (Fig. 10-4).
Continuous scanning throughout the lungs with such thin sections was once prohibitive in terms of dose to the patient, time of scanning, and tube current; therefore a protocol that acquires discontinuous slices has been adopted as common practice. Most often, sections 1.0 or 1.5 mm thick are obtained at 10-mm intervals through the lungs. Studies suggest that very few images are actually necessary in the detection of most diffuse lung diseases.37,47 However, the acquisition of noncontiguous sections means that large portions of the lung parenchyma are not imaged, so that small nodules can easily be missed. It also may be more difficult to distinguish small pulmonary vessels from nodules on HRCT because thin sections through vessels usually appear rounded, whereas thick sections may demonstrate more of the linear shape of the vessel. Therefore, many centers include standard larger-slice-width images with HRCT studies. Unlike single-detector imaging, MDCT can generate both the larger slice as well as the high-resolution thin slice widths required to evaluate for interstitial disease from a single scan of the thorax. It is not necessary to perform a second acquisition and, in clinical practice, retrospective HRCT reconstructions can frequently be performed at physician request if necessary. The ability to perform these depends on the parameters initially selected for acquisition of the scan and on the availability of the initially acquired raw data set, which is usually discarded after 24 to 48 hours because of the large amount of computer storage space it requires.
Inspiratory and expiratory scans are performed to assess for air trapping and mosaic pattern, whereas alternate prone and supine imaging can differentiate true disease from basal atelectasis. No intravenous contrast is administered with a dedicated HRCT; however, HRCT images are sometimes obtained in conjunction with another CT protocol, depending on the clinical setting.
Findings on Computed Tomography: Lung Parenchyma
Diseases involving the lung parenchyma may be divided into those that primarily involve the airspaces, such as bacterial pneumonias, and those that predominantly involve the interstitium. Diseases may also be divided by their morphology into those that are nodular or mass-like and those that are more infiltrative. The margins of any focal abnormality may be evaluated. Diseases may also be defined as focal, multifocal, or diffuse.
In the setting of airspace disease, CT provides little characterizing information but may be helpful in determining the extent and location of disease. CT may be helpful in evaluating the relationship of a given parenchymal abnormality to structures such as the bronchi, vessels, mediastinum, pleura, or chest wall. Localization of an abnormality may be useful in selecting an optimal approach for diagnostic bronchoscopy. HRCT is most helpful in characterizing diffuse lung disease and is particularly useful in limiting the differential diagnosis of interstitial lung diseases.
Pulmonary Nodules
A wide variety of pathologic conditions can present as a solitary pulmonary nodule or mass. According to the Fleischner Society glossary of terms for CT of the lungs,4 a pulmonary nodule is a rounded opacity at least moderately well marginated and 3 cm in maximum diameter. Opacities larger than this are referred to as masses. The differential diagnosis for any given focal lung nodule will depend in part on the clinical setting in which it is discovered as well as on its appearance.
If a nodule is discovered on radiography as part of a workup for metastatic disease, the first step in further evaluation should be a CT to identify additional nodules. If there are multiple nodules seen throughout both lungs at CT, the probability that the nodule represents metastatic disease increases, although biopsy is required for definitive diagnosis. CT is very sensitive for the detection of pulmonary nodules. However, in geographic areas endemic for histoplasmosis, granulomas or subpleural lymph nodes may constitute a large proportion of lung nodules, and these are indistinguishable from metastases unless they are calcified. In the series reported by Munden and associates,61 almost 40% of solitary pulmonary nodules <1 cm represented primary lung malignancy; however, in screening CT studies, this number has been consistently much smaller. For example, in the Mayo Clinic lung cancer screening trial,86 nearly 99% of nodules detected in smokers without an extrapulmonary primary malignancy were estimated to be benign. Other less common causes of nodules are hamartoma and carcinoid tumors.
Frequently, once a nodule is discovered, comparison with older films will show that the nodule was present in retrospect and is stable. It has been widely accepted, based on knowledge of tumor doubling times, that a nodule that remains stable for 2 years is benign. Most malignant pulmonary nodules have doubling times between 20 and 400 days.103 Nodules that double more quickly than this may be metastases but are usually infectious in nature, whereas those that have longer doubling times are usually benign. However, occasional lung carcinomas have much longer doubling times, and longer follow-up intervals may be necessary to detect the most indolent carcinomas.102,103
In the absence of prior imaging, attempts to differentiate nodules as benign versus malignant have relied on classifications focused on attenuation, morphology, and size. MDCT has added to the accuracy of nodule characterization. Contiguous thin-section (HRCT) images obtained through the nodule prevent partial-volume averaging of surrounding lung and more clearly demonstrate both the attenuation features and the morphology.
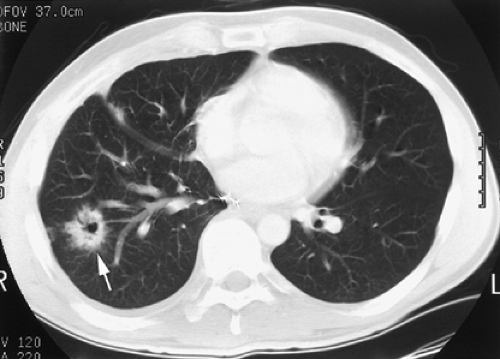 Figure 10-5. Cavitary lung carcinoma. A cavitary mass (arrow) in the right lower lobe with spiculated margins representing a lung carcinoma. |
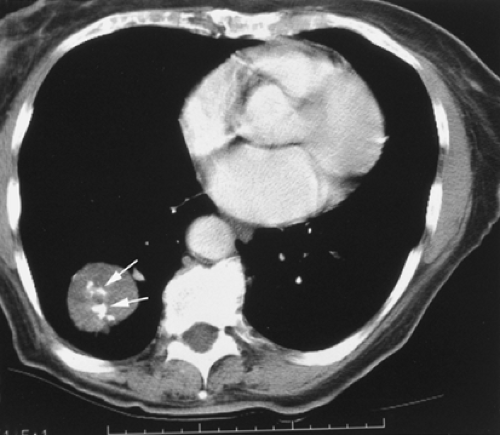
A nodule with spiculated margins suggests malignancy, with a high, about 90%, probability34 (Fig. 10-5). In a solitary nodule <3 cm in diameter, with smooth margins, it is helpful to evaluate for calcification. A nodule with central, popcorn-like, concentric rings or diffuse calcification may be confidently diagnosed as benign (Fig. 10-6). Eccentric calcification may be seen in some carcinomas; therefore, the presence of calcification alone does not specifically indicate a benign process. The presence of fat within a nodule is considered virtually diagnostic of benignity and specific for the diagnosis of a hamartoma.
Dynamic contrast enhancement for evaluating the malignant potential of nodules88 is not commonly used in practice since the advent of fluorodeoxyglucose positron emission tomography (FDG PET). However, this technique has been validated in a large multicenter trial and may be useful because of its high negative predictive value.10 In principle, nodules that enhance by ≤15 HU can be considered benign, with a sensitivity of 98%. As in the case of PET, active inflammatory lesions will yield a false-positive result so that the specificity of the technique with this threshold is considerably lower.
Occasionally, specific morphologic features allow for confident characterization of a solitary pulmonary nodule or mass based on a single CT examination alone. CT can diagnose arteriovenous malformations, even without contrast enhancement of vessels, based on the demonstration of a feeding arterial vessel and a large draining vein76 (Fig. 10-2). Administration of intravenous contrast, if performed, should demonstrate arterial-phase dense enhancement unless the malformation is thrombosed. Rounded atelectasis is an abnormality that occurs in lung adjacent to an area of pleural thickening, most commonly in patients with asbestos-related pleural disease but also in those with pleural thickening of other etiologies. The mass is rounded and abuts the pleura; bronchovascular markings in the adjacent lung appear to curl into it, creating a “comet-tail sign.”79
Other characteristic but less specific morphologic features include pseudocavitation and the halo sign. Pseudocavitation is a term used to describe small lucencies within a nodule, which have been shown to represent growth of tumor cells around alveolar walls, sparing expanded air-containing regions and dilated bronchioles. In addition to the presence of air bronchograms, these findings have been associated with the bronchioloalveolar subtype of adenocarcinoma.19,93,99 The halo sign is defined as ground-glass opacity surrounding the circumference of a nodule or mass, which correlates pathologically with pulmonary hemorrhage. Although first described in invasive aspergillosis,44 the halo sign has also been found with any cause of hemorrhagic nodules, such as hypervascular metastases and vasculitis and more rarely an inflammatory or tumor cell infiltrate.70
MDCT high-resolution sections have increased the frequency of findings of smaller, subtle nodules with ground-glass attenuation in their borders or internally, termed subsolid nodules. Ground-glass attenuation may also be associated with multiple benign etiologies, but the presence of ground-glass attenuation should increase suspicion for neoplastic precursors, adenocarcinoma, or bronchioloalveolar carcinoma, particularly when the solid component of the subsolid nodule is >50% of the lesion and follow-up CT shows a persistent lesion or an increase in size and density.45,65,68,89
In the era of MDCT, the detection of incidental nodules as small as 1 to 2 mm has become routine. The previous recommendations of CT follow-up for all noncalcified nodules over a 2-year period has been revised by the Fleischner Society.49 The current guidelines for an indeterminate nodule <8 mm are based on nodule size, patient age, and tumor risk factors.
Lung Cancer Screening
An understanding of the potential uses of CT in nodule evaluation is particularly helpful in light of the recent controversy over lung cancer screening. It is no surprise that CT is more sensitive than chest radiography for the detection of pulmonary nodules. CT might, therefore, in theory, be used to identify lung cancer at an earlier stage than chest radiographs, and its proponents hope that this earlier diagnosis will lead to improved survival (see Chapter 104).
A discussion of the difficulties with validating a screening examination is beyond the scope of this chapter. However, as has been seen with mammography, proving the value of a screening examination is more difficult than might be expected. There are multiple forms of bias that are introduced by the screening setting, which can lead to false apparent survival advantage. One important source of bias is called overdiagnosis. Overdiagnosis represents the identification of histologic “disease” that would never actually harm the patient. Sone et al.81 have identified the same rate of histologic lung cancer in their smoking and nonsmoking screened patients. Because many fewer nonsmoking patients die from lung cancer, it seems possible that this shows overdiagnosis bias—that is, that some of the identified histologic lung cancers are not truly lethal lesions.
A major difficulty with the use of CT for lung cancer screening is more obvious than subtle biases such as overdiagnosis. This is the high incidence of false-positive screening examinations; that is, the high number of patients with benign nodules. As the techniques used in these screening studies have improved (with work-station review and the use of MDCT to obtain thinner sections), the number of false-positive examinations has increased, even beyond the high numbers seen in early trials. For example, in the Mayo Clinic study,87 71% of patients were found to have pulmonary nodules over the course of 3 years, and a total of >2,800 noncalcified nodules were found in the 1,520 participants. Only 41 lung cancers were identified. Promoters of lung cancer screening initially touted the use of a low radiation dose, but full doses are used for follow-up scans. There is, therefore, clearly a significant radiation exposure to the majority of these patients, most of whom do not have lung cancer. In the Mayo Clinic trial, 20% of the operations that were performed were for benign disease; hence, the morbidity of unnecessary surgery must also be weighed in evaluating the utility of lung cancer screening.
There are large trials in progress that will attempt to address the utility of CT lung cancer screening; however, these will take 7 to 10 years to yield adequate results. In the short run, demand for lung cancer screening will undoubtedly continue, and such scans will probably remain available. It is therefore important to be aware of the very high rate of detection of benign lesions and the concomitant risks to the patient.
Bronchial Carcinoma
CT of the chest has become a routine part of preoperative staging for lung carcinoma, according to the recommendations of the International Staging System.58,59 Contrast-enhanced CT is performed at many centers to facilitate the detection of hilar and mediastinal lymph nodes and sometimes to better delineate the relationship of a centrally invading tumor to the aorta or pulmonary vessels. Patz et al.69 have suggested that the additional information resulting from contrast administration is minimal. Therefore, practices may vary in their use of contrast in this setting, some considering that the risks of intravenous contrast administration outweigh its benefits for these patients.
Stay updated, free articles. Join our Telegram channel

Full access? Get Clinical Tree


