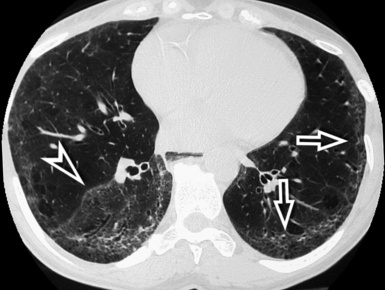
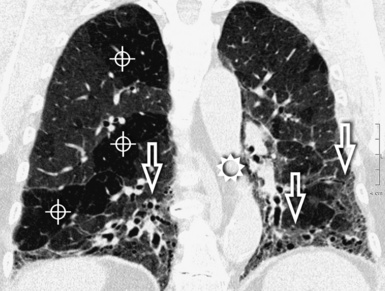
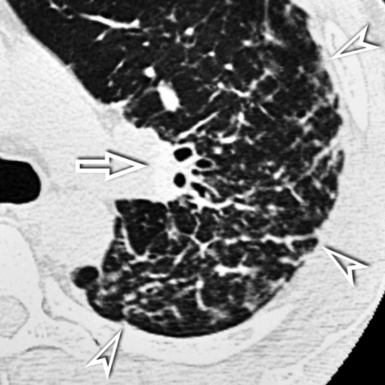
3 Computed Tomography of Diffuse Lung Diseases and Solitary Pulmonary Nodules
Foundations
Living with X-Rays and Working with Computed Tomography
X-Rays and Computed Tomography
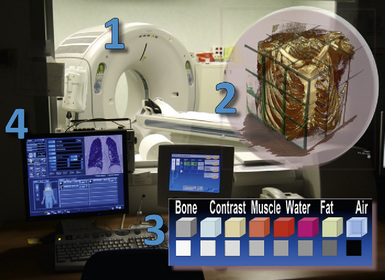
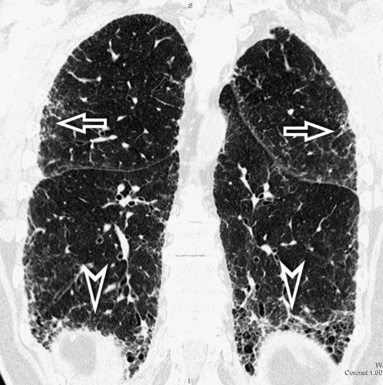
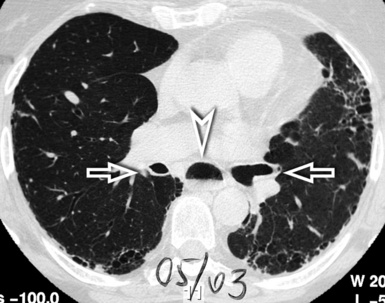
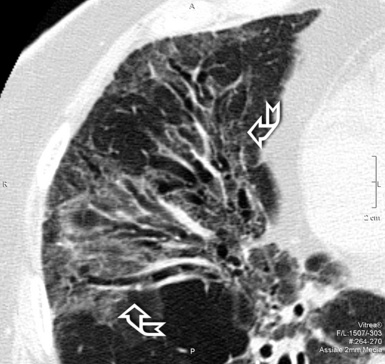
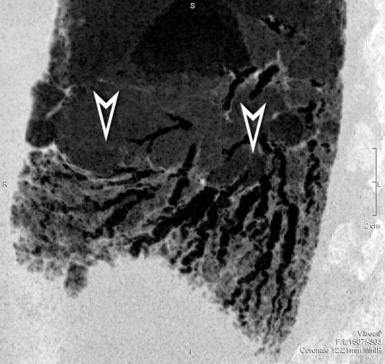
Radiology is the science of studying anatomy and pathology using x-rays—electromagnetic waves (like visible light, only with a much shorter wavelength) capable of penetrating the tissues. In computed tomography (CT), the widely recognized imaging standard of reference for assessment of most pulmonary abnormalities, a collimated fan beam of radiation is generated by an x-ray tube inside a gantry (Fig. 3-1).
The beam is quite homogeneous when entering the body (ingoing radiation) but, point by point, inhomogeneous when exiting (outgoing radiation) because of different attenuations produced by the tissues. The attenuation highly depends on the characteristics of the tissue, calcium being at the highest and air at the lowest end of a scale with soft tissue densities (e.g., organs, muscles, blood vessels, interstitium) and fat in between (see Fig. 3-1).
Always point by point, the outgoing radiation activates a matrix of tiny sensible elements (detectors) during a continuous spiral movement of the tube-detectors system around the body (scan), and the information acquired is stored in a computer. At the end of the process, the system contains a digital three-dimensional map of single unitary elements (voxels) composing the scanned volume (see Fig. 3-1).
Computed Tomography, Spiral Computed Tomography, and High-Resolution Computed Tomography
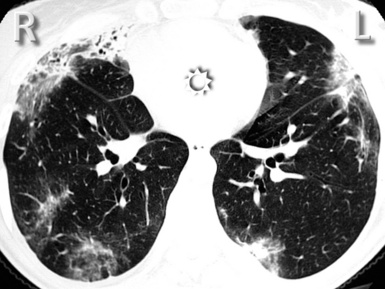
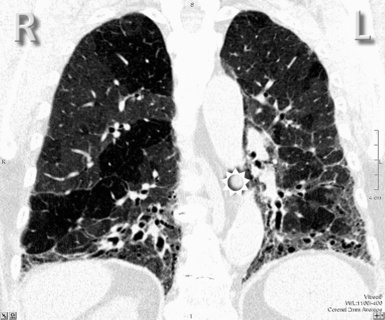
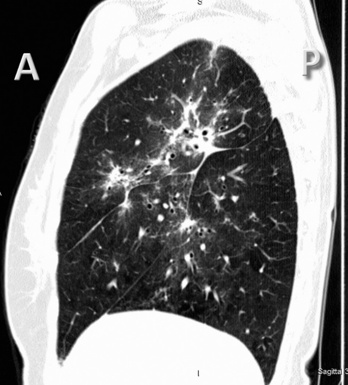
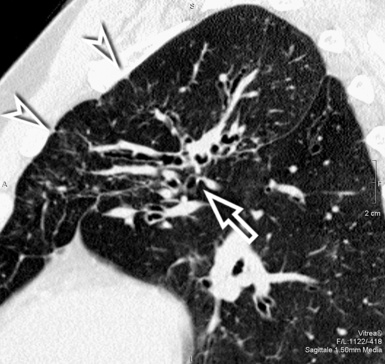
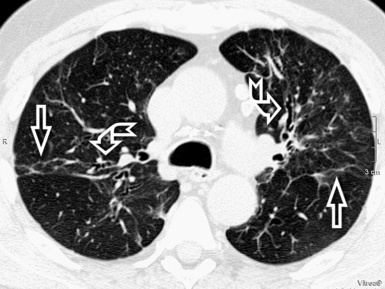
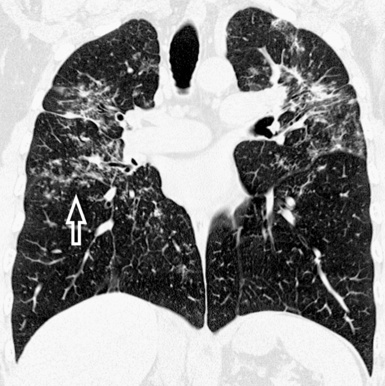
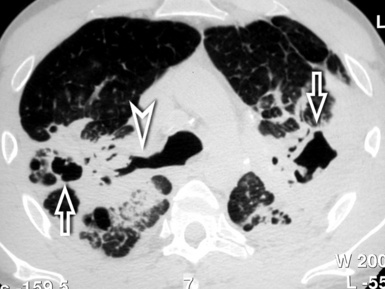
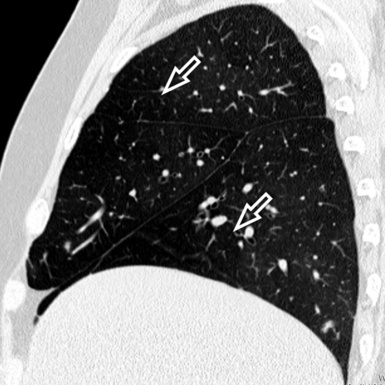
For viewing, CT is able to return the values of a two-dimensional matrix of voxels on a monitor over a scale of grays (gray-scale), where the brightest (white) spots represent the elements with higher attenuation and the darkest (black) the ones of lower attenuation. Although spiral CT is able to show images of equal quality along planes in any direction, the axial (transverse), frontal (coronal), and sagittal (lateral) views are used more commonly (Figs. 3-2 to 3-4). For each view, a stack of images may be seen in sequence simply by browsing at the workstation through the volumetric data set; at the end of the diagnostic process, the entire volume is investigated from multiple points of view.
With a diffuse lung disease (DLD), the high-resolution option is used. An actual collimation of 0.5 to 2 mm and a high spatial frequency reconstruction algorithm (edge enhancing) generate the final images.1 The narrow collimation reduces the voxel size, thereby minimizing the averaging of densities (attenuations) inside them, and this allows the rendering of subtle anatomical details (down to 0.1–0.2 mm in the most favorable conditions1). A limit is the noise of the image because of the reduced radiation penetrating such small voxels. However, at the pulmonary level, the difference of attenuation (contrast) between lung structures and air is high; thus, the signal is high, and the final signal-to-noise ratio remains adequate for diagnostic purposes.
Terminology
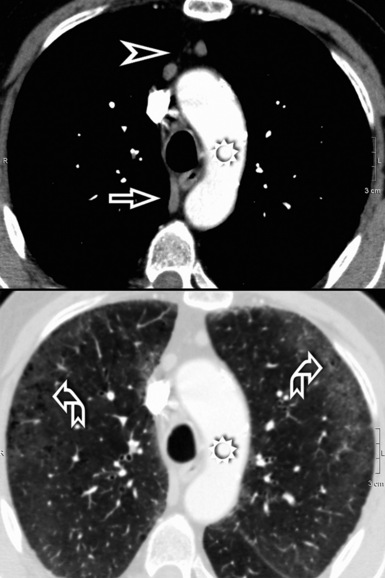
In general, the structures that attenuate more are whiter (thus, more opaque or dense or also hyperdense) than the structures that attenuate less (thus, more transparent or lucent or also hyperlucent). Therefore, the concept of density/opacity/attenuation of an element is a relative one, and for the object of interest it should be expressed in comparison with a reference structure, usually the surrounding background. The mediastinal vessels, for example, are denser than the fat in which they are embedded, but in turn this fat is denser than the tracheal lumen containing air (Fig. 3-5).
If a special iodinated substance (contrast medium) is injected intravenously before the examination, the visibility of the tissues is enhanced (contrast enhancement) because iodine is a powerful absorber of radiation (see Fig. 3-5). A contrast medium is used rarely in the studies performed for a suspected DLD but frequently when a mass or a vascular condition is under investigation.
The body structures are best observed on monitors or films where the brightness/contrast is optimized to bring out the details of the image. However, human eye limitations do not allow a real-time appreciation of these details over the entire dynamic range of chest attenuations. Fortunately, all pertinent data are available to the machine, and the operator needs only to press a button to switch, through a dedicated processing referred to as windowing and leveling, from a mediastinal window (where the details in the lung are squeezed down to the absolute blackness) to a lung window (where the soft tissues are leveled out but the lung structures stand out with maximal detail) (see Fig. 3-5).
Lung Anatomy
Arteries, Veins, and Bronchi
When examined using a lung window, the lungs appear as overall grayish structures delineated by the mediastinum and thoracic cage. Their shape depends on how they are cut by the plane of the section (see Figs. 3-2 to 3-4). The homogeneously whitish elements standing out over this background are blood vessels, which appear roundish or linear depending on the plane of section. Their size should be appropriate to their position within the lung (central versus peripheral) (Fig. 3-6). Each artery is joined by a companion airway, characterized longitudinally as a pair of tapering whitish lines separated by air, which branch regularly (“railway track” appearance). The airways appear as white rings when cut transversally (see Fig. 3-6). Actually, the visibility of bronchial structures within an aerated parenchyma is far below the visibility of companion vessels because of the mostly air-containing nature of the former. Consequently, when looking at a normal lung, the general feeling is of a predominance of blood vessels with only sporadic visibility of bronchioles within the outer third of the lungs.
The outer wall of the arteries and both the outer and inner surface of the bronchial walls should present a sharply defined interface with the surrounding parenchyma (Fig. 3-7). As a rule, bronchial walls in corresponding regions of both lungs should be similar in thickness. Moreover, coupled bronchi and arteries should present roughly the same diameter, and this in turn depends on their position (central or peripheral).1 The arteries tend to divide dichotomously, whereas the veins often present a monopodial branching with several smaller branches flowing into a main collection drain. Arteries and veins also have a different course that becomes almost perpendicular at the level of the vein entrance into the mediastinum and right heart (see Fig. 3-7).
Mediastinal and thoracic pleura are invisible when normal. However, they can appear as subtle tiny linear opacities at the fissural level, where two layers fuse radiologically (see Fig. 3-7). When normal, lymphatics are not visible at any level, their size being inadequate to be perceptible radiologically.
Secondary Lobule
At the periphery of the lung, after 28 generations of arteries and 23 generations of bronchi,2 arteries and bronchi become so small that they become invisible. As a consequence, the far peripheral pulmonary parenchyma should have no visible vessels, and the same and even more is true for the bronchi (see Figs. 3-6 and 3-7). Thus, the appreciation of vessels immediately below the pleural surface should point at an abnormality. However, exceptions are possible in the most dependent areas (Fig. 3-8), where the hydrostatic pressure is higher and the vessels larger.
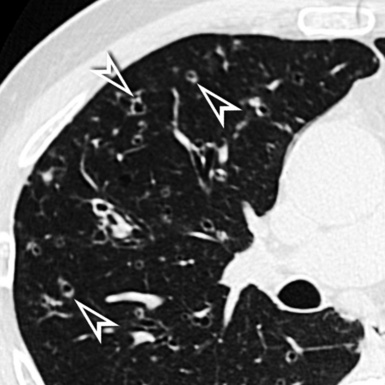
The centrilobular bronchioles, in particular, should not be visible, and also, when normal, the interstitial framework at the lobular level should not be appreciable per se. Consequently, when an intralobular network of white lines and/or the walls of bronchioles become visible, this means that they are thickened and hence abnormal. In general, under normal circumstances, the lobular architecture is discernible only here and there when fragments of centrilobular arteries and perilobular veins are identified; this is more frequent in the dependent portions of the lung (see Fig. 3-8).
Special Techniques
Increasing Visibility
Multiplanar Reformation
The high-resolution computed tomography (HRCT) technique has existed since the end of the 1970s, but it was the development of the spiral multislice scanning machines in the early years of the 21st century that allowed the generation of consistent high-quality images in every spatial plane in nearly every patient (MPR). The first and most popular way to render the data is called averaged because, pixel by pixel, the images show the average attenuation of the tissues across the plane of section. The natural high contrast of lung tissue and thin collimation of the x-ray beam, coupled with a high frequency algorithm of reconstruction, guarantee sharp details of anatomical and pathologic elements down to well less than 1 mm in size (see Fig. 3-8).
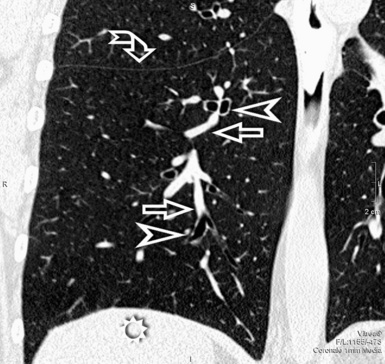
Pathology that occurs in the central or peripheral regions of the lung is best studied in axial images (see Fig. 3-2). Diseases that show upper or lower lung prevalence benefit from visualization in coronal view (see Fig. 3-3). Finally, disorders that prevail in the parahilar regions or in the costophrenic angles are best depicted in the sagittal view (see Fig. 3-4). With the volumetric approach, the planes may be varied according to the needs of the operator and targeted on the suspected disease (Box 3-1).
Curved Multiplanar Reformation
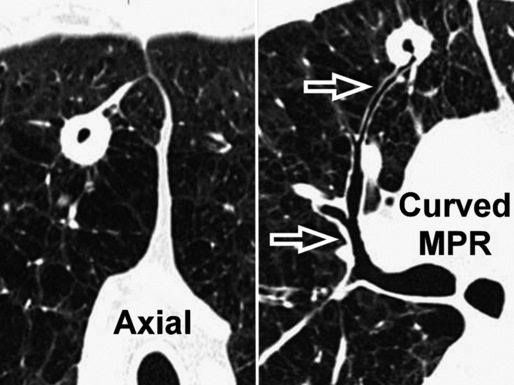
Having the entire volume available and working digitally makes it possible to reconstruct objects traveling in and out of a two-dimensional plane along curved reformatted images (curved MPR). This allows a structure to be traced and displayed as if it lay along a single plane. For example, an intuitive visualization of the entire course of a bronchus from a cavitated lesion to its origin can be achieved by displaying it along a manually or automatically generated centerline of the bronchial lumen (Fig. 3-9). The curved reformatted images are not real, but they are effective and easy to generate and therefore suitable for practical purposes (e.g., “virtual” bronchoscopy).
Increasing Ambience
Maximum Intensity Projection
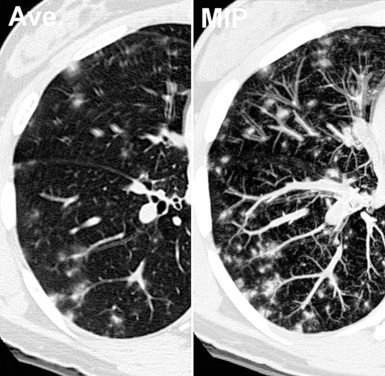
The maximum intensity projection (MIP) technique renders only the voxels with higher attenuation in a thick slice (0.5–2 cm). The technique is suitable to render tridimensionally the vascular tree standing against a black background; moreover, with MIP, it is possible to obtain a comprehensive representation of the position of various lesions inside the lobular framework3 (Fig. 3-10). In selected cases, MIP images are useful for distinguishing between vessels and nodules and, when nodules are present, to assess their profusion.
Minimum Intensity Projection
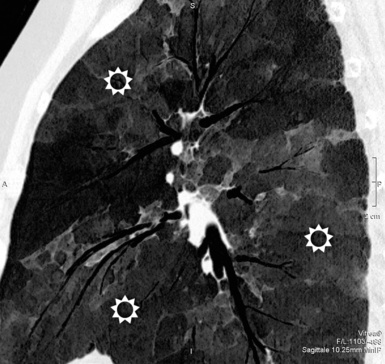
The minimum intensity projection (minIP) technique renders only the voxels with lower attenuation in a thick slice (0.5–2 cm). This technique is useful for improving the visualization of hyperlucent elements (bronchi, emphysema, bullae, honeycombing) and some opacities, allowing a more precise study of their attributes and distribution. The minIP technique is also ideal for investigating bronchial caliper and course, particularly within areas of increased density (Fig. 3-11).
Volume Rendering
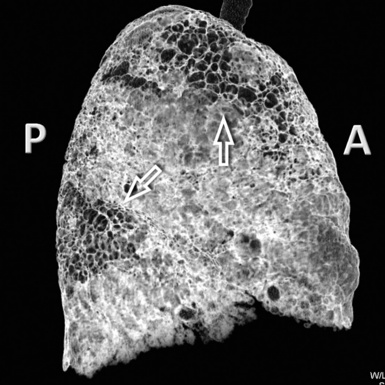
Volume rendering (VR) techniques may be also used in the assessment of DLD. When implemented, the machine renders only the structures within a specific range of attenuations and contained within a chosen volume. Volume rendering may be useful for studying a volume of lung in three dimensions from within or for inspecting its surface from outside (external volume rendering) (Fig. 3-12). This is particularly useful for concisely looking at the pulmonary surface and its abnormalities and for helping to make medical decisions (e.g., determining the site of a surgical biopsy).
Prone and Expiratory Computed Tomography
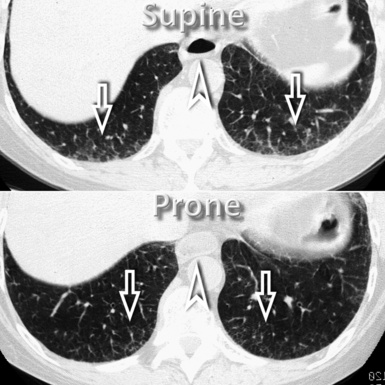
However, in supine patients, some whiter atelectatic lung is frequently seen in the most dependent posterior areas (see Fig. 3-8), where it may simulate pathology or, alternatively, hide it. These normal densities disappear with prone positioning (Fig. 3-13), and indeed some experts suggest the routine use of prone scans when diseases under consideration characteristically involve posterior lung (e.g., asbestosis).4
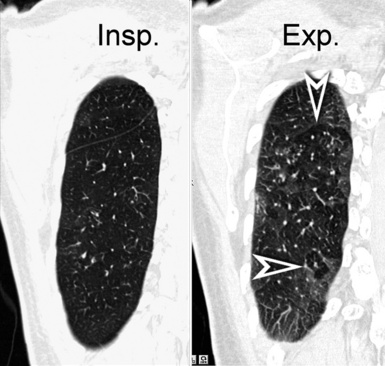
In normal subjects, an expiratory scan shows a uniform reduction in size of the lungs together with a homogeneous increase of their density, due to the reduced amount of air within the alveoli. When an arterial obstructive or a bronchial stenotic disease is present, variable portions of lung become darker than normal because of the reduced blood supply caused directly by hampered vascular filling or indirectly caused by hypoxemic vasoconstriction. However, in the expiratory CT, the hyperlucent areas due to vascular obstruction physiologically increase their density, whereas in the case of bronchial stenosis they do not because the air does not exit from the alveoli (air trapping) (Fig. 3-14). When arterial obstructive or bronchial stenotic diseases are suspected, supplementary expiratory scans should then be added to complete the investigative process.
Diffuse Lung Diseases
Patterns
There are some limitations when thinking in terms of patterns. First, the same disease may present with different radiologic patterns. This may result from its variable pathologic expression in a given patient (e.g., pulmonary manifestations of progressive systemic sclerosis may show histologic usual interstitial pneumonia [UIP], nonspecific interstitial pneumonia [NSIP], organizing pneumonia [OP], and even diffuse alveolar damage patterns), from its temporal phase (e.g., a hypersensitivity pneumonitis may present in the acute, subacute, or chronic stage) or from its natural progression (e.g., an NSIP may proceed from a minimal changes pattern to end-stage lung disease). Second, the same pattern may be present in several diseases (a classical model being the systemic collagen vascular diseases [CVDs]), and also this is not unexpected because the lung has a limited number of reactions to different insults. These caveats are not an absolute limit to the diagnostic approach using patterns, but they underscore the necessity of a tight integration of imaging with clinical presentation and pathology in arriving at a meaningful diagnosis for the patient, as widely recognized in the literature.5
Septal Pattern
Definition
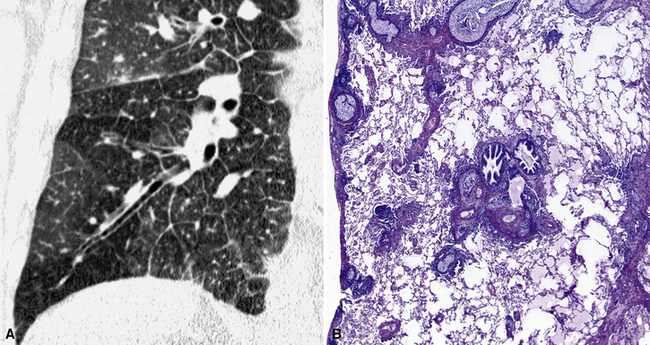
A septal pattern is present when a thickening of the perilobular interstitium is appreciable, making the lobular boundaries evident. The bronchovascular bundle is also usually thickened, producing changes both at the central parahilar level and in the centrilobular core (Fig. 3-15). The final effect is of that of a regular network of white lines with increased evidence of the perilobular interstitial architecture but without retraction or remodeling of pulmonary structures. For this reason, the septal pattern is also called regular linear pattern or linear pattern with preserved architecture.
High-Resolution Computed Tomography Signs
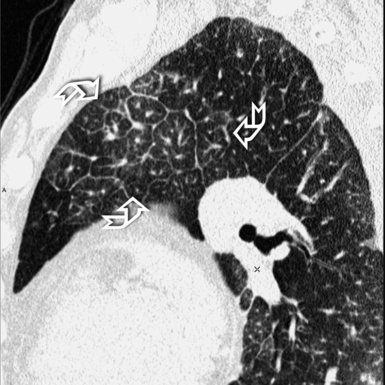
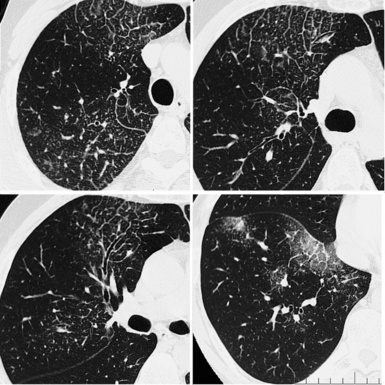
A network of white lines due to thickened septal, peribronchovascular, and subpleural interstitium is the trademark of this pattern. The thickened interlobular septa appear as white lines 1 to 2 cm in length outlining the polygonal boundaries of secondary lobules (interlobular or perilobular reticulation) (Fig. 3-16). Normally, these septa are not recognizable, so their presence points to an abnormality. A few lines inside the lobule may be also visible.2,6
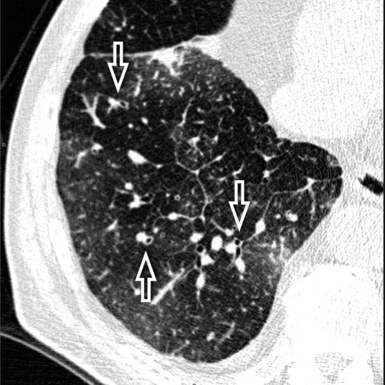
Centrilobular peribronchovascular thickening becomes manifest as a cuffing of the core structures of the lobule. The bronchiole, usually invisible under normal conditions, becomes evident as a white ring adjacent to a white dot of similar size (the centrilobular arteriole). It is enlarged compared with those identifiable in adjacent portions of pulmonary parenchyma (Fig. 3-17).
The thickened peribronchovascular bundle at a more central level is also perceived as arteries of increased size, compared with similar portions of pulmonary parenchyma, and as thickening of bronchial walls (Fig. 3-18). As a rule, vessel size and bronchial wall thickness in corresponding regions of one or both lungs should be similar, and a comparative evaluation of different lung regions is helpful and makes the recognition of the abnormalities easier.2
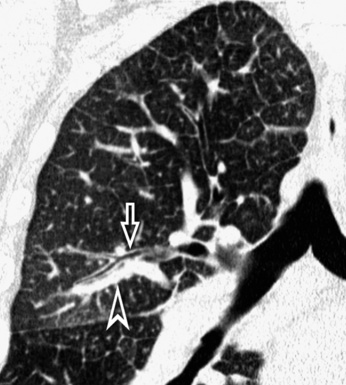
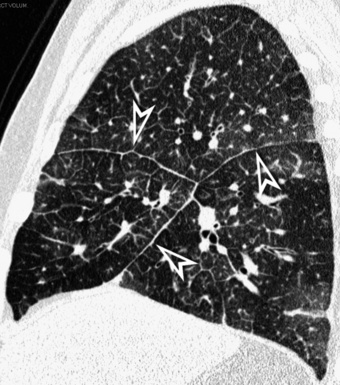
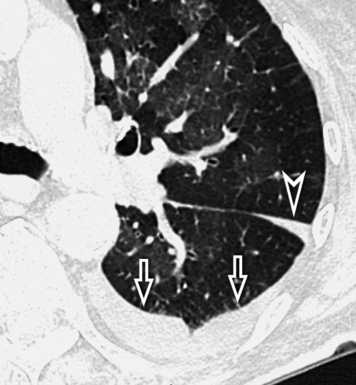
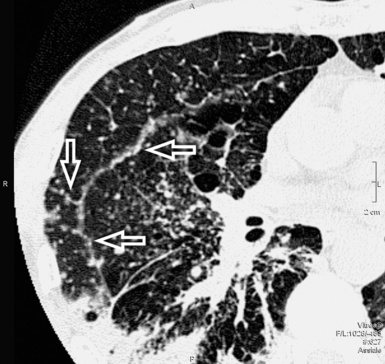
The subpleural interstitial thickening should be evaluated at the edges of the lung as a white enveloping line simulating thickened pleura. This sign is often easier to identify at the fissural level, where two layers of subpleural interstitium coexist7 (Fig. 3-19).
Pleural effusion may be an additional finding in some septal disorders. It can be small and may be seen along the costovertebral angles or fissures (Fig. 3-20), where large, significant compressive effects on the adjacent parenchyma may be present.
Subset Smooth
The anatomy of the three interstitial compartments (perilobular, peribronchovascular, and subpleural) is thickened more-or-less regularly with smooth profiles. The polygonal outlines of the lobules are visible without focal abnormalities. Their shape is variable, depending on the CT plane (Fig. 3-21).
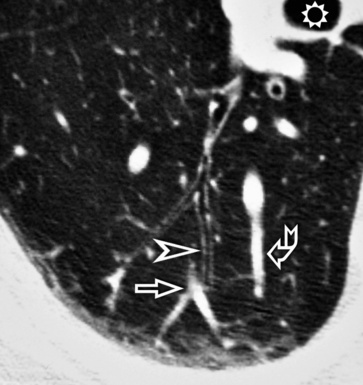
Inside the lobules, enlarged arteries and bronchioles with thickened walls are often visible. Smoothly thickened fissures are recognizable (Fig. 3-22), in particular with multiplanar reconstructions.8 Coexisting patches of faint opacities are possible, due to partial alveolar filling (ground glass opacity [GGO]). However, these patches should not overshadow the septal aspects; otherwise, an alveolar pattern should be considered.
Diseases in the Septal Pattern, subset Smooth, are listed in Box 3-2.
Interstitial Hydrostatic Pulmonary Edema
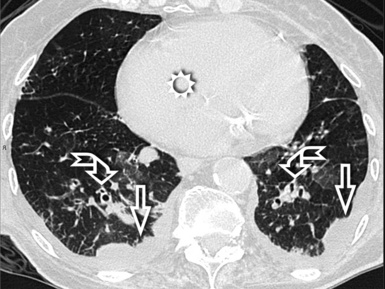
The septal lines of pulmonary edema are usually associated with smooth subpleural and peribronchovascular interstitial thickening (peribronchial cuffing). Patchy lobular GGO often coexists, due to minimal alveolar edema9 (Fig. 3-23). There is a tendency for the hydrostatic edema to show a symmetrical basal and posterior distribution (in supine patients) (Fig. 3-24), but patchy nongravitational distributions are not impossible.10
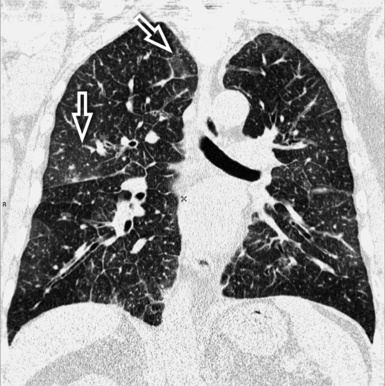
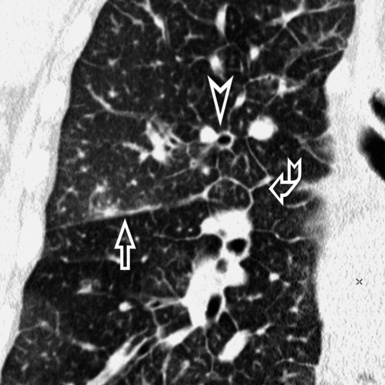
Figure 3-23 This coronal view shows bilateral smooth perilobular, peribronchovascular, and subpleural thickening in a patient with hydrostatic pulmonary edema (Fig. 3-22 is a close-up of this image). Areas of faint GGO are also present (arrows).
Heart enlargement and bilateral pleural effusion are common findings in cardiogenic pulmonary edema (see Fig. 3-24), and in a number of patients also a pericardial effusion may coexist. When the flow of the lymph to the systemic veins decreases, an enlargement of mediastinal lymph nodes due to fluid stagnation may occur11 (Fig. 3-25).
Lymphangitic Carcinomatosis
Lymphangitic carcinomatosis may present with a fully smooth subset12 (Fig. 3-26), but not infrequently nodular irregularities (beaded appearance of septa and fissures) and random micronodules in areas of thickening occur. Nodules result from focal growth of cells within the lymphatics and local extensions into the parenchyma.6,13 Subpleural thickening, when present, may also be smooth or nodular. Pleural effusion is unilateral in 50% of cases.
The lesions of lymphangitic carcinomatosis are typically patchy, often unilateral, and not gravity-dependent12 (Fig. 3-27). Hilar lymphadenopathy is visible in 50% of patients. Enlarged mediastinal lymph nodes can be also seen in a number of cases (25% to 50%).13 Dedicated CT window settings may demonstrate metastatic lesions elsewhere (Fig. 3-28).
Veno-occlusive Disease
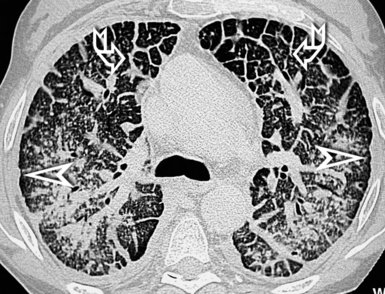
The presentation of veno-occlusive disease is similar to that of hydrostatic pulmonary edema. Smooth septal lines, bronchial cuffing, and patches of GGO related to alveolar wall thickening and pulmonary edema are apparent14,15 (Fig. 3-29).
The lesions present a geographical appearance with variable localization. They are always bilateral and may have a gravitational preference15 (Fig. 3-30).
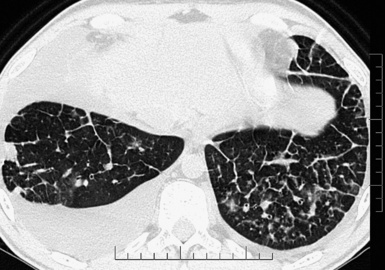
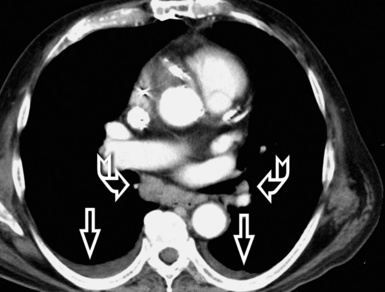
Figure 3-30 An axial scan of the same patient as in Figure 3-29 confirms the gravitational distribution of the lesions.
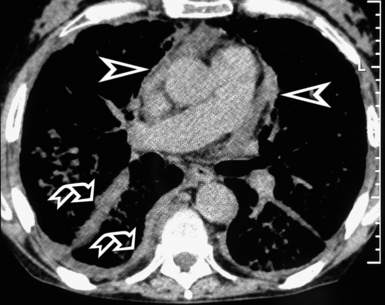
A key radiologic sign is a coexisting enlargement of the central pulmonary arteries compatible with arterial pulmonary hypertension16 (Fig. 3-31). The right side of the heart also may be dilated without evidence of left atrial or ventricular enlargement. In addition, pericardial or pleural effusion and enlargement of the mediastinal lymph nodes may be visible.14
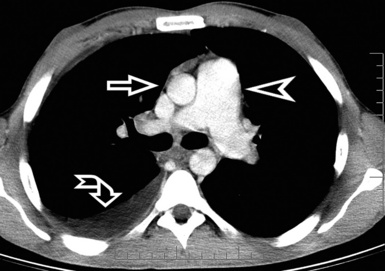
Figure 3-31 A contrast-enhanced axial scan (mediastinal window) of the same patient as in Figure 3-29 reveals a dilated central pulmonary artery (arrowhead) and a right pleural effusion (curved arrow). Compare the size of the main pulmonary artery with the diameter of the ascending aorta (arrow): they should be the same in a normal individual.
Erdheim-Chester Disease
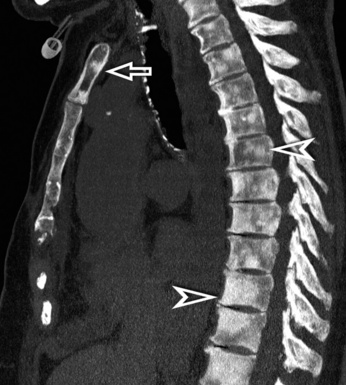
Erdheim-Chester disease is a non–Langerhans cell systemic histiocytosis that produces smooth septal and subpleural interstitial thickening, with more-or-less regular contours (Fig. 3-32). Multifocal areas of ground glass attenuation, small centrilobular nodular opacities, and pleural effusion may be also present.17,18
The septal lesions of Erdheim-Chester disease involve both lungs diffusely (Fig. 3-33), but in some cases they may predominate in the upper or lower lobes.18 In addition, the pleura and the mediastinal structures may be involved (Fig. 3-34). The superior vena cava, along with the pulmonary trunk and main arteries, may be “coated” by anomalous tissue, and in case of severe involvement, a reduction of the vascular lumen is also possible. The cardiac involvement may be endocardial or myocardial (not visible with HRCT) or pericardial, the latter being the most frequent and best visible on images, thanks to the contrast provided by the adjacent pericardial fat19 (see Fig. 3-34).
Subset Nodular
The interstitial compartments are thickened in nodular form, testifying to the existence of locally growing cells or extracellular deposits within the interstitial boundaries20 (Fig. 3-35). Being interstitial, these nodules are dense with well-defined margins2 (Fig. 3-36), embedded as they are inside thickened interlobular septa and interstitial lines with an overall beaded appearance.21
Lymphoid interstitial pneumonia is a multifaceted disease that may present with different patterns, including septal. However, it tends to show more often nodules along lymphatic routes, so it has been placed in the Nodular Pattern, subset Lymphatic. Diseases in the Septal Pattern, subset Nodular, are listed in Box 3-3.
Diffuse Interstitial Amyloidosis
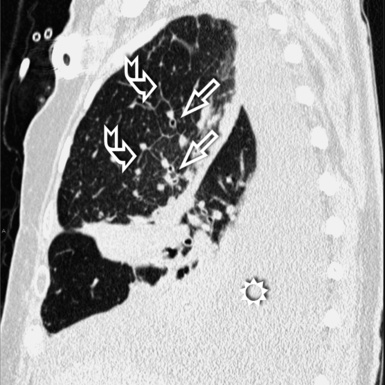
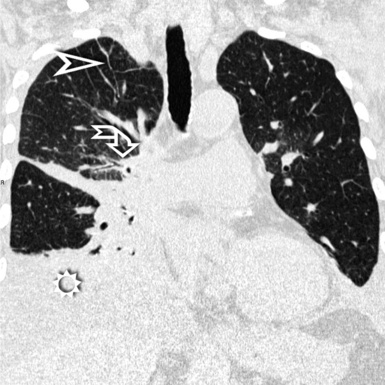
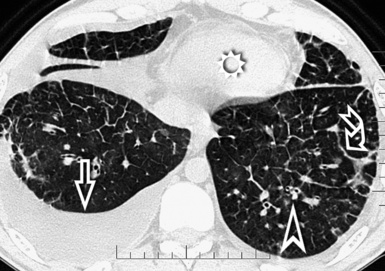
The diffuse interstitial form of amyloidosis is characterized by smooth or nodular septal, peribronchovascular, and subpleural thickening, frequently (50%) associated with well-defined subpleural nodules that are often calcified (Fig. 3-37).22,23 The lesions of diffuse pulmonary amyloidosis show a basal and peripheral prevalence24 (Fig. 3-38).
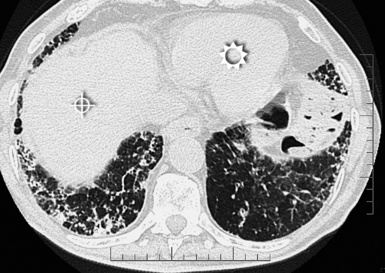
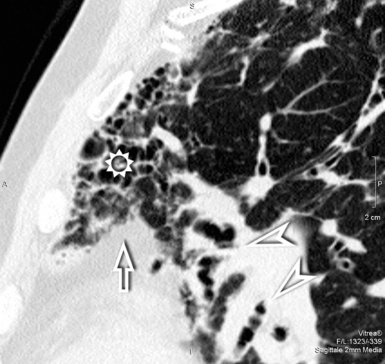
Figure 3-38 This is a more basal scan from the same patient as in Figure 3-37. Bull’s-eye, liver; sun, heart.
The key to the diagnosis is the existence of subpleural, confluent, calcified consolidations (Fig. 3-39). Associated findings are lymph node enlargement and unilateral or bilateral pleural effusions.25 Tracheobronchial involvement may be also present, with thickening of the tracheal and bronchial walls due to deposition of amyloid.
Fibrotic Pattern
Definition
A fibrotic pattern is present when signs of retraction and remodeling of thoracic structures are recognizable at the lobular level and/or in correspondence of larger portions of lung (Fig. 3-40).
High-Resolution Computed Tomography Signs
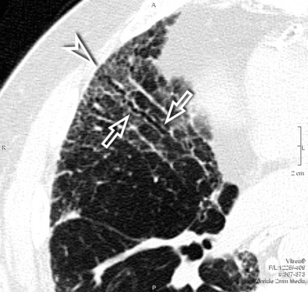
Irregular linear opacities (irregular reticulation) are criss-crossing, not uniform, wavering, white lines that appear as though they were traced by an unsteady hand on the lung background (Fig. 3-41). Sporadically, one could imagine that one or more of these lines represent remnants of interlobular septa (interlobular reticulation), but the visibility of interlobular septa is not the rule. On the contrary, the distortion due to fibrosis tends to reduce the recognition of the lobular architecture.2 Most of these lines criss-cross spaces of lobular size, so they are also called intralobular reticulation (see Fig. 3-41).
The vessels may appear enlarged with shaggy margins (interface sign), and the bronchi are irregularly ectatic with thickened walls and a winding or corkscrew appearance (Fig. 3-42). In the periphery of the lung, the bronchioles may be also ectatic (so visible) with the same appearance (traction bronchiectasis and bronchiolectasis) (see Fig. 3-41). Finally, parenchymal bands are long lines representing thickened connected septa marginating several lobules but also focal scarring or linear atelectasis.2
As a whole, the described lesions may vary in size and aspect, from a more-or-less coarse obvious pattern to a subtle hazy opacification of the lung referred to as fibrotic GGO that is only minimally inhomogeneous. In the latter case, ectatic bronchioles inside the GGO and superimposing irregular reticulation (indicating fibrosis) are the discriminant features26 (see Fig. 3-42).
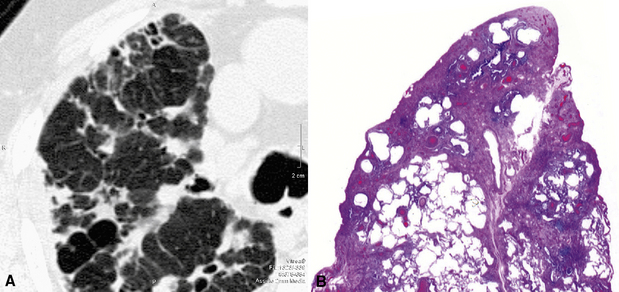
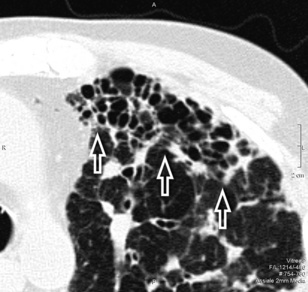
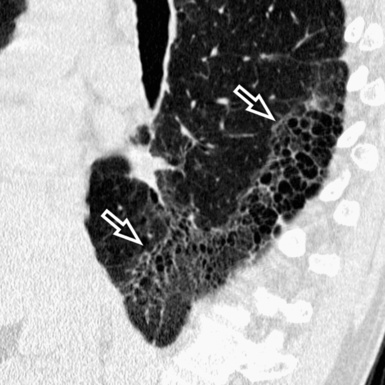
A peculiar feature of destructive fibrosis is honeycombing. In honeycombing, small hyperlucent areas of variable size (from 2 mm to 1 cm) and shape separated by well-defined thick walls are crowded in an area where the lung architecture is lost27 (Fig. 3-43). They should be distinguished (not easy and not always possible, especially in the early cases) from also roundish or elongated, windingly linear, transparencies corresponding to ectatic bronchioles (called microscopic honeycombing by Nishimura28).
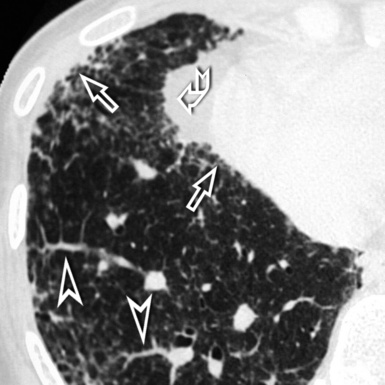
Signs of retraction and remodeling give further, at times striking, evidence of the existence of a fibrotic disorder. At the pulmonary interface, a pleural line with shaggy margins and connections with parenchymal irregular lines (interface signs) may be evident (Fig. 3-44). A thickening of the subpleural interstitium may also be obvious, as well as an increased thickness of extrapleural/mediastinal fat, the latter compensating for the shrinking lung (see Fig. 3-44). A shaggy thickening may be also observed at the interface of the visceral pleura, which becomes angulated and displaced.
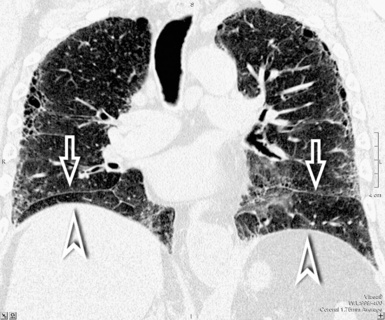
When fibrosis advances, one or more lobes and even the entire lung may become reduced in size. The signs associated with this are angulation and displacement of fissures, crowding of vessels and bronchi, and mediastinal and diaphragmatic attraction toward the affected lung (Fig. 3-45).
Subset Usual Interstitial Pneumonia
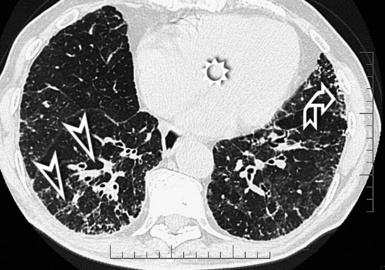
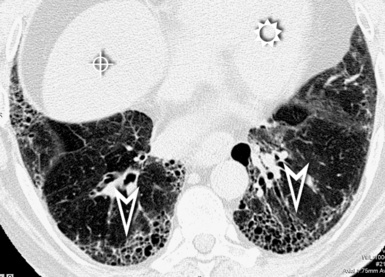
The UIP subset is defined by the presence of patchy areas of irregular reticulation and gross honeycombing with prominent signs of architectural distortion (Fig. 3-46). Traction bronchiectasis and microscopic honeycombing in connection with the pathologic areas are also characteristic.28 Some GGO is possible but less extensive than the reticulation.29 Signs of retraction and remodeling of vessels, fissures, lobes, and pulmonary boundaries are common, especially in advanced cases (Fig. 3-47).
The UIP subset may be seen both in idiopathic pulmonary fibrosis (IPF) and, with identical aspects, in several CVDs or, more rarely, chronic drug toxicity. Aspects of UIP are present also in individuals who develop an acute clinical course (acute exacerbation or acceleration of IPF), where the histologic findings show superimposed features of acute lung injury; in these cases, the radiologic presentation is usually dominated by the alveolar densities of acute lung injury and it is consequently discussed under the Alveolar Pattern, subset Acute. Diseases in the Fibrotic Pattern, subset UIP, are listed in Box 3-4.
Asbestosis
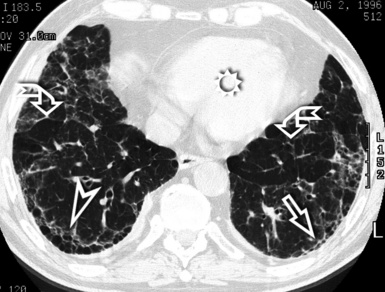
The early lesions of this disease are a combination of centrilobular dotlike and branching30 opacities, which are often arranged in clusters or connected in form of subpleural curvilinear lines31 (Fig. 3-48). These nodular opacities correspond to peribronchiolar nodular fibrosis responsible also for hyperlucent areas (mosaic perfusion) of lobular size from air trapping.31 The subsequent evolution may lead to an irregular interlobular and intralobular reticulation with bronchiectasis, architectural distortion, and honeycombing.32
The lesions are predominantly or exclusively located in the subpleural lobules of the posterior regions of the lower lobes in the early phases of disease,30 but they may become more extensive as the disease progresses (Fig. 3-49).
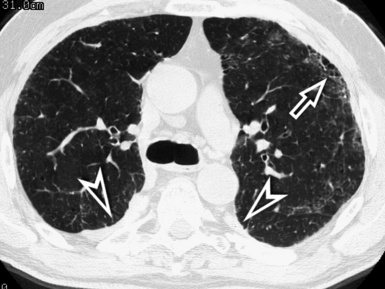
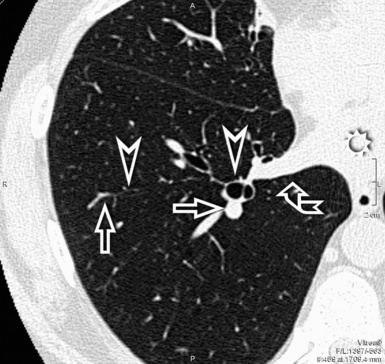
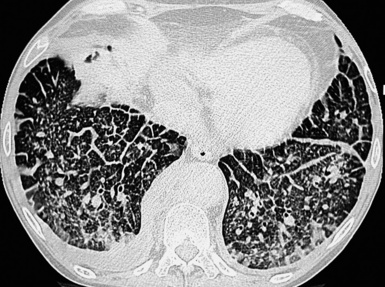
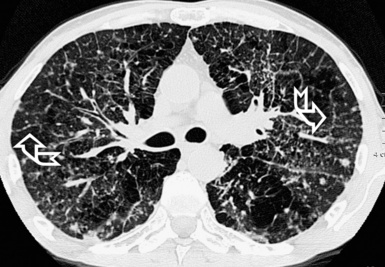
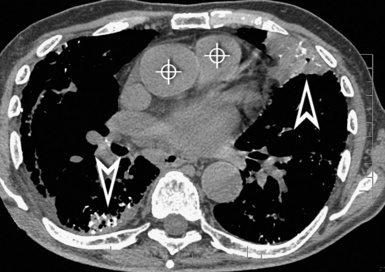
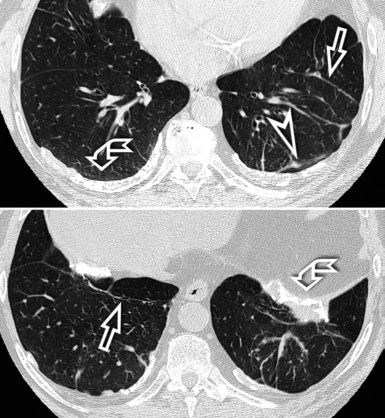
Figure 3-49 Axial scan at the carinal level in the same patient as in Figure 3-48. At this transversal level, the fibrotic involvement of the lung is only initial, and the honeycomb changes are confined in restricted areas (arrow). Bilaterally, there are pleural plaques of typical aspect (arrowheads).
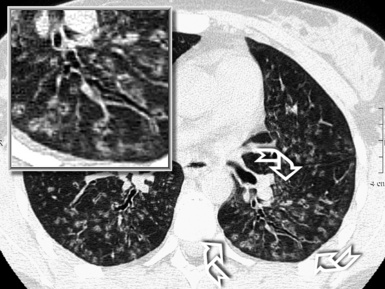
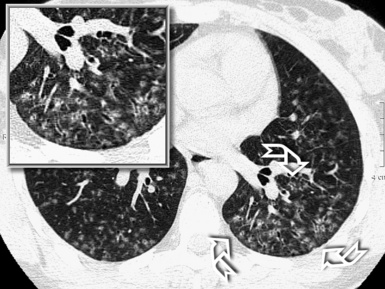
Diffuse parietal pleural thickening and pleural plaques with or without calcifications (Fig.3-50; see also Figs. 3-48 and 3-49) are considered typical of the asbestos-related disease, but not all patients with asbestosis show pleural abnormalities.2 Parenchymal bands are also characteristic of this disease (see Fig. 3-50) and may reflect thickening of interlobular septa, fibrosis along bronchovascular sheaths, coarse scars, or areas of atelectasis adjacent to pleural plaques or visceral pleural thickening.32,33
Chronic Hypersensitivity Pneumonitis
Fibrotic GGO and irregular reticulation with traction bronchiectasis and bronchiolectasis are the most common features of hypersensitivity pneumonitis, but honeycombing is also a frequent finding. Characteristically, the fibrotic lesions may be associated to a mixture of lobular areas with decreased attenuation, centrilobular nodules, and cysts inside the GGO34 (Fig. 3-51).
Both reticulation and honeycombing may prevail in the periphery of the lung and may show upper lung predominance (Fig. 3-52). However, a random distribution is also common. Lower lobe predominance is uncommon.34
Accompanying signs of retraction on the pleural surfaces and on the mediastinal profiles are generic consequences of the underlying fibrosis. Some volume loss may occur, particularly in the upper lungs35 (Fig. 3-53).
Idiopathic Usual Interstitial Pneumonia (Clinical Idiopathic Pulmonary Fibrosis)
Patchy areas of dense irregular reticulation and macro,31 as well as micro28 honeycombing alternating with normal lung (morphologic heterogeneity), are the most specific feature. Some focal areas of only slightly increased attenuation (due to uneven fibrosis) interspersed with relatively normal alveoli may coexist.28 Rugged pleural surfaces (due to the tendency for fibrosis to occur in the periphery of the secondary lobule) are very frequent.28 Characteristically, the patches of fibrosis are intermingled and sharply marginated with areas of normal parenchyma36 (Fig. 3-54).
The disease is typically subpleural,29,37 with some extension to the inner lung in connection with thickened vessels and ectatic bronchi.28 The longitudinal distribution of the lesions is interesting. Although the more complex lesions with traction bronchiectasis and honeycombing show middle and lower predominance,34 a contemporary irregular reticulation is frequently seen in the upper peripheral lung38 (Fig. 3-55). Especially in advanced fibrosis, the lung becomes smaller and the indirect signs of retraction and remodeling striking.
Focal emphysematous hyperlucencies in the upper zones of the lung28 but also inside the basal lesions are possible,39 and these may create diagnostic problems of differential diagnosis with honeycombing.40 A mild enlargement of mediastinal lymph nodes is present in approximately 70% of cases.41 Occasionally, small nodular foci of calcification25 or a disseminated dendriform pulmonary ossification42 may be found. Associated solitary pulmonary opacities from lung cancer are possible,43 as much as in all fibrotic disorders.
Some CVDs44 and, more rarely, drug reactions45 may present with aspects indistinguishable from the idiopathic UIP. Consequently, the suspicion of the underlying disorder may be formulated only on clinical grounds, but occasionally specific signs of the original disease are also seen radiologically46–48 (Fig. 3-56).
Subset Fibrotic Nonspecific Interstitial Pneumonia
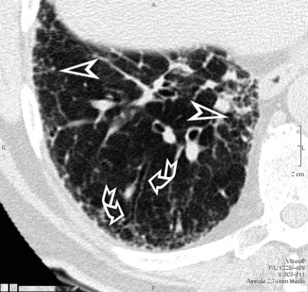
The NSIP pattern is defined by the presence of homogeneous areas of GGO associated with irregular reticulation49 (Fig. 3-57). The percentage of each likely depends on the proportions of inflammation and fibrosis within the lung, and some authors have even attempted to identify definite subgroups based on the extent of reticulation and traction bronchiectasis.50 Traction bronchiectasis is characteristic (Fig. 3-58). Honeycombing, on the contrary, should be absent or minimal.51
The NSIP subset may be seen both in idiopathic NSIP and in several CVD and drug reactions, but NSIP aspects also may be present in patients with acute exacerbation of NSIP (accelerated NSIP) where the histologic findings show superimposed features of acute lung injury. In latter cases, the radiologic presentation is dominated by the alveolar densities of acute lung injury, and this is consequently discussed in the Alveolar Pattern, subset Acute. Diseases in the Fibrotic Pattern, subset Fibrotic NSIP, are listed in Box 3-5.
Box 3-5 Diseases Presenting with Fibrotic Pattern, Subset Fibrotic Nonspecific Interstitial Pneumonia
Idiopathic Fibrotic Nonspecific Interstitial Pneumonia
Characteristic features of disease include reticular/GGO opacities with homogeneous aspect in affected areas. Inside the lesions, traction bronchiectasis and bronchiolectasis are common, and their extent has been shown to be a reliable indicator of fibrosis50 (Fig. 3-59). Dense consolidations, on the contrary, are uncommon, and their presence should raise the suspicion of another disease (such as OP, chronic eosinophilic pneumonia, or bronchioloalveolar carcinoma) or, in the appropriate clinical setting, of an acute exacerbation (see Alveolar Pattern, subsets Acute and Chronic).49 Honeycombing, if present, is mild and otherwise should raise the suspicion of UIP51; however, it has been reported that, over time, a number of NSIP originally presenting with NSIP pattern progress to UIP pattern.52
The disease is bilateral and symmetric,49 involving mainly the lower lungs in more than 90% of the cases51 (Fig. 3-60), otherwise equally distributed. On the contrary, primarily upper lobe lesions are very rare.49 Axially, the pattern is diffuse in more than 50% of the cases or predominantly peripheral subpleural, but in a number of cases (20% to 43% according to some authors27,51) the immediate subpleural regions are relatively spared.
Volume loss, mostly of the lower lobes, is fairly common,51 usually in conjunction with other indirect signs of fibrosis. Lymphadenopathy is possible at the mediastinal level,49 usually mild and involving not more than two nodal stations.41
Several CVDs41 and adverse reactions to therapeutic drugs53,54 may present with aspects indistinguishable from the idiopathic NSIP. Consequently, the suspicion of the underlying disorder should be formulated on clinical grounds. Occasionally, specific signs of the original disease are visible radiologically46–49 (Fig. 3-61).
Subset Tug-of-War
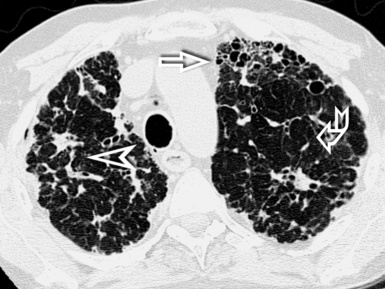
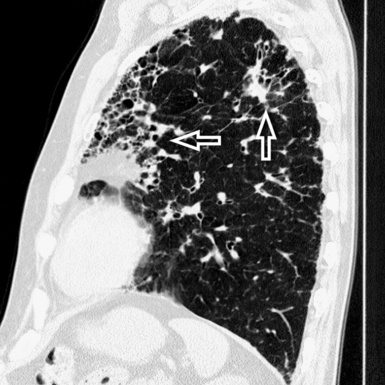
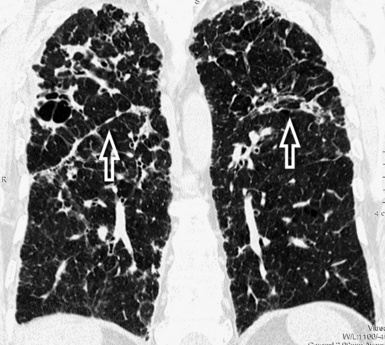
Tug-of-war subset is defined by the presence of irregular linear opacities stretching between the mediastinum and the thoracic boundaries, bridging over variably involved bronchi, fissures, and more generally anatomical structures and even pathologic elements found on their way (Fig. 3-62). The mediastinal profiles are variably stretched outward and the thoracic pleural profiles inward, hence the proposal for the name of this fibrotic subset (Fig. 3-63). Diseases in the Fibrotic Pattern, subset Tug-of-War, are listed in Box 3-6.
Sarcoidosis
Fibrosis may present early in the history of the disease, when nodular elements are fairly well visible. Irregularities of the margin of the nodules, distortion of fissures, bronchial irregularities, traction bronchiectasis, and more-or-less coarse linear opacities corresponding to the fibrotic component of the disease.55 The elements of the bronchovascular bundle become crowded and show a zigzagging course with angulations55,56 (Fig. 3-64). Progressive fibrosis leads to central conglomeration of parahilar bronchi embedded in a dense agglomerate of tissue radiating from the center to the periphery.56 Honeycombing and cystic abnormalities may be also seen, but rarely the honeycombing involves mainly the lower lung zones, mimicking UIP/IPF.57
The disease shows parahilar predominance between the central and the peripheral middle and upper lung, with patchy accentuation of parenchymal distortion and severity of the lesions55,58 (Fig. 3-65).
Mediastinal lymphadenopathy frequently coexists, often calcified. CT findings suggestive of pulmonary hypertension are possible in the late disease.2 Cavitation of conglomerated masses may be seen in patients with necrotizing sarcoid granulomatosis, the entity first described by Liebow characterized by sarcoid-like granulomas and vasculitis associated with variable degrees of necrosis56 (Fig. 3-66).
Subset Bronchocentric Fibrosis
Focal fibrosis from constrictive bronchiolitis is concentrated on the bronchioli and too subtle to be appreciated radiologically. However, indirect signs of bronchial narrowing are visible, namely a patchy dark lung (Fig. 3-67). This condition is subsequently discussed in the Dark Lung Pattern.
Pulmonary Langerhans cell histiocytosis, also a prominently centrilobular fibrotic process, on the contrary is well visible in form of thick walls around enlarged airways (Fig. 3-68) that assume early a cystic aspect.59 Consequently, its insertion in the cystic pattern has been considered more suitable. Diseases in the Fibrotic Pattern, subset Bronchocentric Fibrosis, are listed in Box 3-7.
Airway-Centered Interstitial Fibrosis
The main findings of airway-centered interstitial fibrosis are peribronchovascular interstitial thickening with traction bronchiectasis, thickened airway walls, and surrounding dense tissue with irregular margins (Fig. 3-69). Bronchiolectasis and honeycombing may also occur in a limited number of cases. GGO, poorly defined centrilobular micronodules, and lobular air trapping with the mosaic attenuation of the dark lung pattern are lacking.59
The lesions show a central rather than a peripheral distribution. They consistently show scarring around the airways60 (Fig. 3-70).
Nodular Pattern
Definition
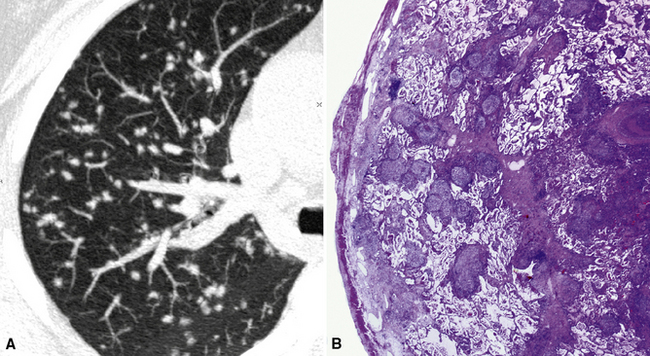
A nodular pattern is defined by the presence of multiple roundish opacities ranging in diameter from 2 to 10 mm (Fig. 3-71).
High-Resolution Computed Tomography Signs
On HRCT, lung nodules appear as white, roundish lesions with variable morphology and lobular distribution, depending on the route of arrival and on the modality of spread.2,7,61
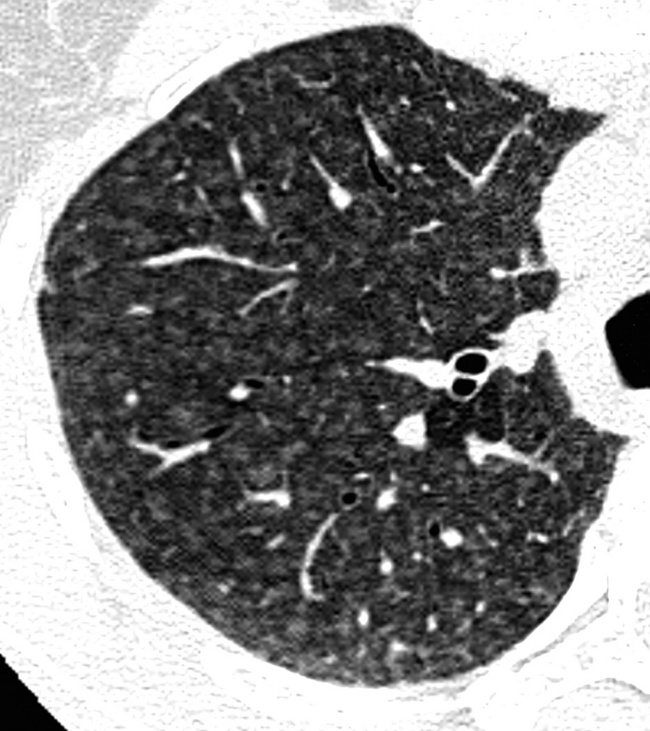
Nodules that have low-density and ill-defined margins (nodular GGO) have a characteristic soft aspect, like snowflakes (Fig. 3-72). Sometimes they are very tiny and difficult to recognize.20 They are commonly seen in patients with disease that primarily affects centrilobular bronchioles and the immediate area around them. The low-density CT aspect is due to minimal thickening of the peribronchiolar interstitium or partial filling of the peribronchiolar alveoli.2 Both conditions are below the CT spatial resolution, and thus the common final effect is a focal low-density lesion. The ill-defined margins are due to progressive reduction of interstitial or alveolar involvement extending away from the centrilobular area to the periphery. These types of nodules may coalesce, resulting in the appearance of extensive GGO.
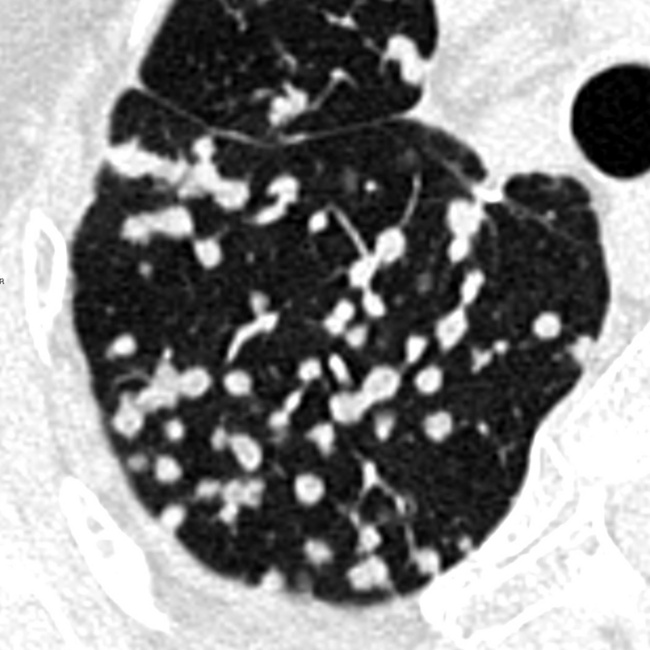
Nodules with high-density and well-defined margins are commonly seen in patients with diseases primarily affecting the interstitium and growing spherically in it surrounded by aerated parenchyma.2,61 They present a solid aspect like opaque beads and obscure the edges of vessels or other structures that they touch (Fig. 3-73). They may have regular or lobulated contours, the latter aspect secondary to asymmetrical growth. The nodules may coalesce with development of larger opacities or pseudoplaques along the costal or fissural margins.62
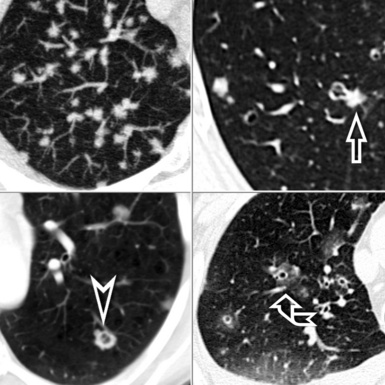
On occasion, the nodules may have shaggy profiles, especially in diseases with a fibrotic component (Fig. 3-74). The existence of small black areas inside these high-density nodules may be due to necrosis (see Fig. 3-74) or traction bronchiolectasis. The presence of faint increased lung attenuation around the nodules (halo sign) is most often an expression of hemorrhage (see Fig. 3-74) or of inflammatory infiltrates from any origin.62,65 Regarding the lobular distribution, this is the result of the route of arrival and of their modality of spread, both underlying their distinction in subsets.
