Blacks have higher mortality and hospitalization rates because of congestive heart failure compared with white counterparts. Differences in cardiac structure and function may contribute to the racial disparity in cardiovascular outcomes. Our aim was to compare computed tomography (CT)–derived cardiac measurements between black patients with acute chest pain and age- and gender-matched white patients. We performed a retrospective analysis under an institutional review board waiver and in Health Insurance Portability and Accountability Act compliance. We investigated patients who underwent cardiac dual-source CT for acute chest pain. Myocardial mass, left ventricular (LV) ejection fraction, LV end-systolic volume, and LV end-diastolic volume were quantified using an automated analysis algorithm. Septal wall thickness and cardiac chamber diameters were manually measured. Measurements were compared by independent t test and linear regression. The study population consisted of 300 patients (150 black–mean age 54 ± 12 years; 46% men; 150 white–mean age 55 ± 11 years; 46% men). Myocardial mass was larger for blacks compared with white (176.1 ± 58.4 vs 155.9 ± 51.7 g, p = 0.002), which remained significant after adjusting for age, gender, body mass index, and hypertension. Septal wall thickness was slightly greater (11.9 ± 2.7 vs 11.2 ± 3.1 mm, p = 0.036). The LV inner diameter was moderately larger in black patients in systole (32.3 ± 9.0 vs 30.1 ± 5.4 ml, p = 0.010) and in diastole (50.1 ± 7.8 vs 48.9 ± 5.2 ml, p = 0.137), as well as LV end-diastolic volume (134.5 ± 42.7 vs 128.2 ± 30.6 ml, p = 0.143). Ejection fraction was nonsignificantly lower in blacks (67.1 ± 13.5% vs 69.0 ± 9.6%, p = 0.169). In conclusion, CT-derived myocardial mass was larger in blacks compared with whites, whereas LV functional parameters were generally not statistically different, suggesting that LV mass might be a possible contributing factor to the higher rate of cardiac events in blacks.
Blacks have higher mortality and hospitalization rates because of congestive heart failure (CHF) compared with white counterparts. Discrepancies in the prevalence and consequences of CHF between blacks and whites have been attributed to race- and ethnicity-related differences in the prevalence of coexisting conditions (e.g., hypertension and diabetes mellitus), the quality and availability of medical care, and disparities in socioeconomic factors. However, there is evidence that there are underlying pathophysiological differences in the natural history of heart disease between the 2 populations, as coronary plaque composition in patients with acute chest pain has been found to differ by race. Potentially, differences in cardiac structure and function may contribute to the demonstrated racial disparity in cardiovascular outcomes. Accordingly, the purpose of this study was to compare computed tomography (CT)–derived cardiac measurements between black patients with acute chest pain and age- and sex-matched white patients.
Methods
The institutional review board waived patient informed consent because of the retrospective design of this Health Insurance Portability and Accountability Act compliant study. We included 300 patients who had undergone retrospectively electrocardiographically (ECG)-gated cardiac CT angiography for acute chest pain from October 2006 to April 2010. In previous publications, we reported on the effect of race on coronary atherosclerosis and epicardial fat volume. In this present study, we evaluated CT-derived myocardial morphology and function as such we included only those patients who had undergone functional imaging of entire cardiac cycle. Only patients with diagnostic image quality (i.e., evaluable coronaries) on CT examination were included. The patient population was composed of patients who had an inconclusive initial emergency department evaluation (nondiagnostic ECG, negative initial cardiac biomarkers, in accordance to the current recommendations of the American Heart Association). Patients with a history of revascularization (i.e., coronary artery bypass graft or stent) were excluded. The 2 groups were matched by age and gender.
Hypertension was defined as systolic blood pressure of 140 mm Hg or greater, diastolic blood pressure >90 mm Hg, or the use of antihypertensive medication. Hypercholesterolemia was defined as a total blood cholesterol level >200 mg/dl, or the use of lipid-lowering medication. Diabetes was defined as a fasting blood glucose level of 126 mg/dl or greater or a requirement for insulin or oral hypoglycemic agents. Body mass index (BMI) was calculated from the self-reported height and weight, and if either height or weight was missing, the BMI was derived from the hospital information system. Framingham Risk Score for 10-year cardiovascular disease risk was calculated.
All included subjects underwent retrospectively ECG-gated (pitch 0.2 to 0.5), contrast material–enhanced cardiac CT angiography on a dual-source CT system (Somatom Definition; Siemens Healthcare, Forchheim, Germany), at end inspiration. Scan settings were set to 80 to 120 kV, 600 to 900 mAs (depending on patient size). ECG-dependent tube current modulation was used in all patients with full nominal tube current restricted to 60% to 70% RR in patients with heart rate <70beats/min and to 35% to 45% RR with higher heart rates. Detector collimation was 64 × 2 × 0.6 mm; gantry rotation time was 330 ms (temporal resolution 83 ms). No pharmacologic heart rate control was prescribed and no nitroglycerin was administered. The CT examinations were contrast enhanced with 60 to 80 ml of iopromide (370 mgI/ml, Ultravist; Bayer-Schering, Berlin, Germany) followed by 30 ml of saline solution, both of which were injected at 6 ml/sec through a dual-syringe injector (Stellant D; Medrad).
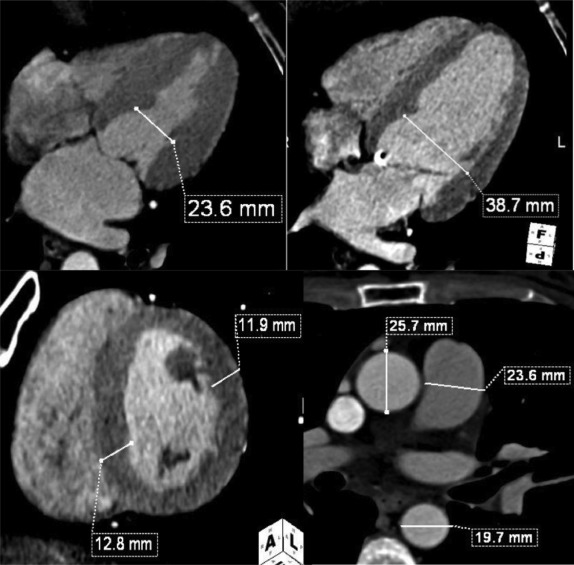
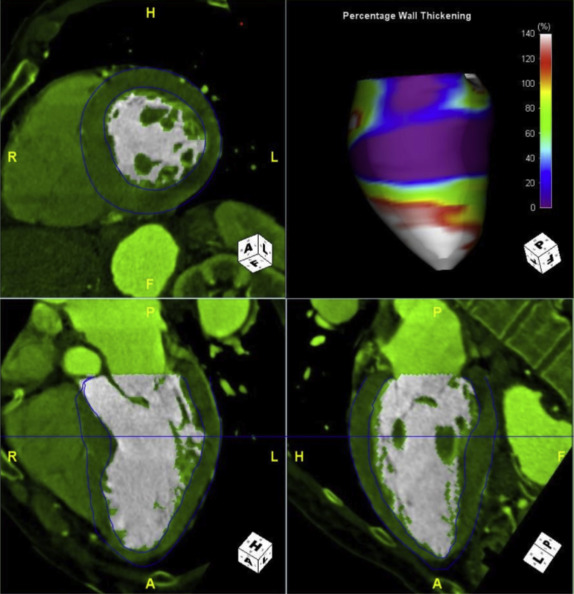
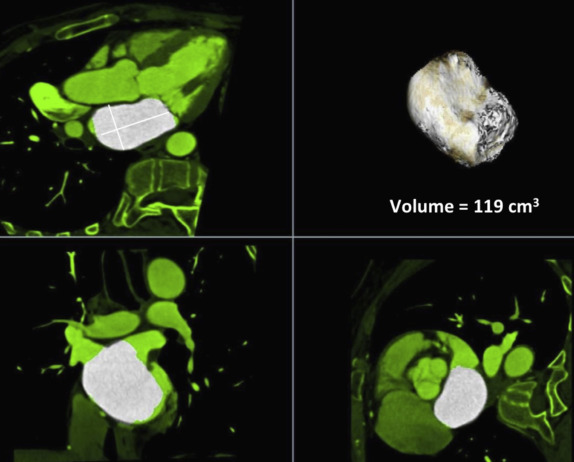
The functional CT data sets were loaded onto a workstation for postprocessing (Aquarius; TeraRecon, San Mateo, California) with a region-growing semiautomatic software tool and analyzed by one experienced investigator (7 years experience in reading cardiac CT angiography) who was blinded to the clinical and race information. Multiphase, multiplanar reformats (MPRs) of the data set were generated, including short- and long-axis reconstructions. End-systole was visually defined as the phase with smallest LV volume; end-diastole was defined as the phase with largest LV volume. Measurements in end-systole and end-diastole were performed at the same orientation and level. The cardiac measurements were obtained as previously described by Lang et al and Stolzmann et al Septal wall thickness in end-diastole and posterior wall thickness in end-diastole were measured on short-axis MPR series in the orientation of the 4-chamber plane at the chorda level at the intersection of the interventricular septum below the LV outflow tract. LV inner diameter in end-systole and end-diastole was measured in the 4-chamber MPR series at the midventricular level ( Figure 1 ). The software detected LV epicardial and endocardial contours semiautomatically; the contour detection was visually inspected and manually corrected if deemed necessary. Papillary muscles were included in the LV cavity. The software automatically calculated LV volumetric parameters, that is, end-systolic volume, end-diastolic volume, ejection-fraction, and LV myocardial mass ( Figure 2 ). Left atrial diameter and volume in end-systole were measured on axial oblique MPR images at the level of the aortic valve and parallel to the LV outflow tract in a strictly anterior–posterior orientation ( Figure 3 ). Confluences of pulmonary veins were excluded, as previously recommended. The widest diameter of the pulmonary artery was assessed perpendicular to the long axis of the main pulmonary artery and the right and left pulmonary arteries at the pulmonary artery bifurcation level. The outer limits of contrast enhancement were used to determine the vessel diameter. The diameter of the inner lumen of the aortic root, ascending aorta, and descending aorta were measured at the same axial level of pulmonary artery measurement. The lumen diameter of the coronary arteries was measured on curved planar reformation images at 1 cm from the origin and was performed for the left main coronary artery, anterior descending branch, left circumflex branch, and right coronary artery. The reconstructed data sets were transferred to an offline workstation (MultiModality Workplace; Siemens Healthcare, Forchheim, Germany) and analyzed by 2 experienced investigators (10 and 7 years experience in reading cardiac CT angiography) who were blinded to the clinical and race information. Stenosis was defined as any lesion that narrowed 50% or more of the vessel luminal area.


Analyses were performed for the entire population and stratified by race. Quantile–quantile plots used to evaluate whether continuous variables had a normal distribution. Continuous variables were expressed as mean (±SD), except for variables with nonnormal distribution, which were expressed as median (25th and 75th percentiles). Categorical variables were expressed as frequency and percentage. Statistical significance of differences in continuous variables was assessed by the independent-samples t test and, in cases of nonnormal distribution, by the Mann–Whitney U test. For categorical variables, the chi-square test was used. Linear regression with adjustment for covariables was applied to evaluate associations. Generalized linear model was used to calculate age-, gender-, BMI-, and hypertension-adjusted LV mass per race. All p values were 2-sided and a p value of 0.05 was considered statistically significant. Statistical analyses were performed using commercially available software (SPSS, version 22; IBM, Armonk, New York).
Results
Table 1 lists the study population characteristics by race. The study cohort consisted of 300 patients with acute chest pain (150 black and 150 white). Risk factor levels by race were similar, except for diabetes mellitus, which was more common in black patients. There was a nonsignificant tendency toward higher prevalence of smoking and lower prevalence of coronary stenosis in black compared with white patients.
| Variable | Black (n = 150) | White (n = 150) | P Value |
|---|---|---|---|
| Age (years) | 54 ± 12 | 55 ± 11 | 0.447 |
| Men | 69 (46.0%) | 69 (46.0%) | 1.000 |
| Diabetes mellitus | 45 (30.0%) | 23 (15.3%) | 0.002 |
| Smoker | 58 (38.7%) | 44 (29.3%) | 0.078 |
| Hypertension | 106 (70.7%) | 100 (66.7%) | 0.346 |
| Hypercholesterolemia | 63 (42.0%) | 75 (50.0%) | 0.195 |
| Body mass index (kg/m2) | 30 ± 5 | 30 ± 5 | 0.877 |
| Framingham risk score | 5 (2, 12) | 5 (2, 9) | 0.413 |
| DF-CASS pretest probability | 22 (13, 51) | 31 (14, 51) | 0.214 |
| Significant stenosis | 18 (12.0%) | 29 (19.3%) | 0.069 |
LV myocardial mass was significantly larger in blacks compared with whites ( Table 2 ). This remained significantly larger in blacks after adjusting for age, gender, BMI, and hypertension (176.6 ± 36.1 vs 155.6 ± 33.6, p <0.001). Also, septal wall thickness and posterior wall thickness were significantly larger in blacks. End-systolic volume was significantly greater in black than in white patients, whereas end-diastolic volume was nonsignificantly greater in blacks. Ejection fraction and stroke volume showed no significant differences ( Table 2 ). The LV inner diameter was significantly larger in black patients in systole, but not in diastole. Left atrium dimensions did not differ significantly between black and white patients ( Table 2 ). Regression coefficients were significant between LV measurements (myocardial mass) and age, systolic and diastolic blood pressure ( Table 3 ).
| Parameters | Black (n = 150) | White (n = 150) | P Value | |
|---|---|---|---|---|
| LV dimensions | Inner diameter systole [mm] | 32.3±9.0 | 30.1±5.4 | 0.010 |
| Inner diameter diastole [mm] | 50.1±7.8 | 48.9±5.2 | 0.137 | |
| LA dimensions | Anterior-posterior diameter [mm] | 39.6±6.5 | 39.4±5.9 | 0.778 |
| Transversal diameter [mm] | 66.9±7.1 | 68.1±6.5 | 0.147 | |
| Systolic volume [ml] | 97.6±29.8 | 99.3±24.6 | 0.623 | |
| Global LV function | End-systolic volume [ml] | 47.9±37.2 | 40.5±18.0 | 0.031 |
| End-diastolic volume [ml] | 134.5±42.7 | 128.2±30.6 | 0.143 | |
| Ejection fraction [%] | 67.1±13.5 | 69.0±9.6 | 0.169 | |
| Stroke Volume [ml] | 86.6±23.2 | 87.6±21.9 | 0.696 | |
| LV thickness / mass | Septal wall thickness [mm] | 11.9±2.7 | 11.2±3.1 | 0.036 |
| Posterior wall thickness [mm] | 11.2±2.4 | 10.3±2.2 | 0.001 | |
| Myocardial mass [g] | 176.1±58.4 | 155.9±51.7 | 0.002 |
| Overall (n = 300) | Black (n = 150) | White (n = 150) | |
|---|---|---|---|
| Age | -1.33**(-1.90, -0.75) | -1.67**(-2.53, -0.81) | -0.93*(-1.70, -0.17) |
| BMI | 0.39(-0.86, 1.64) | 1.01(-0.82, 2.84) | -0.39(-2.13, 1.36) |
| Systolic BP | 0.73*(0.28, 1.18) | 0.91*(0.25, 1.57) | 0.34(-0.26, 0.94) |
| Diastolic BP | 1.26**(0.60, 1.92) | 1.95**(0.93, 2.97) | 0.60(-0.21, 1.40) |
Stay updated, free articles. Join our Telegram channel

Full access? Get Clinical Tree


