We examined the effect of chlorthalidone-based stepped care on the competing risks of cardiovascular (CV) versus non-CV death in the Systolic Hypertension in the Elderly Program (SHEP). Participants were randomly assigned to chlorthalidone-based stepped-care therapy (n = 2,365) or placebo (n = 2,371) for 4.5 years, and all participants were advised to take active therapy thereafter. At the 22-year follow-up, the gain in life expectancy free from CV death in the active treatment group was 145 days (95% confidence interval [CI] 23 to 260, p = 0.012). The gain in overall life expectancy was smaller (105 days, 95% CI −39 to 242, p = 0.073) because of a 40-day (95% CI −87 to 161) decrease in survival from non-CV death. Compared with an age- and gender-matched cohort, participants had markedly higher overall life expectancy (Wilcoxon p = 0.00001) and greater chance of reaching the ages of 80 (81.3% vs 57.6%), 85 (58.1% vs 37.4%), 90 (30.5% vs 22.0%), 95 (11.9% vs 8.8%), and 100 years (3.7% vs 2.8%). In conclusion, Systolic Hypertension in the Elderly Program participants had higher overall life expectancy than actuarial controls and those randomized to active therapy had longer life expectancy free from CV death but had a small increase in the competing risk of non-CV death.
Concern has been raised that drug therapy when given over decades could possibly increase the risk of incident cancer or other noncardiovascular (non-CV) diseases, thus, diminishing the benefit of lower cardiovascular (CV) death. Carcinogenicity, if present, should become more evident with long-term follow-up when CV drugs are taken for many years. An increase in survival free from CV death was reported at the 22-year follow-up of the Systolic Hypertension in the Elderly Program (SHEP). However, this report examined CV death by censoring non-CV death and did not examine the effect of active therapy on the competing non-CV death including death due to cancer. SHEP was a randomized, double-blind, placebo-controlled trial in older patients with isolated systolic hypertension (ISH) in which chlorthalidone-based stepped-care therapy caused significant decreases in stroke, nonfatal coronary heart disease, and admissions for heart failure without significant effects on mortality at an average follow-up of 4.5 years. After the end of randomized phase of SHEP, all participants were advised to receive the active therapy and were monitored, using the National Death Index, for 22 years. This article describes the competing risks of CV versus non-CV death, including death due to cancer, and the impressive longevity of the SHEP cohort compared with actuarial controls matched for age, gender, and year of randomization.
Methods
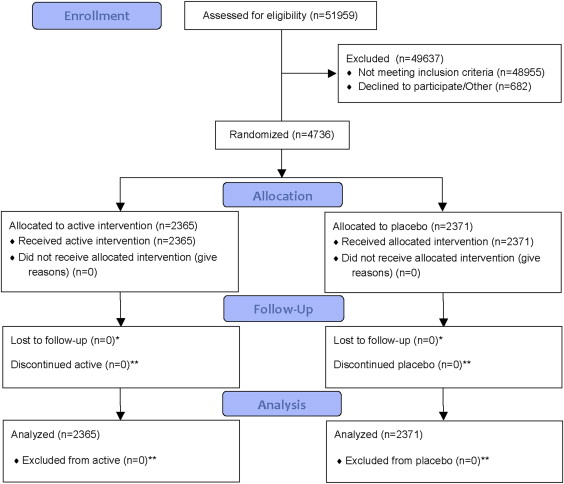
Men and women with ISH, systolic blood pressure ≥160 mm Hg, and diastolic blood pressure <90 mm Hg were treated with stepped-care therapy based on chlorthalidone 12.5 to 25 mg/day, with atenolol 25 to 50 mg/day as the second-line therapy, or matching placebos. At the final visit of the study, all participants were informed of the final results of SHEP and were advised to receive active therapy. There are no data on whether this advice was followed or on the antihypertensive therapy during the extended follow-up. Participants, who were alive at the end of SHEP, were matched by the National Death Index for death and cause of death till December 31, 2006. Deaths were categorized as due to CV causes (International Classification of Diseases, Ninth Revision 390 to 459) or as non-CV deaths. The power was calculated to detect a difference of 32% of total stroke with 90% power with 2-sided α of 0.05. This report complies with the Consolidated Standards of Reporting Trials ( Figure 1 ).
The study was approved by the Robert Wood Johnson Medical School and the University of Texas Health Science Center institutional review boards.
The data were analyzed using R, including the add-on package (cmprsk, http://www.r-project.org/ ), and Statistical Analysis System, version 9.3 (SAS Corporation, Cary, North Carolina). Kaplan-Meier plots were generated for the active treatment and placebo groups. In a previous report, focused on CV death differences between the 2 groups, deaths due to other causes were censored. This report did not examine the effect of active therapy on the competing non-CV death including death due to cancer. In this article, we report both on CV and non-CV deaths, including cancer deaths, from the point of view of competing risks. Although in our previous report deaths due to non-CV causes were censored, this report using algorithms of competing risk provides more precise estimates of the effect of the medications on CV death, non-CV death, and cancer death. The probability of each type of death was estimated using the cumulative incidence function, which partitions the probability of death into the probability of CV death and the probability of non-CV death (and in separate analyses into the probabilities of CV death, cancer death, and non-CV noncancer [other] death). To evaluate whether the observed increase in non-CV death (including death from cancer) in the active treatment group was equal to, higher, or lower than the increase expected from the higher number of subjects at risk in the active group, we used 2 statistical methods to study competing risk using both 2-outcome (CV vs non-CV death) and 3-outcome (CV death, cancer death, and non-CV noncancer death) models. The 2 methods used were as follows. (1) The Practical Incidence Estimator macro for Statistical Analysis System was used to produce age-adjusted incidence rates correcting for competing risk. (2) Cox regression analyses accounting for the competing risk in the 2- and 3-outcome models adjusting for age, gender, high-density lipoprotein cholesterol, body mass index, serum creatinine, and smoking.
To determine whether SHEP participants lived longer than actuarial controls, a Monte Carlo technique was used to derive the expected survival curve for a general population with the same demographic characteristics as the SHEP participants. To produce this model, a virtual person with the same age (at enrollment), year of enrollment, gender, race, and end of follow-up time for each SHEP participant was simulated. Using Centers for Disease Control and Prevention Life Tables, the probability distribution of the life expectancy for each member in the matched actuarial cohort was obtained. The residual lifetime for each virtual person (which was censored if this virtual person survived beyond the end of the follow-up period) was obtained from this distribution. The areas under the respective survival curves for the 2 cohorts were used to estimate the difference in (all cause) life expectancy of the SHEP participants and the actuarial controls. Four thousand bootstrap simulations were performed to compute a 95% confidence band of the survival curve.
The risk of the SHEP cohort was compared with the Framingham 5-year risk for hard coronary heart disease end points (myocardial infarction [MI] or coronary death) of persons with the same average baseline characteristics of SHEP participants. The 5-year time frame was chosen because information on nonfatal events was available for 4.5 years (i.e., the duration of clinical follow-up of SHEP).
Results
Of the 4,736 participants randomized 1:1 at 16 clinical centers in SHEP, 57% were women and the majority (86%) were white. The baseline characteristics of SHEP participants have been reported previously and are summarized in Table 1 . Considering the total duration of the trial, systolic blood pressure was lower in the active treatment group by 11 to 14 mm Hg and diastolic blood pressure by 3 to 4 mm Hg with a 5-year average blood pressure of 143/68 mm Hg in the active treatment and 155/72 mm Hg in the placebo groups. At the end of SHEP, fatal or nonfatal stroke (relative risk 0.64, 95% confidence interval [CI] 0.50 to 0.82), MI (relative risk 0.67, 95% CI 0.47 to 0.96), and heart failure (relative risk 0.51, 95% CI 0.37 to 0.71) were decreased in the active treatment group, whereas the effects on mortality were not statistically significant.
| Variable | SHEP Cohort |
|---|---|
| Average age (yrs) | 71.6 ± 6.7 |
| Education (yrs) | 11.7 ± 3.5 |
| Blood pressure (mm Hg) | |
| Systolic | 170.3 ± 9.4 |
| Diastolic | 76.6 ± 9.7 |
| Antihypertensive medication at initial contact | 33.3 |
| Smoker | |
| Current smoker | 12.7 |
| Past smoker | 37.1 |
| Never smoker | 50.2 |
| Previous MI | 4.9 |
| Previous stroke | 1.4 |
| Diabetes mellitus | 10.1 |
| Carotid bruits | 7.1 |
| Pulse rate (beats/min) | 70.8 ± 10.5 |
| Body mass index (kg/m 2 ) | 27.5 ± 5.0 |
| Serum cholesterol (mmol/l, mg/dl) | |
| Total | 6.1 ± 1.1, 236 ± 43 |
| High-density lipoprotein | 1.4 ± 0.4, 54 ± 15 |
| No limitation of activities of daily living | 94.6 |
At the extended (22-year) follow-up, in an analysis in which deaths due to non-CV causes were censored, the gain in life expectancy free from CV death was 158 days (95% CI 36 to 287, p = 0.009). The difference for all-cause death was 105 days (95% CI −39 to 242, p = 0.073).
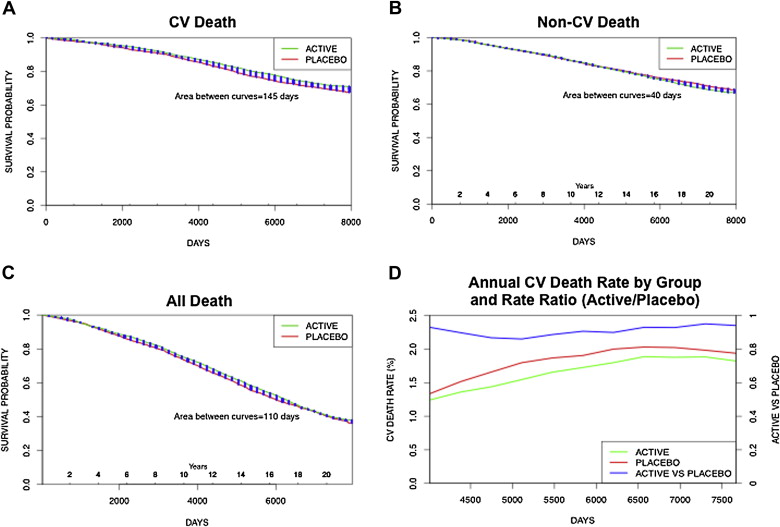
Figure 2 shows the survival curves of CV and non-CV death in the active (green) and placebo (red) groups using the more precise competing risk analysis. Survival free from CV death was higher for the active treatment group (by 145 days, 95% CI 23 to 260, p = 0.012), whereas the opposite was true for survival free from non-CV death (shorter by 40 days, 95% CI −87 to 161). The difference between the results of the 2 analyses was the reclassification of 13 deaths from non-CV to CV, although the gain in overall life expectancy was the same (105 days, 95% CI −39 to 242, p = 0.073) in both analyses. Survival free from CV death was longer in the active treatment group by 145 days while survival from death due to non-CV causes was 40 days shorter. Thus, overall survival (from death from any cause) was prolonged by 105 days. As a result of the opposite effects of active therapy on CV and non-CV death, the annual rate of CV death was lower in the active treatment group than in the placebo group (hazard ratio [HR] 0.88, 95% CI 0.78 to 0.98, p = 0.021) and the rate ratio (active/placebo) was consistently <1 throughout the follow-up.
The common causes of non-CV death in SHEP are summarized in Table 2 . There were 1,451 non-CV deaths (703 in the placebo group and 748 in the active treatment group). The active treatment group included 3.1% more non-CV deaths than the placebo group. Neoplasms (193 in placebo and 203 in active), respiratory diseases (119 and 122, respectively), and diseases of the nervous system were the most frequent causes of non-CV death. The age-adjusted analysis is presented in Figure 3 . There was a statistically significant difference in CV death in favor of the active group but no significant differences in non-CV death, cancer death, and non-CV noncancer death. Similar findings were observed using the Cox regression competing risk model adjusting for gender, high-density lipoprotein cholesterol, body mass index, creatinine, and smoking, in addition to age.
| Causes Of Non-CV Death | Total, n | Placebo | Active | A Minus P |
|---|---|---|---|---|
| External including supplementary | 72 | 33 (46) | 39 (54) | 6 (8) |
| Digestive | 62 | 26 (42) | 36 (58) | 10 (16) |
| Endocrine | 40 | 18 (45) | 22 (55) | 4 (10) |
| Genitourinary | 83 | 37 (45) | 46 (55) | 9 (11) |
| Infection | 18 | 7 (39) | 11 (61) | 4 (22) |
| Injury | 28 | 18 (64) | 10 (36) | −8 (−29) |
| Mental | 64 | 34 (53) | 30 (47) | −4 (−6) |
| Neoplasms | 396 | 193 (49) | 203 (51) | 10 (3) |
| Nervous | 108 | 47 (44) | 61 (56) | 14 (13) |
| Respiratory | 241 | 119 (49) | 122 (51) | 3 (1) |
| Symptoms | 28 | 15 (54) | 13 (46) | −2 (−7) |
| Other including unknown, blood, hypotension, congenital, musculoskeletal, skin | 311 | 156 (50) | 155 (50) | −1 (0) |
| Total | 1,451 | 703 (48) | 748 (52) | 45 (3) |
Stay updated, free articles. Join our Telegram channel

Full access? Get Clinical Tree


