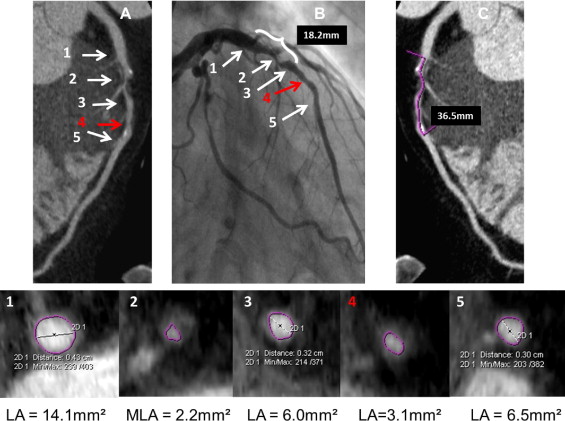
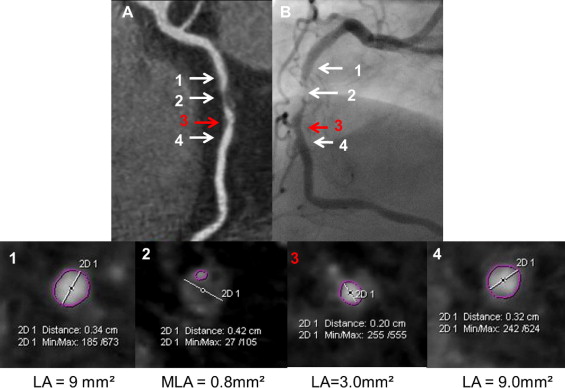
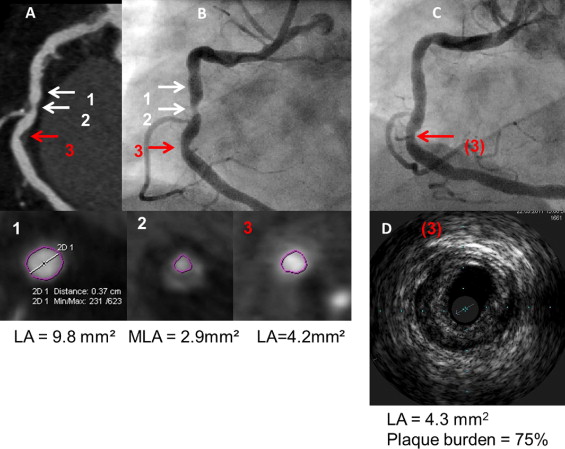
The aim of our study was to assess the impact of coronary computed tomographic angiographic (CTCA) guidance on outcomes of percutaneous coronary intervention (PCI). The study was a randomized single-center trial. Consecutive eligible patients with CTCA-detected significant coronary lesions who were scheduled for PCI were randomized to an angiographically guided versus an angiographically plus computed tomographically guided (ACTG) group. In the ACTG group the operator preliminarily planned PCI based on computed tomographic angiogram. The coprimary end points were minimal stent area and minimal reference lumen area assessed in all patients with intravascular ultrasound performed after achieving optimal angiographic results. Seventy-one patients (50 men, mean age 65 ± 8 years) were randomized. After invasive angiography, PCI of 32 lesions (30 patients) in the ACTG and in 32 lesions (30 patients) in the angiographically guided group was performed. A stented segment length was longer and nominal stent diameter tended to be larger in the ACTG group (23.8 ± 6.7 vs 19.5 ± 6.5 mm, p = 0.01; 3.27 ± 0.44 vs 3.09 ± 0.41 mm 2 , p = 0.110). Minimal stent area tended to be larger (6.62 ± 2.01 vs 5.80 ± 2.02 mm 2 , p = 0.100) and the smallest peri-stent reference lumen area was significantly larger in the ACTG group (6.76 ± 3.01 vs 5.0 ± 1.62 mm 2 , p = 0.006) with a smaller plaque burden (50 ± 16% vs 58 ± 13%, p = 0.025). In conclusion, CTCA analysis before PCI significantly influences treatment strategy and results in better lesion coverage as defined by intravascular criteria.
The aim of our study was to assess whether analysis of the initial coronary computed tomographic angiographic (CTCA) dataset before percutaneous coronary intervention (PCI) would affect the PCI treatment strategy and its immediate results.
Methods
This was a single-center randomized study with intravascular ultrasound (IVUS) end points. The study protocol has been registered ( http://www.ClinicalTrials.gov , NCT01205425 ). All eligible patients were randomized 1:1 to an angiographically plus computed tomographically guided (ACTG) group or to an angiographically guided (AG) group. The study was approved by the local ethics committee and was performed in accordance with the Second Declaration of Helsinki. All participating patients signed informed consent. We included consecutive patients with stable coronary artery diseases who underwent coronary CT angiography as the first anatomic coronary assessment before invasive coronary angiography. The inclusion criterion was the presence of ≥1 single significant (>70% stenosis) CTCA coronary lesion in a native coronary artery likely to undergo PCI. Patients with bifurcation lesions in whom strategies other than a single cross-over stent technique was probable (i.e., side branch diameter >2.5 mm), long-term total occlusions, left main coronary artery stenosis, in-stent restenosis, chronic renal failure (estimated glomerular filtration rate <30 ml/min/1.73 m 2 ), known allergy to contrast, untreated hyperthyroidism, and in whom the quality of coronary CT angiogram was low owing to arrhythmia (atrial fibrillation or other significant arrhythmia), use of dose-saving protocols (women <50 years), and contraindications to B-adrenolytics (chronic obstructive pulmonary disease) were excluded.
IVUS primary end points were (1) minimal stent area and (2) adequacy of lesion coverage defined as smallest lumen area in reference segments adjacent to stent shoulders. IVUS secondary end points included (1) mean stent area, (2) mean lumen area and mean plaque area in 10-mm–long segments adjacent to the stent edges, and (3) qualitative and quantitative assessments of potential complications (tissue prolapse, stent malapposition, and stent edge dissection). IVUS end points were assessed after the operator confirmed optimal angiographic outcome of the procedure defined as residual stenosis <30% by visual estimation.
The CTCA dataset was acquired with a dual-source CT scanner (Somatom Definition, Siemens, Forchheim, Germany) after sublingual administration of nitrates (0.8 mg). CTCA data were analyzed with quantitative CT software (Circulation, Siemens). Images were displayed with a visually adjusted setting for subjectively optimal lumen area measurement. References were the most normal-looking cross sections within 10 mm from the lesion site but before any major side branch. Lumen areas at the lesion site (minimum lumen area) and proximal and distal reference sites were automatically measured and manually corrected if necessary. Maximal lumen diameters were measured at the proximal and distal reference sites. Lesion length was the length of the segment that should be stented in the opinion of the off-line observer (J.P.).
In patients randomized to the ACTG group the operator (C.K. or M.C.) analyzed the CTCA images from all lesions that were likely to undergo ad hoc PCI based on CTCA data. The preliminary treatment strategy was then established and included stent length and diameter and optionally preplanned postdilation (i.e., proximal part of the stent implanted in long lesions). The determinant of the nominal stent diameter was based on proximal and distal reference lumen diameters. Suggested stent length was based on the distance between the cross sections proximal and distal to the stenosis site with lumen area >4.5 mm 2 and minimal amount of plaque. The final decision on all PCI strategies was left at the discretion of the operator after invasive angiography. In patients randomized to the AG group the operator (C.K. or M.C.) was blinded to CTCA data, and ad hoc PCI was performed under angiographic guidance alone. Figures 1 to 3 show examples of PCI planning based on angiography alone or angiography plus CTCA data.


IVUS was performed after attainment of optimal angiographic results. Intracoronary nitroglycerin (0.2 mg) was administered and the IVUS catheter (Volcano Corporation, San Diego, California) was advanced >10 mm distal to the stented segment and retrograde imaging performed with an automatic pullback (0.5 mm/s). Off-line IVUS analyses were performed by an observer (J.P.) blinded to patients’ allocation to study groups and according to established criteria. IVUS measurements were performed at the minimal stent area site and at maximal and minimal lumen area sites located within 10-mm–long reference segments adjacent to the stent shoulders but before a major side branch. Reference measurements included lumen and external elastic membrane areas and plaque burden ([external elastic membrane area minus lumen area]/external elastic membrane × 100%). Stent expansion was defined as the ratio of minimal stent area to the mean of proximal and distal reference lumen areas. A significant residual reference stenosis was a lumen area <4.0 mm 2 and plaque burden ≥70%. Morphometric IVUS analyses of the length of the stented segment and adjacent references were based on cross-sectional measurements every 1 mm and included mean stent area, mean reference lumen area, mean reference external elastic membrane area, and mean reference plaque area. Stent malapposition, tissue prolapse, and stent edge dissection were identified according to established criteria. Qualitative assessment of these IVUS findings included length, maximal area, and maximal depth of stent malapposition; length and maximal area of tissue prolapse; and length of edge dissection.
Angiograms (Axiom Artus DFC, Siemens) were analyzed offline using quantitative coronary angiography by an experienced observer (L.K.). References were the most normal-looking segments located within 10 mm from the lesion site. Lesion length was the length of the segment that should be stented in the opinion of the off-line observer (L.K.). Minimal lumen diameter and lumen diameters at the proximal and distal references were measured.
Our study was a pilot trial with a recruitment goal of 30 patients in each arm. Continuous data with normal distribution are presented as mean ± SD and non-normally distributed variables are presented as median with interquartile range. An independent-samples t test, paired t test, Mann–Whitney test, or Wilcoxon test was used to assess differences between continuous variables. Categorical variables were compared using chi-square test.
Results
From September 2009 through April 2011 71 patients were randomized to the ACTG group (n = 36) and to the AG group (n = 35; Figure 4 ). In 11 patients with a CTCA-diagnosed significant stenosis, PCI was deferred based on negative results of invasive angiography and fractional flow reserve examination. Ad hoc PCI was performed in 60 subjects (64 lesions): 32 lesions in 30 patients in the ACTG group and 32 lesions in 30 patients in the AG group. Median time from coronary CT angiography to PCI was 30 days (14.5 to 47.5). Baseline demographic and clinical variables of randomized patients who eventually underwent PCI were similar in the 2 study arms ( Table 1 ).

| Variable | ACTG (30 patients, 32 lesions) | AG (30 patients, 32 lesions) | p Value |
|---|---|---|---|
| Men | 23 | 20 | 0.57 |
| Age (years) | 63 ± 10 | 66 ± 6 | 0.12 |
| Diabetes mellitus | 8 (27%) | 6 (20%) | 0.76 |
| Hypercholesterolemia ⁎ | 27 (90%) | 27 (90%) | 0.67 |
| Hypertension † | 28 (93%) | 27 (90%) | 1.0 |
| Location of target coronary lesion | 0.91 | ||
| Left anterior descending coronary artery | 18 (56%) | 18 (56%) | |
| Left circumflex coronary artery | 4 (13%) | 3 (9%) | |
| Right coronary artery | 10 (31%) | 11 (35%) | |
| Nominal stent diameter (mm) | 3.27 ± 0.44 | 3.09 ± 0.41 | 0.11 |
| Maximal balloon pressure (atm) | 17.0 ± 3.0 | 15.5 ± 2.7 | 0.04 |
| Maximal balloon diameter (mm) | 3.31 ± 0.41 | 3.11 ± 0.45 | 0.07 |
| Predicted stent diameter according to compliance chart (mm) | 3.65 ± 0.44 | 3.35 ± 0.42 | 0.009 |
| Length of stented segment (mm) | 23.8 ± 6.7 | 19.5 ± 6.5 | 0.01 |
| Number of stents/lesion | 1.09 | 1.03 | 0.31 |
| Postdilation | 10 (31%) | 5 (16%) | 0.24 |
⁎ Defined as low-density lipoprotein level >3.0 mmol/L or use of statin therapy before coronary computed tomographic angiographic scan (after coronary computed tomographic angiography all patients with diagnosed significant stenosis received statins).
† Defined as blood pressure ≥140/90 mm Hg or use of antihypertensive treatment.
Most lesions were treated with Resolute (Medtronic Inc., Minneapolis, Minnesota) (15 in ACTG vs 10 in AG group, p = 0.30) or Biomatrix (Biosensors Intl., Singapore) (10 in ACTG vs 6 in AG group, p = 0.39) stents. Implanted stent length and/or diameter differed from that before planning in only 5 lesions in the ACTG group (2 lesions were treated with a nominal stent diameter smaller by 0.5 mm, 1 lesion with a nominal stent diameter larger by 0.5 mm; in 3 lesions the stented segment was longer than planned). Therefore, comparing preplanned to actually implanted stents showed no overall difference in nominal stent diameter (3.27 ± 0.44 vs 3.26 ± 0.41 mm, p = 0.8) and the 2 diameters were closely correlated ( R = 0.91, p <0.0001); similarly, there was no difference in stent length (22.9 ± 6.2 vs 23.8 ± 6.7 mm, p = 0.11) and the 2 lengths were closely correlated ( R = 0.95, p <0.0001).
Comparing the 2 groups after an optimal angiographic result and before IVUS imaging, stented segment length was longer, nominal stent diameter was larger, and maximum balloon pressure and stent diameter derived from the manufacturer’s provided compliance charts were significantly increased in the ACTG group versus the AG group ( Table 1 ). Subsequently, IVUS imaging resulted in (1) additional stents being implanted in 3 lesions in the AG group and in 1 lesion in the ACTG group and (2) the operator deciding to postdilate 9 lesions in the AG group and 3 lesions in the ACTG group (p = 0.10). Overall, further intervention (postdilatation or additional stent implantation) was performed in 5 (16%) lesions in the ACTG group versus 12 (38%) lesions in the AG group (p = 0.09).
Baseline quantitative angiographic and CTCA lesion characteristics were similar in the 2 study groups ( Table 2 ). IVUS results are presented in Table 3 . Minimal stent area (coprimary end point) tended to be larger in the ACTG group (6.64 ± 2.01 vs 5.80 ± 2.02 mm 2 , p = 0.1), as was mean stent area (secondary end point, 7.81 ± 2.15 vs 6.86 ± 1.93 mm 2 , p = 0.07). Compared to the AG arm, the smallest reference lumen area adjacent to the stent edge (coprimary end point) was larger in the ACTG group (6.76 ± 3.01 vs 5.0 ± 1.62 mm 2 , p = 0.006) and plaque burden at this site was smaller (50 ± 16% vs 58 ± 13%, p = 0.025). Mean reference lumen area (secondary end point) was larger in the ACTG group (8.49 ± 2.50 vs 7.32 ± 2.09 mm 2 , p = 0.049); however, mean plaque area (secondary end point) was similar in the ACTG and AG groups (6.69 ± 2.96 vs 7.46 ± 2.72 mm 2 , p = 0.28), rendering mean reference plaque burden significantly less in the ACTG arm (43 ± 11% vs 50 ± 9%, p = 0.008). Significant peri-stent reference stenosis was identified by IVUS imaging was in 3 patients from the AG group and in 1 patient from the ACTG group (p = 0.6). Incidence of acute stent malapposition, tissue prolapse, and stent edge dissection and quantitation of these IVUS findings was similar in the 2 study groups ( Table 4 ).
| Variable | ACTG (n = 32) | AG (n = 32) | p Value |
|---|---|---|---|
| Quantitative coronary angiography | |||
| Lesion length (mm) | 16.5 ± 5.2 | 17.6 ± 5.9 | 0.46 |
| Proximal reference lumen diameter (mm) | 2.97 ± 0.58 | 2.95 ± 0.45 | 0.86 |
| Distal reference lumen diameter (mm) | 2.77 ± 0.56 | 2.76 ± 0.57 | 0.96 |
| Minimal lumen diameter (mm) | 0.85 ± 0.40 | 0.90 ± 0.35 | 0.63 |
| Coronary computed tomographic angiography | |||
| Lesion length (mm) | 22.5 ± 6.7 | 24.0 ± 6.8 | 0.36 |
| Proximal reference lumen area (mm 2 ) | 10.24 ± 2.59 | 10.13 ± 2.88 | 0.92 |
| Proximal reference lumen diameter (mm) | 3.70 ± 0.64 | 3.69 ± 0.71 | 0.97 |
| Minimal lumen area (mm 2 ) | 2.6 ± 1.3 | 2.7 ± 1.2 | 0.77 |
| Distal reference lumen area (mm 2 ) | 7.84 ± 2.43 | 7.75 ± 2.73 | 0.89 |
| Distal reference lumen diameter (mm) | 3.21 ± 0.59 | 3.21 ± 0.52 | 1.0 |
Stay updated, free articles. Join our Telegram channel

Full access? Get Clinical Tree


