The aim of this study was to elucidate patent foramen ovale (PFO) morphology and the change of PFO size using real-time 3-dimensional (3D) transesophageal echocardiography (TEE). PFO is a 3D structure, and its shape changes during the cardiac cycle. Therefore, it may be difficult to estimate accurate PFO morphology using 2-dimensional (2D) TEE. The study included 50 patients with PFO who underwent 2D and 3D TEE. PFO heights (PHs) at entrance, mid, and exit were measured by 2D and 3D TEE. Systolic and diastolic areas were also measured by 3D TEE. PH by 3D TEE was larger than that by 2D TEE (entrance 0.32 ± 0.18 vs 0.21 ± 0.15 cm, p <0.001; mid 0.25 ± 0.14 vs 0.15 ± 0.11 cm, p <0.001; exit 0.19 ± 0.11 vs 0.11 ± 0.08 cm, p <0.001). Systolic area was greater than diastolic area at each location (entrance 0.19 ± 0.17 vs 0.11 ± 0.11 cm 2 , p = 0.001; mid 0.13 ± 0.11 vs 0.08 ± 0.06 cm 2 , p = 0.001; exit 0.09 ± 0.09 vs 0.06 ± 0.05 cm 2 , p = 0.01). Additionally, entrance area was greater than exit area in systole and diastole (systole 0.19 ± 0.17 vs 0.09 ± 0.09 cm 2 , p <0.001; diastole 0.11 ± 0.11 vs 0.06 ± 0.05 cm 2 , p = 0.001). There were good correlations between PH by 3D TEE and PFO area (entrance r = 0.68, mid r = 0.71, exit r = 0.78) but weak correlations between PH by 2D TEE and PFO area (entrance r = 0.62, mid r = 0.50, exit r = 0.51). In conclusion, real-time 3D TEE could provide detailed and unique information on PFO morphology.
It has been suggested that patients with cryptogenic stroke or transient ischemic attack have a higher prevalence of patent foramen ovale (PFO). In previous studies, PFO morphology was assessed using 2-dimensional (2D) methods. However, PFO is a 3-dimensional (3D) structure, and its shape changes during the cardiac cycle. Therefore, it may be difficult to evaluate accurately the morphology and size of PFO using parameters measured by 2D methods. The aim of this study was to elucidate PFO morphology and the change in PFO size using real-time 3D transesophageal echocardiography (TEE).
Methods
We retrospectively analyzed 50 consecutive patients with PFO who underwent 2D and real-time 3D TEE from March 2009 to July 2012. Data collection and analysis were performed with approval by the institutional review board.
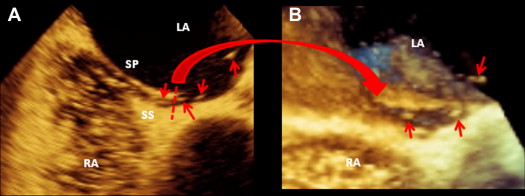
The 2D and 3D images were obtained using an iE33 ultrasound system (Philips Medical Systems, Andover, Massachusetts) equipped with a 3D matrix-array transesophageal transducer (X7-2t; Philips Medical Systems). Images of PFO by 2D TEE were acquired from transverse midesophageal 4-chamber view at 0° and the longitudinal bicaval view at 90°. Images by real-time 3D TEE were obtained using live 3D mode acquired from midesophageal level at 90°. During 2D and real-time 3D TEE, contrast studies were performed, and adequate saline contrast effect was verified in every patient on the basis of the right atrium being fully and densely opacified by the contrast medium. The Valsalva maneuver was undertaken in all patients during TEE. PFO was diagnosed as either (1) direct visualization of microbubbles passing through the atrial septum ( Figure 1 ) or (2) visualization of color Doppler flow through the atrial septum. Measurements were obtained during the release phase of the Valsalva maneuver.
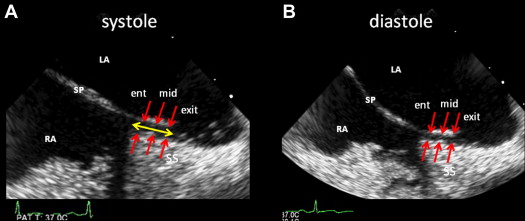
The longitudinal bicaval views in ventricular systole and diastole were obtained by 2D TEE. PFO heights (PHs), defined as the maximum distance between the septum primum and septum secundum, were measured at entrance (right atrial side), mid, and exit (left atrial side) locations using the VERICIS Echo Review Application (Camtronics Medical Systems, Hartland, Wisconsin) off-line ( Figure 2 ). Furthermore, PFO length, defined as the overlap of the septum primum and septum secundum, was also measured ( Figure 2 ).
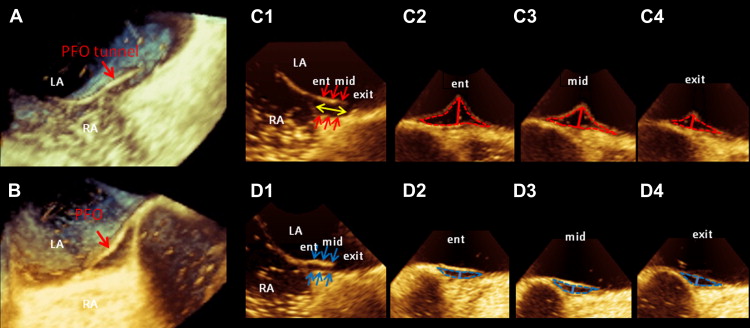
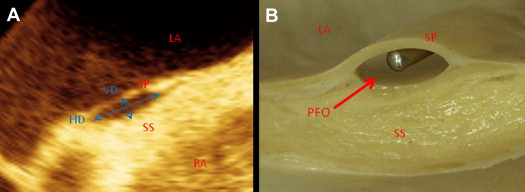
Longitudinal bicaval views to determine PFO area and PH at entrance, mid, and exit were obtained from 3D images in ventricular systole and diastole using QLAB software (Philips Medical Systems) off-line ( Figure 3 ). The 2D cutting plane was shifted and rotated on the longitudinal bicaval view to obtain cross-sectional views. All PFO areas were measured using the manual trace method ( Figure 3 ). PHs, defined as the maximum distance between the septum primum and septum secundum, were measured at entrance, mid, and exit locations on the cross-sectional views ( Figure 3 ). PFO length, defined as the overlap of the septum primum and septum secundum, was also measured ( Figure 3 ). Additionally, the vertical and horizontal diameters of PFO were measured in systole, and the ellipticity index was calculated as vertical diameter divided by horizontal diameter ( Figure 4 ).
Continuous data are expressed as mean ± SD. Paired Student’s t tests were used to compare the areas in systole with those in diastole and the areas of entrance with those of exit. Pearson’s correlation analysis and simple regression were used to assess the relations between PHs measured by 2D and real-time 3D TEE and PFO area measured by real-time 3D TEE. The Friedman test followed by the post hoc Dunn test was used to identify differences among entrance, mid, and exit areas in systole and diastole, respectively. Intraobserver and interobserver agreement were analyzed for 10 measurements. Measurements were repeated by the same observer and by a second independent blinded reader. Variability was then estimated by intraclass correlation coefficient, with good agreement being defined as >0.80. A 2-tailed p value <0.05 was considered significant. Data analysis was performed using GraphPad Prism 5.0 (GraphPad Software, Inc., San Diego, California) and JMP version 7.0.1 (SAS Institute Inc., Cary, North Carolina).
Stay updated, free articles. Join our Telegram channel

Full access? Get Clinical Tree


