Contrast enhancement has been shown to improve detection of regional wall motion abnormalities (RWMA) in 2-dimensional (2D) echocardiography. This study determined the use of contrast enhancement in the setting of 3-dimensional (3D) echocardiography for definition of left ventricular RWMA compared with 2D echocardiography, cineventriculography, and cardiac magnetic resonance (CMR). In 63 patients, unenhanced and contrast-enhanced (SonoVue; Bracco Imaging S.p.A., Milan, Italy) 2D and 3D echocardiographies, CMR, and cineventriculography were performed. Hypokinesia in ≥1 segment defined the presence of RWMA. Interreader agreement (IRA) between 2 blinded off-site readers on presence of RWMA was determined within each imaging technique. Intermethod agreement among imaging techniques was analyzed. A standard of truth for the presence of RWMA was obtained by an independent expert panel decision. IRA on presence of RWMA expressed as Cohen’s κ coefficient was 0.27 for unenhanced 3D echocardiography, 0.40 for unenhanced 2D echocardiography, 0.57 for CMR, and 0.51 for cineventriculography. The use of contrast increased IRA on RWMA to 0.42 for 3D echocardiography and to 0.56 for 2D echocardiography. Agreement with CMR on RWMA increased for 3D echocardiography when contrast enhancement was used (κ 0.40 vs 0.22 for unenhanced 3D echocardiography). Similarly, agreement of 2D echocardiography with CMR on RWMA increased with contrast enhancement (κ 0.50 vs 0.32). Accuracy to detect expert panel–defined RWMA was highest for CMR (84%) followed by 2D contrast echocardiography (78%) and 3D contrast echocardiography (76%). It was lesser for 2D and 3D unenhanced echocardiographies. In conclusion, analysis of RWMA is characterized by considerable interreader variability even using high-quality imaging techniques. IRA on RWMA is lower with 3D echocardiography compared with 2D echocardiography. IRA on RWMA and accuracy to detect panel-defined RWMA improve with contrast enhancement irrespective of the 2D or 3D echocardiography use.
The objectives of this multicenter study were to (1) determine the interreader agreement (IRA) in the definition of regional wall motion abnormalities (RWMA) for unenhanced and contrast-enhanced 3-dimensional (3D) echocardiographies compared with unenhanced and contrast-enhanced 2-dimensional (2D) echocardiographies, cineventriculography, and cardiac magnetic resonance (CMR), (2) determine the agreement between the different imaging techniques in the definition of RWMA, and (3) evaluate for each of the imaging techniques the agreement and accuracy of determined RWMA related to the standard of truth on regional left ventricular (LV) function as defined by an expert panel decision (EPD) based on clinical, electrocardiographic (ECG), angiographic, and imaging data. The design of this study allowed a direct comparison of the techniques during resting conditions on the same patients. Blinded readings using experienced independent core laboratories were performed for each imaging technique according to defined standards.
Methods
This multicenter open-label study used intrasubject comparison of 3D unenhanced and contrast-enhanced echocardiographies with 2D echocardiography, biplane cineventriculography, and CMR for determination of RWMA. Coronary angiography for suspected coronary artery disease was performed in all patients. Immediate revascularization after coronary angiography was an exclusion criterion. All imaging techniques were performed within 72 hours with the patient being in stable hemodynamic conditions.
For each imaging technique, recommendations on the performance of image acquisition were defined to secure uniform and interpretable image data sets from all participating institutions. The adherence to the predefined imaging protocols of this multicenter trial by the performing physicians was monitored during the enrollment period.
The analysis of image data sets for RWMA was performed for each imaging technique by 2 independent off-site readers not affiliated to the participating centers who were unaware of the clinical data and the results of the other imaging techniques. All off-site readers had at least 5 years of experience in the evaluated imaging technique. Guidelines were defined and provided on the evaluation of regional LV function for each imaging technique to the unaffiliated off-site readers of the independent core laboratories (see Appendix ). Regional wall motion of each analyzed segment was defined as either normokinetic, hypokinetic, akinetic, or dyskinetic. Whenever the regional function could not be defined because of insufficient image quality, the function was assumed to be normal. Although regional function was determined for each LV segment, the presence of an RWMA was reported on a patient basis, and a comparison of methods was performed on detection of RWMA on a patient basis. The study was conducted according to the Good Clinical Practice and in compliance with local regulatory requirements. The research protocol was approved by the applicable central and local institutional ethics committees. All patients gave written informed consent to participate in the study.
Sixty-five patients were enrolled at 4 European centers with balanced contribution. Patient enrollment was stratified at each center based on results from angiographic ventriculography to achieve a balanced distribution within 3 predefined LV ejection fraction groups (>55%, 35% to 55%, and <35%). An interpretable cineventriculography with availability of at least 2 consecutive nonextrasystolic cardiac cycles during ventriculographic contrast administration was a prerequisite for inclusion into the study. Two patients had to be excluded from the study because of claustrophobia during the CMR imaging procedure. Thus, 63 patients formed the study group.
Two-dimensional and 3D echocardiographies using tissue harmonic imaging for unenhanced and contrast-specific imaging for contrast-enhanced echocardiography were performed with a commercially available ultrasound scanner (IE 33; Philips, Andover, Massachusetts). Written recommendations were provided for the uniform use of equipment presets, imaging conventions, imaging sequence, and annotations. Two-dimensional apical 4-chamber, 2-chamber, and 3-chamber views as well as 3D full-volume data sets from the apical position were acquired without and with contrast enhancement. For unenhanced imaging, harmonic imaging (mechanical index 1.6, gain 50%, compression 70%) was used, whereas for contrast-specific imaging, a low mechanical index of 0.3 was preselected (gain 60%, compression 15%). Optimization of imaging conditions for endocardial border definition was performed by modulation of transmit power, gain, focus, and dynamic range, as required. Great care was taken to avoid apical foreshortening and to maximize the length from base to apex. A 3D full-volume data set of the ventricle was obtained with gated (5 beats) acquisition. Sector size and depth were optimized to obtain the highest possible volume rates reaching 17 to 20 frames/s in the contrast 3D full-volume mode.
For contrast-enhanced echocardiography, a 20Fr intravenous catheter was introduced into the right antecubital vein. Sulfur hexafluoride microbubbles (SonoVue; Bracco Imaging S.p.A., Milan, Italy) were administered with a starting infusion rate of 1 ml/min followed by subsequent rate adjustments to reach homogeneous LV cavity opacification without attenuation. Before acquiring 2D and 3D echocardiographic images, the infusion rate was separately adjusted if necessary to obtain adequate contrast enhancement.
In each patient, regional wall motion analysis was performed based on 2D images without contrast, 2D images with contrast enhancement, apical 2D image views reconstructed from 3D data sets, full-volume 3D images without contrast, and 3D images with contrast enhancement. The analysis of the 4 echocardiographic techniques in each patient was performed independently and in random order to prevent mutual bias. For each of the 17 LV segments defined by Cardiac Imaging Committee of the Council on Clinical Cardiology of the American Heart Association, regional systolic LV function was determined. For analysis of 2D and 3D echocardiographic images, a dedicated workstation was used (TomTec, Unterschleißheim, Germany) with application of Image Arena to analyze 2D data sets and 4D CardioView and 4D LV Analysis softwares for processing and analysis of 3D recordings.
Standard biplane cineventriculography was performed in all patients using a 30° right anterior oblique projection and a 60° left anterior oblique projection with injection of at least 30 ml of contrast medium at a flow rate of 12 to14 ml/s using 5Fr to 6Fr pigtail catheters. Frame rate was set at 30 Hz. Regional systolic LV function was determined for each of 7 segments (anterolateral, anterobasal, apical, posterobasal, posterolateral, diaphragmal, and septal).
ECG-triggered CMR investigations at a field strength of 1.5 T during breath hold were performed using a special volume-adapted surface coil. To assess LV function, standard steady-state free-precession cine imaging (spatial resolution 1.4 × 1.4 × 8 mm, 35 phases per cardiac cycle, repetition time 3.1 ms, echo time 1.6 ms, flip angle 55°) was performed in short repetitive end-expiratory breath holding. Four-chamber, 2-chamber, 3-chamber, and short-axis views with a slice thickness of 10 mm were acquired in basoapical direction using a special volume-adapted surface coil. Regional systolic function was determined for each of the 17 segments considering wall thickening during systole and endocardial inward motion.
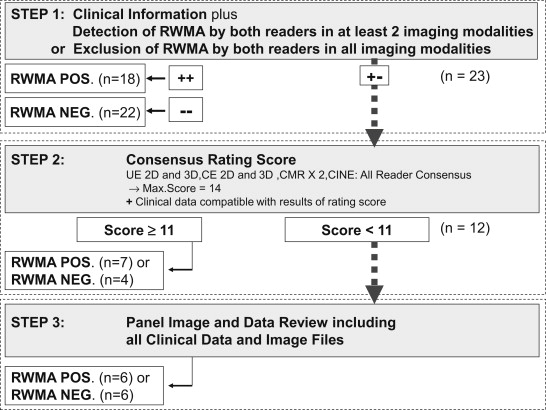
Considering even the limitations of CMR in the assessment of RWMA with considerable interobserver variability, an EPD on the presence of RWMA considering more information than only CMR was used. To define this standard of truth for the presence of RWMA, an EPD was made for each patient between 2 independent panelists (RH and SvB) based on clinical data (known cardiomyopathy, history of myocardial infarction, and previous revascularization procedure), electrocardiography, coronary angiography, and results of all off-site image readings. To define the standard of truth, the 2 panelists adhered to a predefined 3-step decision algorithm ( Figure 1 ). In the first step, they had to consider clinical information and the results of the given reads. Known cardiomyopathy, history of myocardial infarction in combination with ECG abnormalities, angiographically proved significant coronary artery disease or previous coronary revascularization, and RWMA in at least 2 imaging methods by both readers indicated evidence for RWMA. No history of myocardial infarction in combination with normal test results in electrocardiography, no previous coronary revascularization, angiographic exclusion of coronary artery disease, and in all imaging techniques, no RWMA by both readers were indicative for no RWMA. If no decision could be made based on the first step, the results of all imaging reads were considered in the second step. At least 11 points (1 point per reader, echocardiographic imaging technique, and cineventriculography reader and 2 points per CMR reader) on a consensus scale of 14 points had to be reached to obtain a result on the presence of an RWMA. This was obtained by consensus of at least 11 of the 14 readings (6 imaging techniques and 2 readers per imaging technique, 2 points per CMR reading to balance against the greater number of echocardiographic imaging techniques). Furthermore, clinical data had to be compatible with this result. In 12 cases, the achieved consensus score was inconclusive. In these cases, the 2 panelists were provided with all imaging cine loops for reassessment. Subsequently, the panelists reached a consensus agreement in all cases.
Statistical analysis was performed by MEDIDATA (Konstanz, Germany) using the SPSS software package (IBM SPSS Statistics, Armonk, New York). Continuous variables are presented as mean ± SD. The presence of RWMA is reported on a patient basis. To evaluate the diagnostic performance of each imaging technique in terms of detection of RWMA, sensitivity, specificity, and accuracy were estimated using the panel decision as the gold standard. Sensitivities, specificities, and accuracies were compared using McNemar test for dependent samples. The Cohen’s κ coefficient was calculated to evaluate IRA for each pair of readers. Cohen’s κ was also obtained to evaluate intermethod agreement on detection of RWMA evaluated by off-site reader 1 of each imaging technique. The same analyses were performed for the agreement between off-site reader and panel decision in terms of RWMA within each individual imaging technique. The Cohen’s κ coefficient of agreement was graded as follows: 0 to 0.2 = poor to slight; 0.21 to 0.4 = fair; 0.41 to 0.6 = moderate; 0.61 to 0.8 = substantial; 0.81 to 1.0 = nearly perfect. p Value <0.05 was considered statistically significant.
Results
Sixty-three patients (mean age 63.8 ± 10.4 years, 51 men) were included in this study. Patient characteristics are listed in Table 1 . In all patients, all imaging techniques were performed as per protocol. The SonoVue infusion rate needed for optimal image quality was 1.13 ± 0.19 ml/min. After receiving the contrast agent, 1 adverse event with hypotension was reported in 1 of the subjects.
| Characteristic | Value, n = 63 (%) |
|---|---|
| Age (yrs) | 63.8 ± 10.4 |
| History of previous myocardial infarction | 20 (32) |
| Previous percutaneous coronary intervention | 33 (52) |
| Previous coronary bypass surgery | 7 (11) |
| Significant coronary artery disease | 48 (76) |
| Coronary stenosis in left anterior descending | 35 (56) |
| Coronary stenosis in left circumflex branch | 40 (63) |
| Diabetes mellitus | 6 (10) |
| Hypertension | 44 (70) |
| Hypercholesterolemia | 21 (33) |
| Ejection fraction by cineventriculography | |
| <35% | 10 (16) |
| 35%–55% | 16 (25) |
| >55% | 37 (59) |
Table 2 lists the percentage of LV segments defined as nonevaluable. There was a significant difference between the imaging techniques in the percentage of LV segments defined as nonevaluable because of low image quality or insufficient endocardial border delineation. Although 3% to 12% of segments were nonevaluable with unenhanced 2D echocardiography and full-volume 3D analysis, up to 32% of segments were assessed as nonevaluable using reconstructed planes from the 3D full-volume data sets. Contrast enhancement resulted in a significant reduction of the number of segments found to be nonevaluable. Visibility of LV segments was found to allow analysis of segmental function in almost all cases using CMR. Contrast-enhanced 2D and 3D full-volume data set analyses reached a visibility of LV segments comparable with CMR.
| Variable | Imaging (%) | Contrast-Enhanced Imaging (%) | p |
|---|---|---|---|
| 2D echocardiography | |||
| Off-site 1 | 11.8 | 0.5 | |
| Off-site 2 | 2.9 | 1.1 | <0.001 |
| Reconstructed planes from 3D echocardiography | |||
| Off-site 1 | 31.5 | 3.0 | |
| Off-site 2 | 16.8 | 6.4 | <0.001 |
| 3D full-volume echocardiography | |||
| Off-site 1 | 6.3 | 3.6 | |
| Off-site 2 | 7.4 | 6.3 | <0.001 |
| Cardiac magnetic resonance | |||
| Off-site 1 | 2.2 | ||
| Off-site 2 | 1.8 | ||
| Cineventriculography | |||
| Off-site 1 | 9.7 | ||
| Off-site 2 | 1.2 |
Table 3 lists the frequency of RWMA detected with the 4 different echocardiographic imaging techniques as well as for cineventriculography and CMR for each of the 2 readers. Considering reader 1, in 16 patients, RWMA were detected by unenhanced 3D full-volume echocardiography but not by unenhanced 2D echocardiography, and in 6 patients, RWMA were detected by unenhanced 2D echocardiography but not by unenhanced 3D full-volume echocardiography. In 5 patients, RWMA were detected by contrast-enhanced 3D echocardiography but not by unenhanced 3D echocardiography, and in 15 patients, RWMA were detected by unenhanced 3D echocardiography but not by contrast-enhanced 3D echocardiography. The frequency of detected RWMA varied between the 2 readers of each imaging technique.
| Imaging Technique | Off-Site Reader 1 (%) | Off-Site Reader 2 (%) | p |
|---|---|---|---|
| Unenhanced 2D echocardiography | 61 | 45 | 0.116 |
| Reconstructed planes from unenhanced 3D echocardiography | 63 | 52 | 0.287 |
| Unenhanced 3D full-volume echocardiography | 76 | 41 | 0.007 |
| Contrast-enhanced 2D echocardiography | 56 | 42 | 0.113 |
| Reconstructed planes from contrast-enhanced 3D echocardiography | 60 | 46 | 0.149 |
| Contrast-enhanced 3D full-volume echocardiography | 61 | 41 | 0.053 |
| Cardiac magnetic resonance | 57 | 52 | 0.726 |
| Cineventriculography | 31 | 56 | <0.001 |
Stay updated, free articles. Join our Telegram channel

Full access? Get Clinical Tree


