The purpose of the present study was to evaluate the 3-year clinical outcomes after percutaneous coronary intervention with sirolimus-eluting stents in patients with insulin-treated diabetes mellitus (DM-insulin) and those with non–insulin-treated DM (DM–non-insulin) compared to patients without DM. Of 10,778 consecutive patients treated exclusively with sirolimus-eluting stents in the j-Cypher registry, we identified 996 patients with DM-insulin, 3,404 with DM–non-insulin, and 6,378 without DM. Compared to the non-DM group, the adjusted risk of a serious cardiovascular event (composite of all-cause death, myocardial infarction, and stroke) was significantly greater in the DM-insulin group (hazard ratio 1.12, 95% confidence interval [CI] 1.03 to 1.23; p = 0.01), but not in the DM–non-insulin group (hazard ratio 1.02, 95% CI 0.96 to 1.09; p = 0.47). The adjusted risk of target lesion revascularization was significantly greater in both the DM-insulin group (odds ratio 1.52, 95% CI 1.19 to 1.92; p = 0.0006) and the DM–non-insulin group (odds ratio 1.24, 95% CI 1.05 to 1.45; p = 0.009). In conclusion, a diabetes-associated excess risk of target lesion revascularization was found, regardless of insulin use in this large, real-world study of Japanese patients with sirolimus-eluting stent implantation. However, regarding serious cardiovascular events, an excess risk was seen only in the DM-insulin group. The risk of serious cardiovascular events was similar between the DM–non-insulin and non-DM groups.
The present study evaluated the effect of the presence of insulin-treated and non–insulin-treated diabetes mellitus (DM) on the incidence of serious cardiovascular events and repeated coronary revascularization after sirolimus-eluting stent (SES) implantation. We evaluated the 3-year clinical outcomes of patients with insulin-treated DM (DM-insulin) and non–insulin-treated DM (DM–non-insulin) relative to patients without DM in a large cohort who had undergone percutaneous coronary intervention (PCI) using SESs in a real-world clinical practice in Japan.
Methods
The design and patient enrollment of the j-Cypher registry has been previously published. In brief, the j-Cypher registry is a physician-initiated prospective, multicenter, prospective cohort study in Japan enrolling consecutive patients who have undergone SES implantation at 37 centers in Japan (see Supplemental Appendix A). The institutional review boards of all 37 participating centers approved the present study, and all patients provided written informed consent.
After SES implantation, dual antiplatelet treatment with aspirin plus a thienopyridine derivative (ticlopidine 200 mg/day or clopidogrel 75 mg/day) was to be maintained for ≥3 months. Thereafter, the decision regarding the duration of dual antiplatelet therapy was left to the discretion of each attending physician. Lifelong use of aspirin was recommended after the procedure.
Although the data entry was basically left to the individual sites, the clinical research coordinators (Supplemental Appendix B) at the data management center (Department of Cardiology, Kyoto University Hospital) supported the data entry when necessary. Logical inconsistencies were resolved by inquiries to the site investigators and/or by audits against the original data sources. Follow-up data were obtained from the hospital charts or by interviewing the patients or referring physicians at 30 days, 6 months, and 1 year after the procedure and yearly thereafter. When death, myocardial infarction, and stent thrombosis were reported, the events were adjudicated using the original source documents by a clinical events committee (Supplemental Appendix C). Adjudication of target lesion revascularization (TLR) events was left to the judgment of the local investigators.
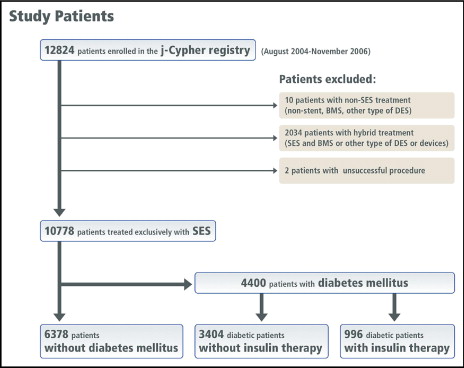
From August 2004 to November 2006, 12,824 patients (19,675 lesions) were enrolled in the j-Cypher registry, and 10,778 patients (14,811 lesions) who had been treated exclusively with SES implantation constituted the study population for the present analysis. Of these patients, 4,400 had DM and 6,378 did not (non-DM group). The patients with DM were stratified by DM treatment. The DM–non-insulin group included 3,404 patients without insulin therapy, and the DM-insulin group included 996 patients who required insulin ( Figure 1 ). Of the 3,404 patients with DM-non-insulin, 2,330 were treated with oral glucose-lowering drugs and 1,074 patients were treated without medication. In the present post hoc subanalysis of the j-Cypher registry, the baseline characteristics and clinical outcomes in the DM-insulin group and DM–non-insulin group were compared to those in the non-DM group. The primary outcome measure for the present analysis was serious cardiac events (a composite of all-cause death, myocardial infarction, and stroke) assessed at 3 years after SES implantation. The secondary outcome measure included the individual components of the primary outcome events, definite stent thrombosis, TLR, non-TLR, and any coronary revascularization.
DM was considered present if the fasting plasma glucose level was ≥126 mg/dl, the glucose level was >200 mg/dl at 2 hours after a 75-g oral glucose tolerance test, the casual plasma glucose level was >200 mg/dl, or the patient was taking antidiabetic medication. The diagnosis of DM and the use of insulin at the index SES implantation were reported by the site investigators.
Death was regarded as cardiac in origin unless obviously noncardiac causes could be identified. Any death during the index hospitalization was regarded as a cardiac death. Sudden death was defined as an unexplained death in a previously stable patient. Myocardial infarction was adjudicated according to the definition in the Arterial Revascularization Therapy Study. Within 1 week of the index procedure, only Q-wave myocardial infarction was adjudicated as myocardial infarction. TLR was defined as either PCI or coronary artery bypass grafting (CABG) because of restenosis or thrombosis of the target lesion, including the proximal and distal edge segments and the ostium of the side branches. Non-TLR was defined as coronary revascularization procedures, either PCI or CABG, other than TLR. Stent thrombosis was defined according to the Academic Research Consortium definition. Unless otherwise noted, definite stent thrombosis assessed on a patient-level basis was used as the end point for stent thrombosis.
Continuous variables are presented as the mean ± SD and categorical variables as numbers and percentages. Categorical variables were compared using the chi-square test. Continuous variables were compared using the t test or Wilcoxon rank-sum test based on the distribution. The incidence of the primary and secondary outcome measures was estimated using the Kaplan-Meier method, and differences were assessed using the log-rank test.
The adjusted risk of the primary outcome measure for the DM-insulin versus non-DM and DM–non-insulin versus non-DM groups was estimated using a multivariate Cox proportional hazard model by incorporating the variable DM-insulin or DM–non-insulin into the multivariate models with the 23 risk-adjustment variables listed in Supplemental Tables 1 and 2 . Continuous risk-adjustment variables were dichotomized according to the clinically meaningful reference values. The results are expressed as adjusted hazard ratios and their 95% confidence intervals (CIs). For the evaluation of the adjusted risk of TLR, a multivariate logistic regression model, instead of a Cox proportional hazard model, was used, because restenosis has been well known to be a time-related phenomenon. Also, the timing of TLR could have been highly influenced by the physicians’ and patients’ decisions. Using a logistic regression model, we could minimize the influence of the timing of TLR on the adjusted analysis for TLR. The patients included in the multivariate logistic regression model were the 1,882 patients who had undergone TLR within 3 years and the 2,415 patients who had completed 3 years of follow-up without TLR. The same independent variables used in the Cox proportional hazard model were incorporated into the multivariate logistic regression model. The results are expressed as the adjusted odds ratio and their 95% CIs. All analyses were conducted using JMP, version 7.1 (SAS Institute, Cary, North Carolina). All reported p values were 2-sided, and p <0.05 was considered significant.
Results
Compared to the patients without DM, the patients with DM-insulin and DM–non-insulin were younger, had a greater body mass index, and more often had hypertension, end-stage renal disease (including hemodialysis), heart failure, previous stroke, multivessel disease, and previous coronary revascularization procedures. Furthermore, those with DM-insulin were more often women, more often had peripheral vascular disease, and less often had a smoking habit or acute coronary syndrome than those without DM ( Table 1 ).
| Characteristic | Non-DM | DM-Non-Insulin | p Value ⁎ | DM-Insulin | p Value ⁎ |
|---|---|---|---|---|---|
| Patients (n) | 6,378 | 3,404 | 996 | ||
| Age (years) | 68.8 ± 10.6 | 67.9 ± 9.4 | <0.0001 | 66.7 ± 9.4 | <0.0001 |
| Age >80 years | 952 (15%) | 347 (10%) | <0.0001 | 63 (6%) | <0.0001 |
| Men | 4,867 (76%) | 2,585 (76%) | 0.68 | 671 (67%) | <0.0001 |
| Body mass index (%) | 23.7 ± 4.0 | 24.3 ± 3.7 | <0.0001 | 24.1 ± 3.4 | 0.0007 |
| Hypertension | 4,670 (73%) | 2,638 (78%) | <0.0001 | 761 (76%) | 0.03 |
| Current smoking | 1265 (20%) | 696 (21%) | 0.47 | 158 (16%) | 0.003 |
| Estimated glomerular filtration rate <30 ml/min/1.73 m 2 | |||||
| Without hemodialysis | 229 (3.7%) | 192 (6.0%) | <0.0001 | 101 (12%) | <0.0001 |
| With hemodialysis | 238 (3.7%) | 191 (5.6%) | <0.0001 | 165 (17%) | <0.0001 |
| Peripheral vascular disease | 697 (11%) | 409 (12%) | 0.11 | 170 (17%) | <0.0001 |
| Previous myocardial infarction | 1713 (27%) | 1,026 (30%) | 0.0006 | 285 (29%) | 0.25 |
| Previous stroke | 523 (8.2%) | 354 (10%) | 0.0003 | 130 (13%) | <0.0001 |
| Previous percutaneous coronary intervention | 2,962 (46%) | 1704 (50%) | 0.0006 | 513 (52%) | 0.003 |
| Previous coronary artery bypass grafting | 401 (6.3%) | 274 (8.1%) | 0.001 | 112 (11%) | <0.0001 |
| Heart failure | 718 (11%) | 511 (15%) | <0.0001 | 231 (23%) | <0.0001 |
| Acute coronary syndrome | 1403 (25%) | 734 (22%) | 0.62 | 171 (17%) | 0.0004 |
| ST-segment elevation myocardial infarction | 455 (7.1%) | 225 (6.6%) | 0.33 | 53 (5.3%) | 0.03 |
| Multivessel disease | 2,911 (46%) | 1884 (55%) | <0.0001 | 597 (60%) | <0.0001 |
| Triple-vessel disease | 594 (9.3%) | 498 (15%) | <0.0001 | 164 (17%) | <0.0001 |
| Unprotected left main | 356 (5.6%) | 206 (6.1%) | 0.34 | 73 (7.3%) | 0.03 |
| Lesions treated (n) | 1.34 ± 0.63 | 1.40 ± 0.68 | <0.0001 | 1.47 ± 0.76 | <0.0001 |
| Total stents (n) | 1.69 ± 0.98 | 1.81 ± 1.06 | <0.0001 | 1.95 ± 1.21 | <0.0001 |
| Total stent length (mm) | 37.3 ± 24.3 | 40.5 ± 26.4 | <0.0001 | 43.9 ± 29.6 | <0.0001 |
| Diabetes mellitus treatment | |||||
| Oral hypoglycemic agent | — | 2,330 (69%) | 92 (9%) | ||
| Insulin | — | — | 996 (100%) | ||
| Baseline medications | |||||
| Cilostazol | 207 (3.3%) | 100 (3.0%) | 0.43 | 44 (4.5%) | 0.07 |
| Statins | 3,057 (48%) | 1,687 (50%) | 0.08 | 474 (48%) | 0.87 |
| Angiotensin-converting enzyme inhibitors | 965 (15%) | 597 (18%) | 0.002 | 169 (17%) | 0.14 |
| Angiotensin II receptor blockers | 2,283 (36%) | 1,336 (40%) | 0.0004 | 407 (41%) | 0.002 |
| β Blockers | 1,692 (27%) | 1,012 (30%) | 0.0004 | 304 (31%) | 0.009 |
| Lesion characteristics | |||||
| Lesions (n) | 8,574 | 4,774 | 1,463 | ||
| Target lesion location | <0.0001 | <0.0001 | |||
| Left anterior descending | 3,673 (43%) | 1,944 (41%) | 521 (36%) | ||
| Left circumflex | 1,801 (21%) | 1,010 (21%) | 319 (22%) | ||
| Right | 2,758 (32%) | 1,610 (34%) | 545 (37%) | ||
| Left main | 278 (3.2%) | 160 (3.4%) | 61 (4.2%) | ||
| Saphenous vein graft | 51 (0.6%) | 43 (0.9%) | 15 (1.0%) | ||
| Lesion length ≥30 mm | 1,135 (13%) | 741 (16%) | 0.0004 | 270 (19%) | 0.0001 |
| Reference diameter <2.5 mm | 2,268 (27%) | 1438 (30%) | <0.0001 | 490 (34%) | <0.0001 |
| In-stent restenosis | 1,074 (13%) | 625 (13%) | 0.36 | 196 (13%) | 0.36 |
| Chronic total occlusion | 734 (8.6%) | 478 (10%) | 0.006 | 136 (9.3%) | 0.36 |
| Severe calcium | 656 (7.7%) | 454 (9.5%) | 0.0002 | 201 (14%) | 0.0001 |
| Bifurcation lesion | 1743 (20%) | 848 (18%) | 0.0003 | 266 (18%) | 0.054 |
| Total stent length per lesion (mm) | 28.1 ± 14.8 | 29.2 ± 15.8 | <0.0001 | 30.3 ± 16.5 | 0.0001 |
| Minimal stent size (mm) | 2.91 ± 0.37 | 2.87 ± 0.37 | <0.0001 | 2.83 ± 0.36 | 0.0001 |
| Postdilation | 3,755 (44%) | 2048 (43%) | 0.29 | 688 (48%) | 0.01 |
| Maximum inflation pressure (atm) | 17.9 ± 4.4 | 18.3 ± 4.2 | 0.006 | 18.6 ± 4.4 | 0.0004 |
The patients with DM-insulin and DM–non-insulin had more complex lesion and procedural characteristics, such as long lesions, small vessel size, severe calcification, longer total stent length, and greater final inflation pressure, than the patients without DM.
The cumulative incidence of the clinical events through 3 years is listed in Table 2 ( Supplemental Table 3 ). The crude incidence of serious cardiovascular events (i.e., all-cause death, myocardial infarction, and stroke) was significantly greater in the DM-insulin group than in the non-DM group. However, although the cumulative incidence of serious cardiovascular events in the DM–non-insulin group tended to be greater than that in the non-DM group, the difference did not reach statistical significance ( Figure 2 ). After adjusting for the confounders using the multivariate Cox proportional hazard model, the risk of DM-insulin versus non-DM for serious cardiovascular events remained significant (hazard ratio 1.12, 95% CI 1.03 to 1.23; p = 0.01). However, after adjusting for the confounders, a trend was no longer seen for the excess risk of DM–non-insulin versus non-DM for serious cardiovascular events (hazard ratio 1.02, 95% CI 0.96 to 1.09; p = 0.47; Supplemental Table 1 ).
| Event | Non-DM (n = 6,378) | DM-Non-Insulin (n = 3,404) | p Value ⁎ | DM-Insulin (n = 996) | p Value ⁎ |
|---|---|---|---|---|---|
| Death/myocardial infarction/stroke | 649 (12.7%) | 392 (13.8%) | 0.057 | 185 (22.3%) | <0.0001 |
| All-cause death | 412 (8.2%) | 267 (9.3%) | 0.01 | 132 (16.2%) | <0.0001 |
| Cardiac death | 203 (3.8%) | 135 (4.6%) | 0.046 | 62 (8.1%) | <0.0001 |
| Associated with heart failure | 58 (1.1%) | 44 (1.5%) | 0.08 | 19 (2.7%) | 0.003 |
| Associated with myocardial infarction | 17 (0.3%) | 19 (0.7%) | 0.02 | 6 (0.6%) | 0.07 |
| Sudden death | 76 (1.5%) | 39 (1.4%) | 0.85 | 25 (3.5%) | 0.0007 |
| Myocardial infarction | 124 (2.7%) | 61 (2.5%) | 0.57 | 26 (2.9%) | 0.14 |
| Stroke | 193 (3.7%) | 110 (4.0%) | 0.57 | 51 (6.6%) | <0.0001 |
| Stent thrombosis | |||||
| Definite | 57 (1.2%) | 32 (1.2%) | 0.84 | 12 (1.3%) | 0.33 |
| Definite/probable | 65 (1.4%) | 38 (1.4%) | 0.67 | 13 (1.4%) | 0.39 |
| Definite/probable/possible | 153 (3.1%) | 84 (3.1%) | 0.84 | 41 (5.1%) | 0.001 |
| Target lesion revascularization | 535 (10.2%) | 394 (13.8%) | <0.0001 | 168 (19.3%) | <0.0001 |
| Coronary artery bypass graft | 85 (1.8%) | 57 (2.0%) | 0.17 | 19 (2.4%) | 0.13 |
| Nontarget lesion revascularization | 1,199 (22.1%) | 815 (28.1%) | <0.0001 | 274 (32.8%) | <0.0001 |
| Any revascularization | 1,481 (27.2%) | 999 (34.0%) | <0.0001 | 346 (40.1%) | <0.0001 |
Stay updated, free articles. Join our Telegram channel

Full access? Get Clinical Tree


