The effects of aging and of sustained athletic activity on the heart in men aged >50 years are unknown. The aim of this study was to assess the adaptation of the heart in athletic and sedentary men aged <35 and ≥50 years. Echocardiograms recorded at rest and during submaximal exercise were analyzed in 59 athletic seniors (S ATH group) and 16 sedentary seniors (S SED group) (age ≥50 years) and in 18 athletic youth (Y ATH group) and 27 sedentary youth (Y SED group) (age <35 years). All subjects were healthy. The reproducibility of measurements was examined, and the echocardiographic characteristics were compared among the study groups. No differences were found in baseline characteristics between the Y ATH and Y SED groups and between the S ATH and S SED groups, except for their exercise routines, consisting of >8 hours of bicycling per week in the athletic groups. Left ventricular mass was greater in the Y ATH than in the S ATH group (p <0.01) and greater in the S ATH than in the S SED group (p <0.001). Likewise, left ventricular volumes were greater in the athletic than in the sedentary groups (p <0.05), although they were smaller in the seniors than in youth (p <0.01). Left ventricular stroke volume was greater in the athletic than in the sedentary groups (p <0.001); global longitudinal strain during exercise was −20.0 ± 2.4% in the S ATH group and −22.1 ± 2.1% in the Y ATH group, compared to −19.2 ± 3.4% in the S SED group and −20.2 ± 2.4% in the Y SED group (p <0.05, athletic vs sedentary). The e′ velocities recorded at the septal and lateral mitral annulus were higher at rest and during exercise (p <0.01) in the youth than in the senior groups. In conclusion, systolic and diastolic myocardial adaptation to regular exercise was significantly more prominent in young than in senior volunteers.
Echocardiography can be used to study the morphologic and functional properties of cardiac tissues at rest and during exercise. The contributions of exercise echocardiography have been used mostly in the investigation of coronary artery and valvular diseases. New algorithms based on speckle tracking have enabled accurate measurements of myocardial function and analysis of longitudinal myocardial deformation. The aim of this study was to compare the echocardiographic characteristics of myocardial adaptation at rest and during submaximal exercise in healthy, athletic versus sedentary volunteers aged <35 versus ≥50 years.
Methods
This study was conducted in prospectively enrolled healthy volunteers. Potential subjects were excluded if they (1) had histories of heart disease or cardiac rhythm disturbance, (2) had >1 cardiovascular risk factor, (3) had abnormal electrocardiographic results, (4) were unable to undergo exercise stress echocardiography or developed arrhythmias during the tests, or (5) had echocardiograms limited by unsatisfactory acoustic windows. The 98 healthy men ultimately included in this study provided written informed consent. The study was reviewed and approved by our institutional ethics committee and was in compliance with the Declaration of Helsinki.
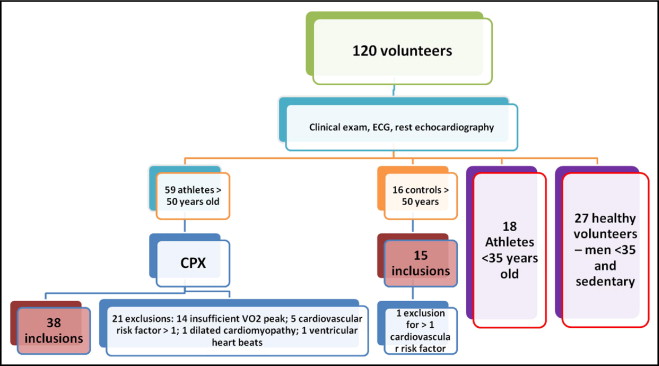
The study population was divided into groups of sedentary subjects (<2 hours of physical training per week) and trained subjects (>8 hours of cycling per week for ≥5 years). Thus, the included population was divided into 4 groups: (1) 27 sedentary subjects aged < 35 years (the Y SED group), (2) 15 sedentary subjects aged ≥50 years (the S SED group), (3) 18 trained subjects aged <35 years (the Y ATH group), and (4) 38 trained subjects aged ≥50 years (the S ATH group).
To confirm eligibility to enter the study, each subject underwent (1) a medical history relating to cardiac symptoms, including chest pain, dyspnea disproportionate to the level of exercise performed, palpitation, dizziness, and exertional syncope as well as a family history of premature (age <40 years) cardiac disease or sudden cardiac death; (2) a physical examination with a focus on the cardiovascular system; and (3) rest electrocardiography and transthoracic echocardiography. The athletes underwent maximum exercise stress testing on a cycle ergometer, including analysis of V o 2 to verify that they could achieve peak V o 2 >130% of the theoretical value for age.
Echocardiographic studies at rest and during exercise were performed by the same physician, according to the recommendations issued by the European Association of Echocardiography, using Vivid 7 instrumentation (GE Vingmed Ultrasound AS, Horten, Norway) equipped with a multifrequency 2.5-MHz probe for M-mode and 2-dimensional imaging, Doppler recordings, tissue Doppler imaging, and myocardial deformation characterization by speckle-tracking techniques. Loops were recorded in the parasternal long- and short-axis views and apical 4-, 5-, 3-, and 2-chamber views. The frame rate was optimized to 70 to 80 Hz, and the endocardial and epicardial border definition was the highest possible. All image loops were stored for 3 to 5 cycles for post hoc analyses, using EchoPAC PC version 6.3.6 (GE Vingmed Ultrasound AS). The following measurements were made: (1) left ventricular (LV) diameter and wall thickness were measured via time-movement analysis, and LV mass was calculated; (2) mitral filling and diastolic function via pulsed Doppler transmitral profiling, including E and A waves, E/A ratio, E-wave deceleration time, isovolumic relaxation time, and mitral annular Doppler tissue measurements of e′ and s′ waves and E/e′ ratio ; (3) global systolic function and the LV ejection fraction by Simpson’s 2-dimensional method and the peak of the s′ wave at the mitral annulus using Doppler tissue imaging; and (4) regional LV function in the radial, circumferential, and longitudinal directions with 2-dimensional strain (speckle-tracking approach; EchoPAC). For this analysis of myocardial deformation, loops were recorded in standard B mode, using 70- to 80-Hz cadence images. The software tracks the positional changes of natural myocardial acoustic markers (speckles) in a predefined region of interest in a series of images corresponding to a single cardiac cycle. Global longitudinal strain (GLS) was calculated from the 3 apical views.
The measurements made during exercise echocardiography were the same as those made at rest. Exercise testing was performed on a tilt table at 60°, using an Ergometrics electromagnetic ergometer (Ergoline GmbH, Bitz, Germany). The tests were performed in increments of 30 W/2 min, at a rate of approximately 60 rpm. Comparisons between subjects were made with data collected at a heart rate of 120 beats/min or at the highest heart rate reached. Using the rest and exercise echocardiographic measurements, indexes of functional reserve were calculated to examine the effects of exercise on the myocardial response: (1) systolic LV longitudinal functional reserve was calculated using LV pulse tissue Doppler S′ wave as ΔS′ (exercise − rest condition) × (1 − 1/s′ at rest) and using GLS as ΔGLS (exercise − rest) × (1 − 1/GLS at rest); (2) LV early diastolic longitudinal reserve using the early diastolic peak velocity recorded at the mitral annulus e′; (3) Δe′ (exercise − rest condition) × (1 − 1/e′ at rest). Because deformation imaging is influenced by geometry, we also analyzed the ratio between LV GLS and LV end-systolic volume.
Subjects underwent progressive exercise in increments of 30 W/2 min, to maximal effort, on an electromagnetic ergometer at a rate of 60 and 65 rpm. Gas exchange was measured using an Oxycon analyzer (Eric Jaeger, Hoechberg, Germany) and maximum oxygen flow. Individual peak V o 2 values were calculated and compared to theoretical values. Subjects who were able to exercise to >165% of predicted peak V o 2 max were included in the final statistical analysis.
Quantitative results are expressed as mean ± SD. Intra- and interobserver reproducibility concerning rest and exercise echocardiographic measurements was evaluated by calculating a coefficient of variation between 2 parameters measured respectively by the same observer (T.R.) and by 2 different observers (T.R. and F.S.). The reproducibility of echocardiographic measurements was studied in 10 of our subjects randomly, using images recorded during 2 echocardiographic examinations made a few days apart. Comparisons between groups for baseline characteristics and echocardiographic values at rest and during exercise were made by analysis of variance, followed when appropriate by Bonferroni’s test. A p value <0.05 was considered statistically significant.
Results
The flow of subjects between screening and final inclusion in the study is shown in Figure 1 .
Systolic and diastolic blood pressures at rest were similar in the S ATH and S SED groups, although they were significantly higher (p <0.001) in seniors than in youth ( Table 1 ). Similar observations were made during exercise. Heart rates at rest were slower in the athletic groups than in the sedentary groups. We observed no significant differences in heart rate during submaximal exercise among the 4 study groups ( Table 1 ).
| Variable | Athletes | Sedentary | ||
|---|---|---|---|---|
| Seniors | Youth | Seniors | Youth | |
| Age (years) | 61.5 ± 5.6 ⁎ | 25.2 ± 5.0 | 58.9 ± 8.6 ⁎ | 26.2 ± 3.1 |
| Weight (kg) | 72.3 ± 6.3 | 69.8 ± 7.1 † | 78 ± 12.6 | 71.8 ± 8.6 |
| Height (m) | 1.73 ± 0.1 ‡ | 1.8 ± 0.1 | 1.75 ± 0.1 | 1.8 ± 0.1 § |
| Body surface area (m 2 ) | 1.85 ± 0.1 | 1.9 ± 0.1 | 1.9 ± 0.2 | 1.9 ± 0.1 |
| Workload (W) | ||||
| Maximal | 250 ± 47 ∥ | 396 ± 17 ¶ | 136 ± 47 | 220 ± 65 |
| At 120 beats/min | 110 ± 30 | 133 ± 31 # | 90 ± 30 | 103 ± 20 |
| Blood pressure (mm Hg) | ||||
| Systolic | ||||
| Rest | 137 ± 10 ⁎ | 123 ± 12 | 141 ± 12 ⁎ | 125 ± 11 |
| Exercise | 196 ± 20 ⁎⁎ | 178 ± 26 | 203 ± 22 †† | 156 ± 19 |
| Diastolic | ||||
| Rest | 80.2 ± 8.2 | 66.4 ± 9.5 ¶ | 82.5 ± 6.6 | 81.6 ± 15.2 |
| Exercise | 91.0 ± 9.7 | 78.2 ± 8.2 # | 95.4 ± 9.8 | 91.8 ± 17.2 |
| RR interval (ms) | ||||
| Rest | 925 ± 152 | 1,113 ± 192 ¶ | 912 ± 120 | 887 ± 105 |
| Exercise | 542 ± 41 | 547 ± 27 | 550 ± 65 | 515 ± 30 |
| Peak V o 2 (ml/min/kg) | 47.8 ± 5.7 ‡‡ | 69.0 ± 5.8 | — | — |
| % peak V o 2 max | 165.1 ± 19.1 | 167.6 ± 17.4 | — | — |
| Maximal heart rate (beats/min) | 163 ± 22 | 162 ± 40 | — | — |
Echocardiographic observations are listed in Tables 2 and 3 . End-diastolic interventricular septal thickness was significantly greater (p <0.01) in the athletic groups than in the sedentary groups ( Table 2 ). LV end-diastolic diameter at rest and during exercise was significantly greater (p <0.001) in the Y ATH group than in the other 3 groups ( Table 2 ).
| Variable | Athletes | Sedentary | ||
|---|---|---|---|---|
| Seniors | Youths | Senior | Youths | |
| Interventricular thickness in end-diastole (cm) | ||||
| Rest | 1.1 ± 0.1 ⁎ | 1.1 ± 0.1 ⁎ | 0.9 ± 0.1 | 0.8 ± 0.2 |
| Exercise | 1.1 ± 0.1 † | 1.1 ± 0.1 | 1.0 ± 0.1 | 0.9 ± 0.1 ‡ |
| LV dimensions | ||||
| Posterior wall in end-diastole (cm) | ||||
| Rest | 1.1 ± 0.1 § | 1.1 ± 0.1 | 1.0 ± 0.2 | 0.8 ± 0.1 ∥ |
| Exercise | 1.1 ± 0.1 | 1.1 ± 0.1 | 1.0 ± 0.1 | 0.9 ± 0.1 ∥ |
| End-diastolic diameter (cm) | ||||
| Rest | 4.8 ± 0.4 | 5.3 ± 0.4 ¶ | 4.7 ± 0.4 | 4.6 ± 0.4 |
| Exercise | 4.8 ± 0.4 | 5.4 ± 0.4 ¶ | 4.8 ± 0.4 | 4.6 ± 0.4 |
| End-systolic diameter (cm) | ||||
| Rest | 3.3 ± 0.4 | 3.6 ± 0.4 # | 3.4 ± 0.4 | 3.1 ± 0.4 |
| Exercise | 3.0 ± 0.5 | 3.4 ± 0.4 | 3.0 ± 0.4 | 2.7 ± 0.4 |
| End-diastolic volume (ml) | ||||
| Rest | 120.5 ± 20.6 | 157.3 ± 23.6 ¶ | 117.5 ± 23.2 | 116.8 ± 21.2 |
| Exercise | 128.2 ± 18.3 § | 159.2 ± 20.8 ¶ | 109.2 ± 26.8 | 122.8 ± 17.0 |
| End-systolic volume(ml) | ||||
| Rest | 46.6 ± 11.4 | 57.0 ± 12.5 ⁎⁎ | 43.7 ± 12.0 | 43.3 ± 13.1 |
| Exercise | 39.7 ± 9.0 § | 45.1 ± 7.7 ‡ ‡ | 31.3 ± 12.8 †† | 35.3 ± 10.0 |
| Stroke volume (ml) | ||||
| Rest | 74.0 ± 14.5 | 97.4 ± 20.3 §§ | 76.2 ± 14.3 | 81.5 ± 17.3 |
| Exercise | 88.8 ± 15.9 | 115.9 ± 21.4 ¶ | 79.8 ± 16.4 | 81.8 ± 15.3 |
| Ejection fraction (%) | ||||
| Rest | 61.4 ± 6.0 | 63.6 ± 7.2 | 62.8 ± 6.8 | 63.3 ± 6.0 |
| Exercise | 68.9 ± 5.9 | 71.4 ± 5.1 | 72.1 ± 6.9 | 71.5 ± 6.1 |
| Mass index | 104.7 ± 17.2 ∥∥ | 123.1 ± 19.7 §§ | 79.3 ± 15.7 | 66.9 ± 13.2 |
| Left atrial volume (ml) | ||||
| Rest | 42.7 ± 13.5 | 57.1 ± 14.6 ¶¶ | 46.8 ± 14.2 | 35.2 ± 14.0 |
| Exercise | 53.6 ± 12.1 | 62.6 ± 17.5 | 53.4 ± 15.1 | 36.1 ± 11.6 ## |
| Cardiac output (L/min) | ||||
| Rest | 4.9 ± 1.2 | 5.4 ± 0.8 | 5.1 ± 0.9 | 5.6 ± 1.6 |
| Exercise | 9.7 ± 1.8 | 13.0 ± 2.2 ¶ | 8.8 ± 1.8 | 9.5 ± 1.7 |
| S′ (cm/s) | ||||
| Septal | ||||
| Rest | 8.2 ± 1.6 ⁎⁎⁎ | 9.0 ± 1.6 | 9.5 ± 1.8 | 9.8 ± 2.0 |
| Exercise | 13.4 ± 4.1 | 13.1 ± 2.2 | 12.7 ± 3.6 | 14.0 ± 2.5 |
| Lateral | ||||
| Rest | 10.1 ± 2.7 ††† | 11.9 ± 2.8 | 10.9 ± 2.2 | 13.0 ± 3.4 |
| Exercise | 14.4 ± 2.7 | 16.6 ± 3.6 | 13.8 ± 3.5 | 17.1 ± 3.6 |
| Mean strain (%) | ||||
| Radial | ||||
| Rest | 41.4 ± 11.2 | 38.7 ± 7.8 | 41.9 ± 10.6 | 44.1 ± 11.0 |
| Exercise | 48.2 ± 13.0 | 51.8 ± 6.8 | 44.9 ± 13.1 | 51.9 ± 15.2 |
| Circumferential | ||||
| Rest | −15.9 ± 3.8 | −17.4 ± 3.3 | −16.2 ± 3.9 | −15.9 ± 8.5 |
| Exercise | −19.1 ± 4.1 | −21.8 ± 2.6 | −19.0 ± 4.2 | −18.5 ± 9.5 |
| Longitudinal | ||||
| Rest | −17.3 ± 2.2 | −17.0 ± 1.3 | −18.0 ± 2.4 | −17.7 ± 1.6 |
| Exercise | −20.0 ± 2.4 | −22.1 ± 2.1 ⁎⁎ | −19.2 ± 3.4 | −20.2 ± 2.4 |
| Δ rest to exercise longitudinal strain | −2.7 ± 2.4 | −5.1 ± 2.0 §§ | −1.2 ± 2.5 | −2.6 ± 2.1 |
| Strain long/LV eSV | ||||
| Rest | −0.4 ± 0.1 | −0.3 ± 0.1 ‡‡ | −0.4 ± 0.2 | −0.4 ± 0.1 |
| Exercise | −0.5 ± 0.1 § | −0.5 ± 0.1 ‡‡‡ | −0.7 ± 0.4 | −0.6 ± 0.3 |
| Systolic reserve | ||||
| Sa wave | 8.9 ± 4.9 | 8.3 ± 5.0 | 6.3 ± 4.1 | 7.7 ± 4.6 |
| Longitudinal strain | 2.6 ± 2.2 | 4.8 ± 1.9 ⁎⁎ | 1.2 ± 2.4 | 2.8 ± 1.9 |
⁎ p <0.001, athletes vs sedentary;
∥∥ p <0.001, S ATH vs seniors;
¶¶ p <0.01, Y ATH vs S ATH and Y SED ;
| Athletes | Sedentary | |||
|---|---|---|---|---|
| Seniors | Youths | Senior | Youths | |
| LV diastolic function | ||||
| Wave (cm/s) | ||||
| E rest | 61.5 ± 13.3 ⁎ | 76.5 ± 13.9 | 71.5 ± 17.0 | 77.5 ± 17.8 |
| E exercise | 115.5 ± 23.0 | 133.1 ± 20.3 † | 109.4 ± 15.8 | 121.7 ± 26.3 |
| A rest | 59.7 ± 13.8 ‡ | 39.6 ± 9.0 | 68.0 ± 19.4 ‡ | 48.0 ± 12.7 |
| A exercise | 102.5 ± 23.2 | 96.3 ± 29.4 | 108.6 ± 13.0 | 107.0 ± 20.5 |
| E/A rest | 1.1 ± 0.3 | 2.0 ± 0.4 § | 1.1 ± 0.5 | 1.7 ± 0.5 ∥ |
| E/A exercise | 1.2 ± 0.4 | 1.5 ± 0.6 § | 1.0 ± 0.2 | 1.2 ± 0.2 |
| TDE (ms) | ||||
| Rest | 223.4 ± 39.4 | 204.2 ± 42.6 | 228.5 ± 46.3 | 196.6 ± 49.2 |
| Exercise | 142.1 ± 42.8 | 138.6 ± 63.4 | 139.0 ± 45.5 | 137.5 ± 29.8 |
| E/e′ | ||||
| Septal rest | 7.3 ± 2.3 ¶ | 5.3 ± 1.9 | 7.1 ± 1.8 # | 5.4 ± 1.0 |
| Septal exercise | 7.4 ± 2.4 | 6.8 ± 2.5 | 6.9 ± 2.1 | 6.4 ± 2.0 |
| Lateral rest | 5.1 ± 1.8 | 3.6 ± 1.3 # | 5.2 ± 1.5 | 4.5 ± 1.0 |
| Lateral exercise | 6.6 ± 2.1 ⁎⁎ | 5.2 ± 1.7 | 5.5 ± 0.9 | 5.3 ± 1.4 |
| e′ (cm/s) | ||||
| Septal rest | 8.6 ± 2.6 †† | 13.9 ± 2.2 | 10.3 ± 1.9 †† | 14.4 ± 2.9 |
| Septal exercise | 16.9 ± 4.4 | 19.5 ± 5.4 | 16.3 ± 6.5 | 19.6 ± 2.6 |
| Lateral rest | 12.4 ± 2.9 ¶ | 20.7 ± 3.9 | 14.3 ± 3.3 ¶ | 17.7 ± 4.6 |
| Lateral exercise | 18.5 ± 4.4 ‡ | 24.8 ± 3.7 | 18.5 ± 4.6 ‡ | 23.3 ± 3.3 |
| Mean rest | 10.5 ± 2.3 †† | 17.3 ± 2.4 | 12.3 ± 2.3 †† | 16.0 ± 3.4 |
| Mean exercise | 17.7 ± 4.0 ‡ | 22.1 ± 3.8 | 17.4 ± 5.3 ‡ | 21.4 ± 2.2 |
| a′ (cm/s) | ||||
| Septal rest | 10.2 ± 2.5 ‡ | 7.3 ± 1.4 | 11.1 ± 2.9 ‡ | 8.1 ± 1.8 |
| Septal exercise | 16.5 ± 5.3 | 13.9 ± 4.7 | 14.9 ± 4.1 | 13.0 ± 3.9 |
| Lateral rest | 11.5 ± 2.6 ¶ | 7.0 ± 2.0 | 11.2 ± 2.3 ¶ | 8.7 ± 3.6 |
| Lateral exercise | 18.5 ± 10.6 | 15.0 ± 4.3 | 16.1 ± 4.6 | 13.4 ± 3.8 |
| Diastolic reserve (e′ wave) | 13.6 ± 7.4 | 9.4 ± 7.4 | 9.8 ± 9.0 | 10.2 ± 5.8 |
| Right ventricular function | ||||
| Tricuspid annular plane systolic excursion (cm) | ||||
| Rest | 23.5 ± 5.2 | 25.4 ± 3.0 † | 20.5 ± 5.7 | 24.0 ± 3.4 |
| Exercise | 30.6 ± 4.2 | 30.7 ± 2.8 | 24.9 ± 7.2 ‡‡ | 30.0 ± 4.4 |
| Peak 2-dimensional free wall strain | ||||
| Rest | −26.4 ± 8.2 | −27.1 ± 5.2 | −24.4 ± 5.0 | −25.9 ± 7.1 |
| Exercise | −25.2 ± 6.0 | −26.6 ± 5.6 | −24.8 ± 8.4 | −27.1 ± 16.9 |
| e′ wave RV (cm/s) | ||||
| Rest | 11.4 ± 3.4 | 15.3 ± 3.3 | 12.3 ± 3.5 | 15.4 ± 2.2 |
| Exercise | 26.0 ± 8.0 ¶ | 26.6 ± 5.6 | 22.2 ± 7.3 ¶ | 23.8 ± 3.4 |
| Sa wave (cm/s) | ||||
| Rest | 13.0 ± 2.1 | 14.7 ± 2.3 | 13.4 ± 1.8 | 14.4 ± 2.5 |
| Exercise | 19.2 ± 3.7 | 19.1 ± 3.1 | 19.4 ± 2.4 | 19.8 ± 2.9 |
| RV area | ||||
| Rest | 11.7 ± 1.8 | 12.9 ± 2.7 | 11.5 ± 2.4 | 11.1 ± 3.5 |
| Exercise | 11.8 ± 2.5 | 12.4 ± 2.5 | 10.8 ± 2.2 | 9.1 ± 2.3 §§ |
| RVd | ||||
| Rest | 20.1 ± 2.7 | 23.6 ± 4.1 ∥∥ | 20.5 ± 3.7 | 20.5 ± 3.9 |
| Exercise | 21.0 ± 3.2 | 25.1 ± 5.1 § | 21.4 ± 4.0 | 19.3 ± 3.5 |
Stay updated, free articles. Join our Telegram channel

Full access? Get Clinical Tree


