Obesity has been identified as a risk factor for postoperative atrial fibrillation (POAF) after coronary artery bypass grafting (CABG). However, no studies have addressed the influence of race on this association. A total of 13,594 patients undergoing first-time, isolated CABG without preoperative AF between 1992 and 2011 were included in our study. The association between body mass index and POAF was compared by race. Relative risk and 95% CIs were computed using maximum likelihood log-binomial regression. Increasing levels of body mass index were associated with higher POAF risk after CABG in black but not white patients (p interaction = 0.0009).
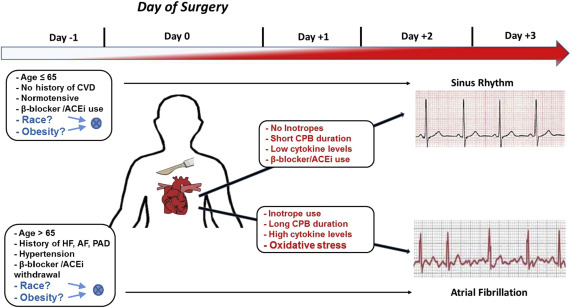
Postoperative atrial fibrillation (POAF) is a common complication after coronary artery bypass grafting (CABG), and obesity is a well-established risk factor for developing POAF. However, no studies have addressed the differential influence of race on this association ( Figure 1 ). Recently, increased body mass index (BMI) has been shown to be a stronger predictor for incident AF in blacks compared with whites in the general population. To our knowledge, a similar finding has not been examined in patients undergoing CABG. This is important as black patients who develop POAF are at increased risk for mortality after CABG. Identifying high-risk groups for POAF will allow for the development of targeted interventions to reduce mortality, hospital readmissions, and total hospital costs in patients with CABG. Similar to the general nonsurgical obese population, we hypothesized that obese black patients undergoing CABG are at a higher risk for developing POAF.
Methods
This was a retrospective cohort study of patients undergoing first-time, isolated CABG at the East Carolina Heart Institute between 1992 and 2011. Patient demographics, medical history and/or co-morbidities, preoperative medications, and operative data were collected at the time of surgery. Patients with POAF were compared with those without POAF. Only black and white patients were included to minimize the potential for residual confounding (∼1% other races). Racial identity was self-reported. The study and a waiver of participant consent for the period from 1992 to 2011 was approved by the Institutional Review Board at the Brody School of Medicine, East Carolina University (UMCIRB 12-002107).
Clinical variables were defined according to standard Society of Thoracic Surgeons (STS) protocol and documented by hospital notes, medication reports, outpatient medical records, radiology readings, and physician documentation.
POAF denoted a first-time episode of AF (chaotic/irregular atrial rhythm with a variable rate and irregular ventricular rhythm) lasting longer than 1 hour after surgery and requiring treatment. Patients with a history of preoperative paroxysmal, persistent, or permanent AF/atrial flutter were excluded.
The World Health Organization classification of BMI was used to group obesity into 3 classes. Nonobese patients were designated as the reference group for statistical comparisons. Underweight patients have a known risk profile for adverse cardiac outcomes and mortality and were excluded from our analysis to minimize confounding bias (n = 102).
Data for this study were obtained from the STS Adult Cardiac Surgery Database and the electronic medical record (EMR) at the Brody School of Medicine. Cardiovascular surgery information at our facility was first reported to the STS in 1989 with routine data submission starting in 1992. An EMR was introduced at the Brody School of Medicine in 1997. Patient information and clinical data from 1989 to 1997 were retrospectively scanned into the EMR. The STS database is linked to the EMR through a unique patient medical record number. The National Death Index, using social security numbers, was used to validate operative mortality information in our EMR. However, in accordance with §205(r) of the Social Security Act, the use of social security numbers was proscribed within our university system at the end of 2011.
Categorical variables were expressed as frequency and percentage, whereas continuous variables were reported as median and interquartile range. Statistical significance (p <0.05) for categorical variables was computed using the Fisher’s exact test and the Deuchler–Wilcoxon procedure for continuous variables. Trend across categories of obesity was computed using an exact Cochran–Armitage trend test. An iterative expectation-maximization algorithm was used to account for missing BMI values (<0.01%; imputation efficiency >99.9%).
Log-binomial regression was used to directly estimate relative risk and 95% CIs for POAF. Goodness-of-fit was assessed by examining Akaike’s Information Criteria and leverage/casewise diagnostic statistics, generalized to log-binomial regression. p Values for the interaction between race and obesity level was computed using a likelihood ratio test by entering the appropriate cross-term into our regression models. All models achieved convergence and satisfied admissibility criteria (i.e., linear predictor constrained to be negative).
The initial multivariable models included variables in our data set that have been previously associated with POAF in the literature, regardless of their statistical significance in the current analysis (e.g., patient age, diabetes mellitus, heart failure, hypertension, obesity, peripheral artery disease, gender, and 3-vessel coronary disease). Post hoc inclusion of other medical history and/or co-morbidities and preoperative medications into the model was performed in a pairwise fashion. p Values for point estimates were computed assuming asymptotic normality. Rounding was performed using the method of Holly and Whittemore. SAS, version 9.4 (Cary, NC) was used for all analyses.
Results
A total of 13,594 patients were included in the study (48% age >65 years, 70% men, 17% blacks; Table 1 ). A greater percentage of black patients were diabetic, hypertensive, and used angiotensin-converting enzyme inhibitors/angiotensin receptor blockers (ACEi/ARBs), β blockers, diuretics, and lipid-lowering agents as preoperative medications (p <0.0001). In contrast, a greater percentage of white patients were men and preoperatively used antiplatelet agents (p <0.0001). A decreasing trend of digitalis use and an increasing trend of ACEi/ARB and β-blocker use with increasing obesity severity was observed for white (p trend <0.0001) but not black patients (p trend >0.05). Adjusting for age and sex in our total sample, POAF was significantly associated with obesity (p = 0.0019) and white race (p <0.0001), which is consistent with previous research (not shown in tables).
| Patient Characteristics | Black | White | ||||||||
|---|---|---|---|---|---|---|---|---|---|---|
| Non-Obese | Obesity Class § | P trend ‡ | Non-Obese | Obesity Class § | P trend ‡ | |||||
| I | II | III | I | II | III | |||||
| Overall | 1165 (50%) | 734 (32%) | 277 (12%) | 153 (7%) | — | 6846 (61%) | 3073 (27%) | 939 (8%) | 407 (4%) | — |
| Demographics | ||||||||||
| Age (>65) | 532 (46%) | 293 (40%) | 90 (32%) | 48 (31%) † | <0.0001 | 3734 (55%) | 1382 (45%) | 333 (35%) | 134 (33%) † | <0.0001 |
| Male | 758 (65%) | 406 (55%) | 140 (51%) | 48 (31%)† | <0.0001 | 5063 (74%) | 2284 (74%) | 622 (66%) | 233 (57%) † | <0.0001 |
| Prior Medical History/Comorbidities | ||||||||||
| Diabetes | 434 (37%) | 436 (58%) | 160 (58%) | 100 (65%) † | <0.0001 | 1779 (26%) | 1133 (37%) | 454 (48%) | 227 (56%) † | <0.0001 |
| Dialysis | 80 (7%) | 35 (5%) | 14 (5%) | 4 (3%) ∗ | 0.016 | 60 (1%) | 16 (1%) | 7 (1%) | 1 (<1%) | 0.073 |
| Elective status | 437 (3%) | 289 (39%) | 123 (44%) | 67 (44%) | 0.023 | 2644 (39%) | 1206 (39%) | 448 (48%) | 172 (42%) † | <0.0001 |
| Hypertension | 958 (82%) | 657 (90%) | 247 (89%) | 138 (90%) † | <0.0001 | 4439 (65%) | 2276 (74%) | 740 (79%) | 336 (83%) † | <0.0001 |
| LMCA disease | 245 (21%) | 152 (21%) | 47 (17%) | 30 (20%) | 0.27 | 1446 (21%) | 592 (19%) | 165 (18%) | 79 (19%) † | 0.0072 |
| LVEF <35% | 253 (22%) | 156 (21%) | 48 (17%) | 22 (14%) | 0.020 | 1296 (19%) | 516 (17%) | 137 (15%) | 54 (13%) † | <0.0001 |
| PAD | 193 (17%) | 83 (11%) | 29 (10%) | 15 (10%) † | 0.0003 | 838 (12%) | 278 (9%) | 80 (9%) | 36 (9%) † | <0.0001 |
| Prior MI | 512 (44%) | 315 (43%) | 129 (47%) | 66 (43%) | 0.85 | 2679 (39%) | 1198 (39%) | 342 (36%) | 155 (38%) | 0.23 |
| Recent smoker | 331 (28%) | 167 (23%) | 73 (26%) | 19 (12%) † | 0.0001 | 1746 (26%) | 692 (23%) | 212 (23%) | 77 (19%) † | <0.0001 |
| Three-vessel disease | 805 (69%) | 503 (69%) | 174 (63%) | 94 (61%) | 0.017 | 4501 (66%) | 2049 (67%) | 604 (64%) | 254 (62%) | 0.32 |
| Unstable heart failure | 230 (20%) | 141 (19%) | 63 (23%) | 38 (25%) | 0.13 | 810 (12%) | 369 (12%) | 147 (16%) | 63 (15%) ∗ | 0.0011 |
| Preoperative Medications | ||||||||||
| ACEi/ARBs | 437 (38%) | 304 (31%) | 119 (43%) | 62 (41%) ∗ | 0.092 | 1786 (26%) | 939 (31%) | 328 (35%) | 149 (37%) † | <0.0001 |
| Aspirin | 783 (67%) | 510 (69%) | 205 (74%) | 112 (73%) ∗ | 0.017 | 4792 (70%) | 2148 (70%) | 687 (73%) | 276 (68%) | 0.60 |
| Anticoagulants | 404 (35%) | 232 (32%) | 90 (32%) | 41 (27%) | 0.051 | 2279 (33%) | 1004 (33%) | 288 (31%) | 118 (29%) | 0.028 |
| Antiplatelets | 549 (47%) | 360 (49%) | 130 (47%) | 63 (41%) | 0.42 | 3736 (55%) | 1627 (53%) | 480 (51%) | 188 (46%) † | 0.0003 |
| Beta blockers | 705 (61%) | 446 (61%) | 187 (68%) | 98 (64%) | 0.086 | 3619 (53%) | 1736 (56%) | 549 (58%) | 251 (62%) † | <0.0001 |
| CCB | 361 (31%) | 259 (35%) | 101 (36%) | 49 (32%) ∗ | 0.14 | 2051 (30%) | 964 (31%) | 292 (31%) | 124 (30%) | 0.30 |
| Digitalis | 68 (6%) | 39 (5%) | 14 (5%) | 10 (7%) | 0.92 | 478 (9%) | 145 (5%) | 50 (5%) | 16 (4%) † | <0.0001 |
| Diuretics | 287 (25%) | 229 (31%) | 103 (37%) | 59 (39%) † | <0.0001 | 1149 (17%) | 645 (21%) | 251 (27%) | 138 (34%) † | <0.0001 |
| Inotropes | 18 (2%) | 10 (1%) | 5 (2%) | 2 (1%) | 1.0 | 84 (1%) | 27 (1%) | 7 (1%) | 1 (<1%) ∗ | 0.015 |
| Hypolipidemics | 490 (42%) | 329 (45%) | 141 (51%) | 75 (49%) † | 0.0061 | 2516 (37%) | 1228 (40%) | 426 (45%) | 197 (48%) † | <0.0001 |
| Nitrates | 170 (15%) | 110 (15%) | 48 (17%) | 17 (11%) | 0.92 | 1201 (18%) | 529 (17%) | 141 (15%) | 58 (14%) | 0.024 |
‡ Exact Cochran-Armitage trend test.
§ Missing values imputed using expectation-maximization algorithm (n = 10 simulations; imputation efficiency >99.5%).
Approximately 91% of patients underwent cardiopulmonary bypass ( Table 2 ). The median length of hospital stay after surgery was 5 days (interquartile range = 3.0). Increasing severity of obesity was associated with an increasing percentage of patients with renal failure (p trend = 0.0022) and POAF (p trend = 0.0021) in black but not white patients (p trend ≥0.5).
| Black | White | |||||||||
|---|---|---|---|---|---|---|---|---|---|---|
| Non-Obese | Obesity Class § | P trend ‡ | Non-Obese | Obesity Class § | P trend ‡ | |||||
| I | II | III | I | II | III | |||||
| Median [IQR] | Median [IQR] | |||||||||
| Overall | 1165 (50%) | 734 (32%) | 277 (12%) | 153 (7%) | — | 6846 (61%) | 3073 (27%) | 939 (8%) | 407 (4%) | — |
| Characteristics | ||||||||||
| CPB | 1045 (90%) | 660 (90%) | 242 (87%) | 135 (88%) | 0.35 | 6240 (91%) | 2837 (92%) | 863 (92%) | 368 (90%) | 0.42 |
| Cross-clamp time (min) | 57 [27] | 58 [29] | 57 [26] | 54 [24] | 0.15 | 59 [28] | 60 [30] | 61 [29] | 59 [33] † | 0.10 |
| Perfusion time (min) | 92 [41] | 91 [43] | 90 [42] | 87 [38] | 0.27 | 95 [42] | 96 [43] | 96 [46] | 96 [46] | 0.30 |
| Total ICU time (hours) | 26 [26] | 24 [15] | 27 [25] | 29 [40] ∗ | 0.65 | 24 [20] | 24 [19] | 24 [23] | 25 [17] | 0.77 |
| Hospital LOS (days) | 5 [3] | 5 [3] | 5 [3] | 6 [3] | 0.34 | 5 [3] | 5 [2] | 5 [3] | 5 [3] | 0.36 |
| Superficial SI ¶ | 3 (<1%) | 3 (<1%) | 3 (1%) | 1 (1%) | 0.16 | 15 (<1%) | 10 (<1%) | 2 (<1%) | 4 (1%) | 0.042 |
| Deep SI ¶ | 6 (1%) | 5 (1%) | 0 (0%) | 2 (1%) | 0.76 | 18 (<1%) | 17 (1%) | 11 (1%) | 5 (1%) | <0.0001 |
| Sepsis ¶ | 11 (1%) | 4 (1%) | 3 (1%) | 1 (1%) | 0.80 | 53 (1%) | 16 (1%) | 6 (1%) | 4 (1%) | 0.67 |
| Myocardial infarction ¶ | 3 (<1%) | 1 (<1%) | 1 (<1%) | 0 (0%) | 0.82 | 41 (1%) | 13 (<1%) | 3 (<1%) | 0 (0%) | 0.044 |
| Stroke ¶ | 31 (3%) | 17 (2%) | 8 (3%) | 2 (1%) | 0.51 | 81 (1%) | 24 (1%) | 8 (1%) | 4 (1%) | 0.16 |
| Pneumonia ¶ | 25 (2%) | 13 (2%) | 8 (3%) | 3 (2%) | 0.87 | 117 (2%) | 39 (1%) | 17 (2%) | 7 (2%) | 0.67 |
| ARDS ¶ | 11 (1%) | 3 (<1%) | 1 (<1%) | 3 (2%) | 1.0 | 63 (1%) | 24 (1%) | 7 (1%) | 6 (1%) | 0.90 |
| Renal failure ¶ | 21 (2%) | 14 (2%) | 12 (4%) | 8 (5%) | 0.0022 | 80 (1%) | 39 (1%) | 10 (1%) | 7 (2%) | 0.59 |
| POAF ¶ | 174 (15%) | 108 (15%) | 58 (21%) | 36 (34%) | 0.0021 | 1627 (24%) | 685 (22%) | 215 (23%) | 100 (25%) | 0.50 |
| Operative mortality ¶ | 36 (3%) | 16 (2%) | 5 (2%) | 10 (7%) | 0.45 | 210 (3%) | 51 (2%) | 22 (2%) | 12 (3%) | 0.023 |
Stay updated, free articles. Join our Telegram channel

Full access? Get Clinical Tree


