Triple-rule-out computed tomographic angiography (TRO CTA), performed to evaluate the coronary arteries, pulmonary arteries, and thoracic aorta, has been associated with high radiation exposure. The use of sequential scanning for coronary computed tomographic angiography reduces the radiation dose. The application of sequential scanning to TRO CTA is much less well defined. We analyzed the radiation dose and image quality from TRO CTA performed at a single outpatient center, comparing the scans from a period during which helical scanning with electrocardiographically controlled tube current modulation was used for all patients (n = 35) and after adoption of a strategy incorporating sequential scanning whenever appropriate (n = 35). Sequential scanning was able to be used for 86% of the cases. The sequential-if-appropriate strategy, compared to the helical-only strategy, was associated with a 61.6% dose decrease (mean dose-length product of 439 mGy × cm vs 1,144 mGy × cm and mean effective dose of 7.5 mSv vs 19.4 mSv, respectively, p <0.0001). Similarly, a 71.5% dose reduction occurred among the 30 patients scanned with the sequential protocol compared to the 40 patients scanned with the helical protocol using either strategy (326 mGy × cm vs 1,141 mGy × cm and 5.5 mSv vs 19.4 mSv, respectively, p <0.0001). Although the image quality did not differ between the strategies, a nonstatistically significant trend was seen toward better quality in the sequential protocol than in the helical protocol. In conclusion, approaching TRO CTA with a diagnostic strategy of sequential scanning, as appropriate, can offer a marked reduction in the radiation dose while maintaining the image quality.
Advancements in computed tomographic (CT) technology have made possible the imaging of not only the coronary arteries, but also the entire thorax, in a single breath-hold. “Triple-rule-out” CT angiography (TRO CTA) is able to simultaneously evaluate for multiple potentially life-threatening conditions, including acute coronary syndrome, aortic dissection, and pulmonary thromboembolism. A survey of emergency departments found that only 18% have been using TRO CTA in the evaluation of chest pain. A significant barrier to the more routine use of TRO CTA has been the associated radiation dose, which can be as much as 50% to 100% greater than for dedicated coronary CT angiography (CCTA) studies because of the longer scanning length. With increasing concern regarding the radiation associated with medical imaging, scanning protocols have been developed to minimize the radiation doses. Although numerous dose-saving techniques have been described for dedicated CCTA, the applicability of these techniques to TRO CTA has been infrequently described in published studies. Dose lowering of TRO CTA has been demonstrated with electrocardiographically synchronized tube current modulation (ESTCM), and one study found a 71% dose reduction using a sequential protocol compared to a helical protocol. Our study compared the radiation dose and several aspects of image quality between a strategy in which sequential scanning was used whenever appropriate, referred to as “sequential-if-appropriate,” and the traditional “helical-only” strategy using ESTCM.
Methods
We studied consecutive patients referred to a single outpatient laboratory for TRO CTA. Before July 2007, all patients had undergone imaging using a helical protocol. Subsequently, a scanner upgrade enabled sequential scanning to be performed. The patients were scanned sequentially, unless they had an irregular rhythm or heart rate (HR) >65 beats/min, in which case, a conventional retrospectively gated helical mode was used. If appropriate, an intravenous β blocker was given to achieve a goal HR of <65 beats/min.
A single LightSpeed VCT/VCT XT scanner (GE Healthcare, Milwaukee, Wisconsin) was used for all examinations. All patients underwent a 2-plane scout, calcium scoring scan, timing bolus, and either helical scanning with ESTCM (SnapShot Segment or SnapShot Burst, GE Healthcare) or sequential scanning (SnapShot Pulse, GE Healthcare). Image acquisition was performed craniocaudally from above the aortic arch to the diaphragm. The scanning parameters included a 64 × 0.625-mm detector configuration and a gantry rotation time of 350 ms. Almost all studies were performed with a voltage of 120 kVp. A voltage of 100 kVp and 140 kVp was used in 1 and 2 cases, respectively, because of the body habitus. The maximum tube current was determined according to the patient’s weight (250 to 275 mA for 95 to 140 lb, 300 to 400 mA for 140 to 200 lb, 450 to 600 mA for 200 to 230 lb, and 600 to 800 mA for >230 lb), with variation within a weight category as determined by the experience of the technologist. For the helical scans, ESTCM was performed with a maximum tube current applied at 40% to 80% of the RR interval; the minimum tube current was 150 mA in almost all cases but could be increased to ≤400 mA at the technologist’s discretion for very obese patients. For sequential scans, the x-ray window was set at 75% of the RR interval, with x-ray padding determined by the technologist at scanning and set at 0 to 200 ms, depending on the HR variability. The contrast bolus protocol consisted of a 24-second infusion at a weight-based rate and was identical for the helical and sequential scans. Patients weighing <170 lb received 72 ml (3 ml/s), patients weighing 171 to 250 lb received 96 ml (4 ml/s), and patients weighing >251 lb received 120 ml (5 ml/s). A wide reconstruction field of view was used to enable visualization of all structures on the same images.
The CCTA images were reconstructed with a slice thickness of 0.6 mm using a standard reconstruction algorithm. The images were transferred to a 3-dimensional workstation (Advantage Workstation, GE Healthcare) for evaluation and reviewed in all 3 planes and multiple phases, as available, using double oblique views. The optimal maximum intensity projection, multiplanar reformat, and/or curved multiplanar reformat images were generally constructed with commercially available software (CardIQ, GE Healthcare).
The effective radiation dose in the populations of patients was estimated by multiplying the dose-length product of the CCTA sequence by the European Guidelines on Quality Criteria conversion factor of 0.017 mSv/(mGy × cm).
Image quality was assessed by focusing on the coronary arteries. The pulmonary arteries and aorta are large vessels that are relatively immobile and have little to no calcium. Because patient movement or poor contrast timing would have a more significant effect on the quality of the smaller, more mobile coronary arteries than the larger vessels, the quality of the former was used as an indicator of overall quality. Two readers (M.R.P. and A.J.E.), experienced in reading CT angiograms, graded 4 criteria of quality—noise artifact, stair-step artifact, blur or motion artifact, and overall image quality. Each was assessed using a 5-point scale, as previously described. Each reader received the 75% phase reconstruction and images available as constructed in the optimal phases for interpretation. Thus, each reader was unaware of the scan protocol; had every phase of reconstruction been provided, it would have been obvious which patients had undergone sequential scanning owing to the limited number of phases. The readers were also unaware of the scan and reconstruction information, such as phase and tube voltage and current. Image manipulation was possible using the 3-dimensional workstation. A third reviewer (E.D.M.) measured the noise level, reported as the standard deviation of the CT number in Hounsfield units, measured in air anterior to the patient and in the descending aorta at the largest chest diameter.
The coronary artery image quality of the TRO CTA studies was compared to that of 399 dedicated coronary artery studies reported previously. These CCTA studies had been performed in the same laboratory, during the same period, using the same CT scanner, interpreted by the same readers, and evaluated using the same criteria.
Statistical analysis was performed using Stata, version 8.2 (StataCorp, College Station, Texas). Comparisons of the radiation dose, quality, and noise were performed using 2-sample t tests. The results are reported as the mean ± SD and the 95% confidence interval (CI). Comparisons of the baseline characteristics, indication, tube current, voltage, β-blocker use, and HR were performed using chi-square tests, t tests, or the Mann-Whitney 2-sample rank sum tests, as appropriate. A 2-tailed p value <0.05 was deemed significant. The inter-rater agreement of image quality was quantified with bias corrected, quadratic-weighted κ statistics, with 95% CIs estimated using 1,000 bootstrap iterations, and classified according to Landis and Koch.
Results
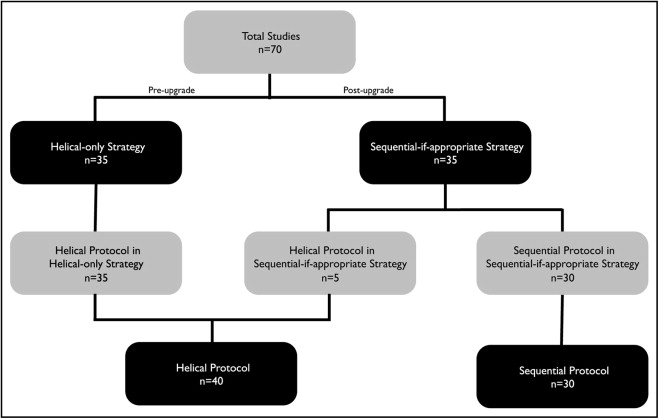
A total of 70 patients were identified as having undergone TRO CTA. Of these 70 patients, 35 had undergone scanning before the scanner upgrade using the helical-only strategy, and 35 had undergone imaging using the sequential-if-appropriate strategy, of whom 30 had undergone sequential scanning ( Figure 1 ). No significant between-group differences were found in the patient characteristics or indication, as elicited by self-report questionnaires, or in the coronary calcium scores ( Table 1 ). A small number of items in the questionnaires were not answered, and the number of responders is indicated in Table 1 . A nonsignificant trend was seen toward a lower HR among the patients undergoing sequential scanning. The details of β-blocker administration and its effect on the patients’ HRs are listed in Table 2 . The mean noise levels of the descending aorta were greater for the sequential-if-appropriate strategy than for the helical-only strategy and for the sequential protocol than for the helical protocol. No significant differences were seen among the groups for anterior air noise, tube current, voltage, or scan length ( Table 3 ).
| Category | Patients With Available data | Helical-Only Strategy (n = 35) | Sequential-if-Appropriate Strategy (n = 35) | p Value | Helical Protocol (n = 40) | Sequential Protocol (n = 30) | p Value |
|---|---|---|---|---|---|---|---|
| Age (years) | 70 | 52.7 | 54.4 | 0.58 | 54.0 | 53.0 | 0.75 |
| Men gender | 70 | 24 (69%) | 26 (74%) | 0.60 | 27 (68%) | 23 (77%) | 0.40 |
| Diabetes mellitus | 70 | 2 (5.7%) | 2 (5.7%) | 1.00 | 3 (7.5%) | 1 (3.3%) | 0.46 |
| Smoker | 60 | 11 (38%) | 14 (45%) | 0.57 | 12 (35%) | 13 (50%) | 0.25 |
| Dyspnea | 70 | 11 (31%) | 13 (37%) | 0.62 | 12 (30%) | 12 (40%) | 0.38 |
| Abnormal electrocardiographic findings | 67 | 5 (15%) | 6 (18%) | 0.70 | 6 (16%) | 5 (17%) | 0.96 |
| Abnormal stress test findings | 69 | 1 (2.9%) | 3 (8.8%) | 0.29 | 2 (5.1%) | 2 (6.7%) | 0.79 |
| Coronary angioplasty | 69 | 2 (5.7%) | 2 (5.9%) | 0.98 | 2 (5.1%) | 2 (6.7%) | 0.79 |
| Coronary stent | 69 | 3 (8.6%) | 2 (5.9%) | 0.67 | 3 (7.7%) | 2 (6.7%) | 0.87 |
| Previous cardiac surgery | 68 | 0 (0%) | 2 (5.9%) | 0.15 | 1 (2.6%) | 1 (3.3%) | 0.87 |
| Indication for coronary computed tomographic angiography | 70 | 0.59 | 0.62 | ||||
| Screening | 6 (17%) | 4 (11%) | 6 (15%) | 4 (13%) | |||
| Chest pain | 13 (37%) | 11 (31%) | 15 (38%) | 9 (30%) | |||
| Dyspnea | 6 (17%) | 7 (20%) | 6 (15%) | 7 (23%) | |||
| Abnormal electrocardiographic findings | 0 | 0 | 0 (0%) | 0 (0%) | |||
| Abnormal stress test findings | 0 | 0 | 0 (0%) | 0 (0%) | |||
| Aortic aneurysm | 0 | 0 | 0 (0%) | 0 (0%) | |||
| Blank | 5 (14%) | 10 (29%) | 7 (18%) | 8 (27%) | |||
| Other | 5 (14%) | 3 (8.6%) | 6 (15%) | 2 (6.7%) | |||
| Coronary calcium score | 66 | 118.9 | 98.8 | 0.63 | 111.6 | 105.5 | 0.87 |
| Category | Helical-Only Strategy (n = 35) | Sequential-if-Appropriate Strategy (n = 35) | p Value | Helical Protocol (n = 40) | Sequential Protocol (n = 30) | p Value |
|---|---|---|---|---|---|---|
| Minimum heart rate (beats/min) | 55.2 | 55.3 | 0.97 | 56.4 | 53.7 | 0.18 |
| Maximum heart rate (beats/min) | 65.7 | 62.6 | 0.50 | 67.2 | 60.2 | 0.097 |
| β-Blocker use | 19 (54%) | 23 (66%) | 0.33 | 22 (55%) | 20 (67%) | 0.32 |
| β-Blocker dose (mg) | 4.2 | 7.2 | 0.087 | 5.0 | 6.6 | 0.26 |
| Variable | Mean ± SD | 95% CI | p Value |
|---|---|---|---|
| Anterior air noise (Hounsfield units) | |||
| Sequential-if-appropriate strategy | 17.8 ± 3.4 | 16.7–19.0 | 0.19 |
| Helical-only strategy | 16.7 ± 3.7 | 15.5–18.0 | |
| Sequential protocol | 18.1 ± 3.6 | 16.8–19.5 | 0.090 |
| Helical protocol | 16.7 ± 3.5 | 15.5–17.8 | |
| Descending aorta noise (Hounsfield units) | |||
| Sequential-if-appropriate strategy | 44.4 ± 11.8 | 40.4–48.5 | 0.0011 |
| Helical-only strategy | 36.6 ± 6.0 | 34.6–38.7 | |
| Sequential protocol | 45.3 ± 12.4 | 40.7–50.0 | 0.0015 |
| Helical-only protocol | 36.9 ± 5.9 | 35.1–38.8 | |
| Tube current (mA) | |||
| Sequential-if-appropriate strategy | 460.5 ± 123.2 | 418.2–502.9 | 0.84 |
| Helical-only strategy | 455.4 ± 91.3 | 424.0–486.7 | |
| Sequential protocol | 455.8 ± 116.1 | 412.5–499.2 | 0.89 |
| Helical protocol | 459.6 ± 16.2 | 426.8–492.3 | |
| Voltage (kV) | |||
| Sequential-if-appropriate strategy | 119.4 ± 3.4 | 118.3–120.6 | 0.085 |
| Helical-only strategy | 121.1 ± 4.7 | 119.5–122.8 | |
| Sequential protocol | 119.3 ± 3.7 | 118.0–120.7 | 0.098 |
| Helical protocol | 121.0 ± 4.4 | 119.6–122.4 | |
| Scan length (mm) | |||
| Sequential-if-appropriate strategy | 187.6 ± 26.4 | 178.5–196.7 | 0.52 |
| Helical-only strategy | 182.7 ± 36.1 | 170.3–195.1 | |
| Sequential protocol | 188.2 ± 28.2 | 177.7–198.8 | 0.48 |
| Helical protocol | 182.8 ± 39.9 | 172.0–193.7 |
The dose-length product was decreased by 61.6% using the sequential-if-appropriate strategy compared to the helical-only strategy (439 ± 358 and 1,144 ± 321 mGy × cm, respectively, p <0.0001). The corresponding effective doses for these 2 strategies were 7.5 mSv and 19.4 mSv. A 71.5% dose decrease occurred when using the sequential protocol compared to the helical protocol (326 ± 169 and 1,141 ± 333 mGy × cm and 5.5 mSv and 19.4 mSv, respectively, p <0.0001). The radiation dosimetry details are listed in Table 4 .
| Variable | Dose-Length Product (mGy × cm) | Estimated Effective Dose (mSv) | p Value | |
|---|---|---|---|---|
| Mean ± SD | 95% CI | |||
| Sequential-if-appropriate strategy | 439.1 ± 357.7 | 316.3–562.0 | 7.5 | <0.0001 |
| Helical-only strategy | 1,143.5 ± 320.6 | 1,033.4–1,253.6 | 19.4 | |
| Sequential protocol | 325.6 ± 168.7 | 262.6–388.6 | 5.5 | <0.0001 |
| Helical protocol | 1,140.6 ± 332.7 | 1,034.2–1,247.0 | 19.4 | |
Stay updated, free articles. Join our Telegram channel

Full access? Get Clinical Tree


