The purpose of the present study was to compare the aortic valve area, aortic valve annulus, and aortic root dimensions measured using magnetic resonance imaging (MRI) with catheterization, transthoracic echocardiography (TTE), and transesophageal echocardiography (TEE). An optimal prosthesis–aortic root match is an essential goal when evaluating patients for transcatheter aortic valve implantation. Comparisons between MRI and the other imaging techniques are rare and need validation. In 24 consecutive, high-risk, symptomatic patients with severe aortic stenosis, aortic valve area was prospectively determined using MRI and direct planimetry using three-dimensional TTE and calculated by catheterization using the Gorlin equation and by Doppler echocardiography using the continuity equation. Aortic valve annulus and the aortic root dimensions were prospectively measured using MRI, 2-dimensional TTE, and invasive aortography. In addition, aortic valve annulus was measured using TEE. No differences in aortic valve area were found among MRI, Doppler echocardiography, and 3-dimensional TTE compared with catheterization (p = NS). Invasive angiography underestimated aortic valve annulus compared with MRI (p <0.001), TEE (p <0.001), and 2-dimensional TTE (p <0.001). Two-dimensional TTE tended to underestimate the aortic valve annulus diameters compared to TEE and MRI. In contrast to 2-dimensional TTE, 3 patients had aortic valve annulus beyond the transcatheter aortic valve implantation range using TEE and MRI. In conclusion, MRI planimetry, Doppler, and 3-dimensional TTE provided an accurate estimate of the aortic valve area compared to catheterization. MRI and TEE provided similar and essential assessment of the aortic valve annulus dimensions, especially at the limits of the transcatheter aortic valve implantation range.
Magnetic resonance imaging (MRI) has the unique potential of 3-dimensional (3D) cardiac imaging and analysis with great accuracy and reproducibility without the need for potential nephrotoxic contrast media. MRI permits visualization of the aortic valve and root despite the presence of calcifications. However, comparisons between MRI and other imaging techniques are rare. Because the results among imaging techniques can be conflicting, the potential role of MRI in relation to other imaging techniques to assess the technical feasibility of transcatheter aortic valve implantation needs additional validation. We aimed to compare the aortic valve area and aortic root dimensions using MRI and a multimodality imaging approach including Doppler, 2-dimensional (2D) transthoracic echocardiography (TTE), 3D TTE and transesophageal echocardiography (TEE), and catheterization.
Methods
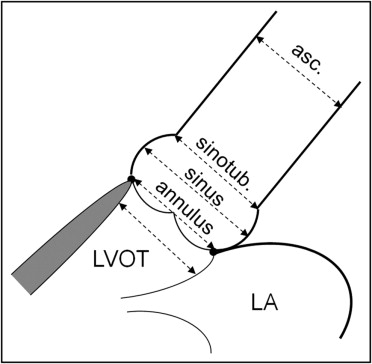
Consecutive high-risk elderly symptomatic patients with severe aortic stenosis who had been referred for clinically indicated heart catheterization and preprocedural transcatheter aortic valve implantation screening were prospectively studied. The aortic valve area was determined using steady-state free precession MRI and direct planimetry using 3D TTE and calculated by cardiac catheterization using the Gorlin equation and Doppler echocardiography using the continuity equation. The diameter of aortic valve annulus (at midsystole at the insertion of the leaflets), aortic sinus, sinotubular junction, and ascending aorta (4.5 cm above aortic valve annulus; Figure 1 ) were measured using steady-state free precession MRI and compared to 2D TTE, TEE, and invasive aortography. The diameter of the left ventricular outflow tract was measured using steady-state free precession MRI and compared to 2D TTE. In addition, the diameter of aortic valve annulus was measured using TEE ( Figure 1 ).
Noninvasive measurements were performed by 2 independent readers (B.P.P. and P.V.H.) who were unaware of the invasive measurements and had extensive experience with the analysis of steady-state free precession MRI and 2D and 3D echocardiography. Two independent observers (C.J.V. and J.M.B.), who were unaware of the noninvasive measurements, performed the invasive measurements. All measurements were done off-line and repeated ≥3 times. The mean value of these measurements was used for analysis. The medical ethical committee of the Antwerp University Hospital approved the protocol, and all patients gave written informed consent before participation.
Echocardiography was performed with an iE33 phased-array scanner (Philips Medical Systems, Andover, Massachusetts) with an S5-1 5 to 1 MHz extended frequency range transducer for 2D imaging and Doppler, and an X3-1 broadband xMatrix array transducer for 3D imaging. Three consecutive cardiac cycles were acquired and stored for each parameter. The diameter of the left ventricular outflow tract, aortic valve annulus, aortic sinus, sinotubular junction, and ascending aorta was measured from the parasternal long-axis view ( Figures 1 and 2 ). Three-dimensional echocardiographic volumes incorporating the aortic valve were acquired from the parasternal window with electrocardiographic gating and breath holding (during 8 heartbeats). Off-line analysis using dedicated software (Qlab, version 7.0, 3D Q-Advanced, Philips, Maastricht, The Netherlands) was performed by an investigator, who was unaware of the results of the other measurements. Direct planimetry of the aortic valve was done after cropping and by alignment of the short-axis plane along the narrowest orifice in systole using the orthogonal long-axis plane ( Figure 3 ).
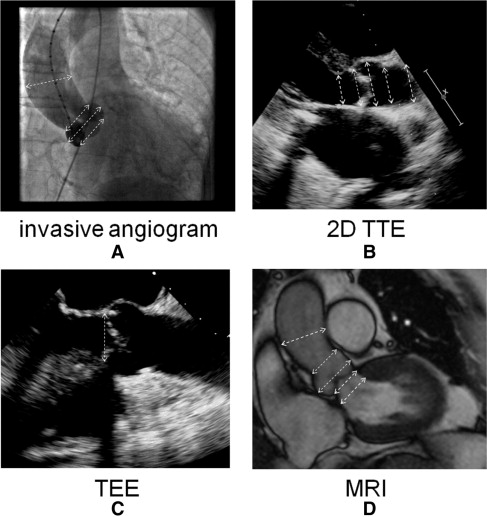
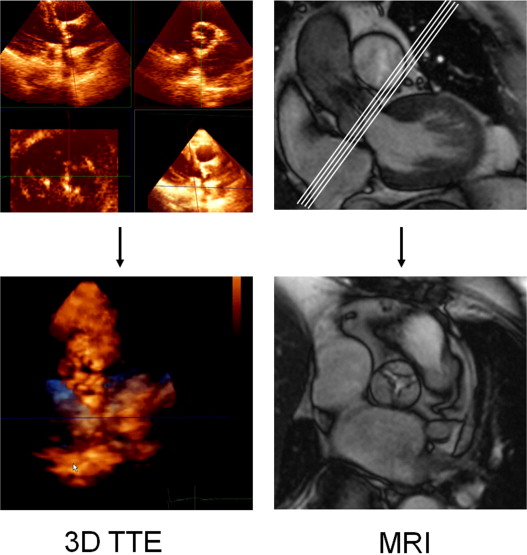
The subjects were examined using a Sonata MRI scanner (Siemens, Erlangen, Germany) and a commercially available 12-channel body array surface coil. Retrospective electrocardiographically triggered breath-hold steady-state free precession (true fast imaging with steady state precession) imaging of the heart was performed. The imaging parameters were repetition time 3.2 ms, echo time 1.6 ms, 8-mm section thickness, 2-mm interslice gap, 240 × 256 matrix, 380 × 380 mm field of view, 1.6 × 1.5 mm in-plane spatial resolution, and 65° flip angle. The temporal resolution was 40 ms. The entire heart was imaged in the short-axis orientation, as described previously. For determination of the aortic valve annulus and aortic root dimensions, a long-axis cine image was acquired by cutting the plane of the left ventricular outflow tract and the posterolateral wall in the most basal short-axis image ( Figure 2 ). Using this 3-chamber view, multiple (average of 4) contiguous breath-hold true fast imaging with steady state precession cine images of the aortic valve starting at the left ventricular outflow tract and ending at the valve tips, were acquired perpendicular to the aortic root (slice displacement 2 mm). Planimetry for the assessment of the aortic valve area was obtained by delineating the edges of the maximum opening of the aortic valve during systole on each image slice using ARGUS software (Siemens, Erlangen, Germany; Figure 3 ). The smallest aortic valve area was used in the analysis.
Multiplanar TEE was performed using a Philips iE33 phased-array scanner, with a 7.5-MHz multiplanar probe. For optimal measurement of the aortic valve annulus, the zoomed long-axis view of the ascending aorta and left ventricular outflow tract (usually 110° to 150°) at midsystole was used ( Figure 2 ).
Invasive measurements were performed using a 5Fr marked pigtail catheter positioned in the noncoronary sinus. The angiographic view, looking perpendicular to the aortic valve annulus in which the 3 coronary cusps were perfectly lined in 1 plane, was selected for the measurements. The aortic valve annulus, defined as the angiographic attachment point of the calcified valve leaflets, was measured during systole. The maximum diameter of the coronary sinuses, height of the sinuses, and diameter of the sinotubular junction and of the basal aorta 4.5 cm above the aortic valve annulus were measured, all with use of the marked pigtail as a reference ( Figure 2 ).
Data are expressed as the median and range. The normality of the data was verified with a Shapiro-Wilk test. Differences between normally distributed measurements were tested with repeated measurements analysis of variance. A Bonferroni correction was applied for the pairwise comparisons (post hoc test). A Friedman test was used to assess differences between non-normally distributed measurements. A Wilcoxon signed rank test with Bonferroni correction was applied as the post hoc test. An analysis of the limits of agreement was evaluated in accordance with Bland and Altman. The intra- and interobserver reproducibility was assessed in 10 randomly selected patients and is expressed as the mean difference ±2 SDs. The statistical analysis was performed using the Statistical Package for Social Sciences, version 17.0 (SPSS, Chicago, Illinois). Significance was defined as p <0.05.
Results
A total of 24 consecutive high-risk elderly symptomatic patients (8 men and 16 women, mean age 83.5 years, range 67 to 88) with severe aortic stenosis were included in the present study. The image quality of MRI and 2D and 3D TTE was considered sufficient for analysis in all patients. In 1 patient, catheterization of the stenotic aortic valve was not technically feasible.
No differences were seen for the aortic valve area among the different methods (invasive, 0.60 cm 2 , range 0.30 to 0.83; MRI, 0.60 cm 2 , range 0.30 to 0.80 cm 2 ; Doppler, 0.60 cm 2 , range 0.37 to 0.80; 3D TTE, 0.54 cm 2 , range 0.32 to 0.83 cm 2 ; repeated measures analysis of variance, p = 0.506). The Bland-Altman analysis of each noninvasive method compared to catheterization is depicted in Figure 4 .
The results of measurements of the aortic root and aortic valve annulus are listed in Table 1 . A significant difference in the aortic valve annulus measurements was found among the various methods (e.g., MRI, invasive angiography, TEE, and 2D TTE; Friedman, p <0.001). The measurements of the aortic valve annulus with MRI, TEE, and 2D TTE were larger than with invasive angiography (all comparisons, p <0.001). 2D TTE tended to underestimate the aortic valve annulus diameters compared to TEE and MRI. The aortic valve annulus of 3 patients was beyond the transcatheter aortic valve implantation range using TEE and MRI but not using 2D TTE ( Figure 5 ). The Bland-Altman plots are depicted in Figure 6 .
| Pt. No. | Age (yr) | LVEF (%) | Gradient ⁎ (mm Hg) | LVOT (cm) | Aortic Valve Annulus (cm) | Aortic Sinus (cm) | Sinotubular Junction (cm) | Ascending Aorta (cm) | ||||||||||
|---|---|---|---|---|---|---|---|---|---|---|---|---|---|---|---|---|---|---|
| MRI | 2D TTE | MRI | Invasive | TEE | 2D TTE | MRI | Invasive | 2D TTE | MRI | Invasive | 2D TTE | MRI | Invasive | 2D TTE | ||||
| 1 | 84 | 78.5 | 32 | 2.23 | 1.83 | 2.3 | 1.76 | 2.45 | 2.4 | 3.1 | 3.04 | 3.2 | 2.65 | 2.67 | 2.6 | 2.87 | 2.8 | 3.5 |
| 2 | 84 | 59 | 84 | 1.76 | 1.8 | 2.51 | 1.62 | 2.4 | 2.3 | 2.85 | 2.24 | 2.7 | 2.44 | 2.03 | 2.3 | 2.67 | 2.29 | 2.8 |
| 3 | 80 | 74 | 56 | 1.92 | 2 | 2.2 | 1.66 | 2.1 | 2.4 | 2.8 | 2.83 | 3.1 | 2.4 | 2.53 | 2.4 | 3.1 | 2.89 | 3 |
| 4 | 87 | 71 | 34 | 1.67 | 1.48 | 2.2 | 1.75 | 2.28 | 2.1 | 3 | 2.66 | 2.7 | 2.4 | 2.12 | 2.2 | 2.79 | 2.7 | 3.2 |
| 5 | 72 | 67 | 45 | 1.6 | 1.8 | 2.5 | 1.75 | 2.55 | 2.3 | 2.8 | 3.12 | 3 | 2.46 | 2.54 | 2.5 | 3.16 | 3.4 | 2.6 |
| 6 | 75 | 67.5 | 41 | 1.84 | 1.77 | 2.23 | 1.83 | 2.26 | 2.35 | 3.36 | 3.2 | 3.1 | 2.82 | 2.77 | 2.7 | 3.31 | 3.33 | 2.9 |
| 7 | 87 | 54 | 78 | 1.4 | 1.59 | 2.1 | 2.28 | 2.1 | 2.2 | 3.4 | 3.75 | 3.2 | 3.3 | 3.06 | 3.1 | 3.2 | 3.54 | 3.9 |
| 8 | 88 | 82 | 45 | 1.71 | 1.79 | 2.4 | 2.1 | 2.4 | 2.31 | 3.3 | 3.36 | 3.3 | 2.5 | 2.46 | 2.53 | 3.1 | 3.06 | 3 |
| 9 | 85 | 76 | 27 | 1.57 | 1.65 | 2.35 | 2.2 | 2.35 | 2.4 | 3.2 | 3.34 | 3.2 | 2.46 | 2.5 | 2.6 | 3.19 | 2.88 | 2.3 |
| 10 | 75 | 28 | 37 | 2.23 | 2.15 | 3.2 | 2.96 | 2.8 | 2.7 | 4.3 | 4.3 | 3.6 | 3.2 | 3.46 | 3 | 3.32 | 3.6 | 3 |
| 11 | 86 | 53 | 31 | 1.95 | 2.03 | 2.67 | 1.8 | 2.85 | 2.5 | 3.6 | 2.59 | 3.2 | 2.8 | 2.75 | 2.45 | 3.32 | 3.1 | 2.5 |
| 12 | 77 | 76 | 45 | 1.42 | 1.51 | 2.09 | 1.86 | 2.2 | 2.1 | 2.76 | 2.89 | 2.6 | 1.9 | 2.06 | 1.93 | 2.85 | 3.01 | 2.5 |
| 13 | 85 | 78 | 67 | 1.2 | 1.1 | 2.32 | 2 | 2.35 | 2.27 | 3.1 | 3 | 2.96 | 2.76 | 2.29 | 2.37 | 2.97 | 3.02 | 2.7 |
| 14 | 76 | 62.5 | 39 | 2.16 | 2.04 | 2.5 | 1.78 | 2.5 | 2.46 | 3.5 | 3.14 | 3.43 | 2.66 | 2.3 | 2.71 | 2.89 | 2.89 | 2.6 |
| 15 | 83 | 37 | 33 | 2.42 | 2.2 | 2.8 | 2.48 | 2.7 | 2.59 | 3.74 | 4.1 | 3.75 | 2.93 | 2.8 | 2.47 | 3.39 | 3.3 | 3.3 |
| 16 | 88 | 53 | 48 | 1.98 | 1.7 | 2.48 | 1.77 | 2.5 | 2.14 | 3.2 | 2.3 | 2.97 | 2.2 | 1.5 | 2.1 | 2.75 | 2.63 | 2.6 |
| 17 | 67 | 83 | 60 | 1.84 | 1.7 | 3.1 | 2.25 | 3.1 | 2.69 | 3.58 | 3.4 | 3.71 | 3.5 | 2.98 | 3.1 | 3.77 | 4.18 | 4 |
| 18 | 87 | 48 | 63 | 2.03 | 2 | 2.69 | 2.2 | 2.55 | 2.46 | 3.47 | 3.2 | 3.16 | 2.8 | 2.88 | 2.68 | 3.39 | 3.5 | 2.6 |
| 19 | 83 | 34 | 59 | 2.63 | 2.44 | 3 | 2.62 | 2.8 | 2.7 | 3.58 | 3.2 | 3.5 | 2.9 | 3 | 3 | 3.31 | 3.16 | 3 |
| 20 | 80 | 78 | 40 | 1.73 | 1.7 | 2.4 | 1.78 | 2.4 | 2.3 | 3.4 | 2.77 | 3.15 | 2.6 | 2.09 | 2.25 | 3.03 | 2.99 | 3.1 |
| 21 | 85 | 69 | 38 | 1.64 | 1.69 | 2.85 | 2.36 | 2.88 | 2.81 | 4.2 | 3.51 | 3.53 | 3.15 | 2.9 | 2.92 | 3.68 | 3.5 | 2.9 |
| 22 | 77 | 69 | 83 | 2.05 | 1.97 | 2.69 | 1.8 | 2.69 | 2.72 | 3.6 | 3.35 | 3.37 | 2.98 | 2.53 | 2.47 | 3.01 | 2.99 | 2.6 |
| 23 | 84 | 51 | 70 | 1.9 | 1.8 | 2.35 | 1.7 | 2.35 | 2.24 | 3.2 | 2.78 | 2.62 | 2.6 | 2.25 | 2.03 | 2.85 | 2.87 | 2.6 |
| 24 | 82 | 65 | 38 | 1.6 | 1.6 | 2 | 2.4 | 2 | 2.2 | 2.7 | 3.5 | 3.1 | 2.2 | 3.2 | 2.5 | 3 | 3.5 | 2.4 |
| Median | 83.5 | 67.3 | 45 | 1.84 | 1.80 | 2.44 | 1.85 | 2.43 | 2.38 | 3.33 | 3.17 | 3.18 | 2.66 | 2.54 | 2.50 | 3.10 | 3.04 | 2.85 |
| Lower | 67 | 28 | 27 | 1.20 | 1.10 | 2.00 | 1.62 | 2.00 | 2.10 | 2.70 | 2.24 | 2.60 | 1.90 | 1.50 | 1.93 | 2.67 | 2.29 | 2.30 |
| Upper | 88 | 83 | 84 | 2.63 | 2.44 | 3.20 | 2.96 | 3.10 | 2.81 | 4.30 | 4.30 | 3.75 | 3.50 | 3.46 | 3.10 | 3.77 | 4.18 | 4.00 |
Stay updated, free articles. Join our Telegram channel

Full access? Get Clinical Tree


