Despite the valuable role of intravascular ultrasound (IVUS) guidance in percutaneous coronary interventions (PCIs), its impact on clinical outcomes remains debatable. The aim of the present study was to compare the outcomes of PCIs guided by IVUS versus angiography in the contemporary era on inhospital outcomes in an unrestricted large, nationwide patient population. Data were obtained from the Nationwide Inpatient Sample from 2008 to 2011. Hierarchical mixed-effects logistic regression models were used for categorical dependent variables like inhospital mortality, and hierarchical mixed-effects linear regression models were used for continuous dependent variables like length of hospital stay and cost of hospitalization. A total of 401,571 PCIs were identified, of which 377,096 were angiography guided and 24,475 (weighted n = 119,102) used IVUS. In a multivariate model, significant predictors of higher mortality were increasing age, female gender, higher baseline co-morbidity burden, presence of acute myocardial infarction, shock, weekend and emergent admission, or occurrence of any complication during hospitalization. Significant predictors of reduced mortality were the use of IVUS guidance (odds ratio 0.65, 95% confidence interval 0.52 to 0.83; p <0.001) for PCI and higher hospital volumes (third and fourth quartiles). The use of IVUS was also associated with reduced inhospital mortality in subgroup of patients with acute myocardial infarction and/or shock and those with a higher co-morbidity burden (Charlson’s co-morbidity index ≥2). In one of the largest studies on IVUS-guided PCIs in the drug-eluting stent era, we demonstrate that IVUS guidance is associated with reduced inhospital mortality, similar length of hospital stay, and increased cost of care and vascular complications compared with conventional angiography-guided PCIs.
Intravascular ultrasound (IVUS), secondary to its excellent spatial resolution, provides valuable complementary information to angiography on cross-sectional coronary anatomy and plaque burden and composition. Furthermore, IVUS guidance is useful in selecting appropriate treatment strategy, stent sizing, and optimal deployment, especially in complex lesions. Despite the valuable role of IVUS guidance in percutaneous coronary interventions (PCIs), its impact on clinical outcomes remains controversial. The initial studies performed in the bare-metal stent (BMS) era demonstrated that IVUS-guided PCI significantly reduced the risk of restenosis and target vessel revascularization with no effect on mortality and myocardial infarction (MI). However, the studies evaluating IVUS-guided PCI in the drug-eluting stent (DES) era are limited and have yielded conflicting results. Additionally, most studies have been underpowered to detect meaningful differences in clinical outcomes with IVUS-guided PCI. However, there is recent evidence that suggests IVUS-guided PCI in the DES era may significantly reduce the risk of death and stent thrombosis compared with angiography guidance. The aim of the present study was to compare the outcome PCIs guided by IVUS versus those guided by angiography in the contemporary era on inhospital outcomes in an unrestricted large, nationwide patient population.
Methods
Data were obtained from the Nationwide Inpatient Sample (NIS). NIS is a part of a family of databases developed for the Healthcare Cost and Utilization Project and is sponsored by the Agency for Healthcare Research and Quality (AHRQ). NIS contains all discharge data from >1,000 short-term and non-Federal hospitals each year, which approximates a 20% stratified sample of US community hospitals. Data from the NIS have previously been used to identify, track, and analyze national trends in health care use, patterns of major procedures, access, disparity of care, trends in hospitalizations, charges, quality, and outcomes. Annual data quality assessments are performed for internal validity of the database. To maintain the external validity, database is compared with the following data sources: the American Hospital Association Annual Survey Database, the National Hospital Discharge Survey from the National Center for Health Statistics, and the MedPAR inpatient data from the Centers for Medicare and Medicaid Services.
We analyzed data from NIS from 2008 to 2011 using the International Classification of Diseases, Ninth Revision, Clinical Modification ( ICD-9-CM ) procedure codes of 36.06 for non–drug-eluting coronary artery stents and 36.07 for drug-eluting coronary artery stents in any of the procedural fields. Subjects ≥18 years were included. PCIs performed under IVUS guidance were identified by ICD-9-CM code 00.24. We excluded PCIs with fractional flow reserve guidance ( ICD-9-CM : 00.59) or where both fractional flow reserve and IVUS were used. The remaining observations were categorized as angiography-guided (AO) PCIs.
We defined severity of co-morbid conditions using Deyo modification of Charlson’s co-morbidity index (CCI). This index contains 17 co-morbid conditions with differential weights. The score ranges from 0 to 33, with higher scores corresponding to greater burden of co-morbid diseases ( Supplementary Table 1 ). Hospitals were categorized as teaching if they had an American Medical Association–approved residency program, were a member of the Council of Teaching Hospitals, or had a full-time equivalent interns and resident-to-patient ratio of ≥0.25. Annual hospital volume was determined on a year-to-year basis using the unique hospital identification number to calculate the total number of procedures performed by a particular institution in a given year.
The primary outcome was all-cause inhospital mortality. Procedural complications were identified by Patient Safety Indicators (PSIs), version 4.4, March 2012, which have been established by the AHRQ to monitor preventable adverse events during hospitalization. These indicators are based on ICD-9-CM codes and Medicare severity diagnosis-related groups, and each PSI has specific inclusion and exclusion criteria. Procedural complications not included in PSI were identified using ICD-9-CM codes ( Supplementary Table 2 ). This methodology of identifying patients who underwent procedures, co-morbid conditions, and associated complications has previously been used in several studies.
Other outcomes studied were the length of hospital stay (LOS) and cost of hospitalization. LOS included admissions with observational and inpatient status. To estimate the cost of hospitalization, the NIS data were merged with cost-to-charge ratios available from the Healthcare Cost and Utilization Project. We estimated the cost of each inpatient stay by multiplying the total hospital charge with cost-to-charge ratios. Adjusted cost for each year was calculated in terms of the 2011 cost, after adjusting for inflation according to the latest consumer price index data released by the US government on January 16, 2013.
Stata IC 11.0 (Stata-Corp, College Station, Texas) and SAS 9.3 (SAS Institute Inc., Cary, North Carolina) were used for analyses, which accounted for the complex survey design and clustering. All analyses were performed using hospital-level discharge weights provided by the NIS to minimize biases.
Hierarchical mixed-effects models were generated to identify the independent multivariate predictors of inhospital mortality, LOS, and cost of hospitalization. Three-level hierarchical models (with patient-level factors nested within hospital-level factors) were created with the unique hospital identification number incorporated as random effects within the model. Subgroup analysis was also performed in subgroup of patients with acute myocardial infarction (AMI) and/or shock and those with Charlson’s co-morbidity index ≥2.
We used propensity-scoring method to establish matched cohorts to control for imbalances of patient and hospital characteristics between the 2 different treatment groups that may have influenced treatment outcome. A propensity score was assigned to each hospitalization. This was based on multivariate logistic regression model that examined the impact of 12 variables (patient demographics, co-morbidities, and hospital characteristics) on the likelihood of treatment assignment. Patients with similar propensity score in the 2 treatment groups were matched using a 1 to 1 scheme without replacement using greedy algorithm.
Variables with >10% missing data (such as race) were not included in the multivariate models. All interactions were thoroughly tested. Collinearity was assessed using variance inflation factor.
Results
A total of 401,571 PCIs were identified, of which 377,096 were AO PCIs and 24,475 used IVUS (IVUS PCIs). Table 1 demonstrates the baseline characteristics of the study population. The mean age of the study population was 64.3 ± 0.02 years with majority (88%) of the patients >50 years; 66% were men and 65% were whites. There were significant differences between the baseline characteristics of the 2 groups ( Table 1 ). More patients in the AO PCI group had CCI score ≥2, diabetes, AMI, low household income (less than twenty-fifth percentile), emergent admissions, weekend admissions, and use of BMS, whereas IVUS PCIs outnumbered in patients with hypertension, high household income (more than seventy-fifth percentile), elective admissions, weekday admissions, multivessel stenting, bifurcation stenting, multiple stents in a single vessel, and use of DES. DES was implanted in nearly 73.5% of the PCIs in this study population.
| Demographic variable | Angiography guided PCI | IVUS guided PCI | Overall | P-value |
|---|---|---|---|---|
| Total no. of PCI (Unweighted NO.) | 377,096 | 24,475 | 401,571 | |
| Total no. of PCI (weighted no.) | 18,594,82 | 119,102 | 19,785,84 | |
| Patient level variables | ||||
| Age(Continuous Variable) | 64.3±0.02 | 64.1±0.08 | 64.3±0.01 | 0.012 |
| Age (years) | <0.001 | |||
| 18-34 | 0.6 | 0.6 | 0.6 | |
| 35-49 | 11.9 | 11.2 | 11.8 | |
| 50-64 | 38.0 | 38.5 | 38.1 | |
| 65-79 | 37.0 | 38.8 | 37.1 | |
| ≥80 | 12.6 | 10.9 | 12.5 | |
| Gender | <0.001 | |||
| Male | 66.4 | 64.5 | 66.3 | |
| Female | 33.6 | 35.5 | 33.7 | |
| Race ∗ | <0.001 | |||
| White | 64.9 | 66.2 | 65.0 | |
| Non-white | 16.6 | 17.8 | 16.7 | |
| Missing | 18.4 | 16.1 | 18.3 | |
| Charlson/Deyo comorbidity index † | <0.001 | |||
| 0 | 18.7 | 25.3 | 19.1 | |
| 1 | 39.4 | 37.6 | 39.3 | |
| ≥2 | 41.9 | 37.1 | 41.6 | |
| Comorbidities ‡ | ||||
| Obesity | 13.4 | 13.9 | 13.5 | <0.001 |
| History of hypertension | 72.1 | 73.7 | 72.2 | <0.001 |
| History of diabetes | 34.0 | 32.8 | 34.0 | <0.001 |
| History of congestive heart failure | 0.5 | 0.4 | 0.5 | 0.489 |
| History of chronic pulmonary disease | 15.7 | 15.5 | 15.7 | 0.106 |
| Peripheral vascular disease | 10.6 | 10.5 | 10.6 | 0.743 |
| Renal failure | 16.9 | 16.4 | 16.9 | <0.001 |
| Neurological disorder or paralysis | 3.6 | 3.3 | 3.6 | <0.001 |
| Anemia or Coagulopathy | 8.7 | 8.5 | 8.7 | 0.028 |
| Hematological or Oncological malignancy | 1.5 | 1.5 | 1.5 | 0.125 |
| Weight loss | 0.6 | 0.6 | 0.6 | 0.221 |
| Rheumatoid arthritis or other collagen vascular disease | 1.9 | 1.9 | 1.9 | 0.174 |
| Depression, psychosis or substance abuse | 8.5 | 8.9 | 8.5 | <0.001 |
| Median household income category for patient’s zip code § | <0.001 | |||
| 1. 0-25th percentile | 27.1 | 24.4 | 26.9 | |
| 2. 26-50th percentile | 27.6 | 25.3 | 27.5 | |
| 3. 51-75th percentile | 24.0 | 24.3 | 24.0 | |
| 4. 76-100th percentile | 19.1 | 23.8 | 19.4 | |
| Primary Payer | <0.001 | |||
| Medicare / Medicaid | 55.8 | 55.7 | 55.8 | |
| Private including HMO | 35.0 | 37.1 | 35.1 | |
| Self pay/no charge/other | 9.0 | 6.9 | 8.9 | |
| Hospital characteristics | ||||
| Hospital bed size | <0.001 | |||
| Small | 6.9 | 6.9 | 6.9 | |
| Medium | 18.8 | 22.1 | 19.0 | |
| Large | 73.3 | 70.6 | 73.2 | |
| Hospital Location | ||||
| Rural | 6.6 | 5.6 | 6.5 | |
| Urban | 92.4 | 94.0 | 92.5 | |
| Hospital Region | <0.001 | |||
| Northeast | 20.3 | 19.5 | 20.3 | |
| Midwest or North Central | 28.0 | 22.6 | 27.7 | |
| South | 41.5 | 35.8 | 41.2 | |
| West | 9.9 | 21.9 | 10.6 | |
| Hospital Teaching status | <0.001 | |||
| Non-teaching | 43.9 | 42.4 | 43.8 | |
| Teaching | 55.1 | 57.1 | 55.2 | |
| Admission types | <0.001 | |||
| Emergent/Urgent | 74.5 | 69.0 | 74.2 | |
| Elective admission | 24.6 | 29.9 | 24.9 | |
| Admission day | <0.001 | |||
| Weekdays | 83.3 | 87.1 | 83.5 | |
| Weekend | 16.7 | 12.9 | 16.5 | |
| No. of Vessel stents ¶ | <0.001 | |||
| Single Vessel Single Stent | 50.3 | 50.7 | 50.3 | |
| Single Vessel multiple stents | 17.2 | 22.3 | 17.5 | |
| Bifurcation Stenting | 2.5 | 3.6 | 2.6 | |
| Multivessel Stenting | 15.8 | 20.5 | 16.1 | |
| Type of Stent ¶ | ||||
| Bare Metal Stent | 29.2 | 22.7 | 28.8 | <0.001 |
| Drug Eluting Stent | 73.1 | 79.9 | 73.5 | <0.001 |
| AMI | 46.3 | 33.0 | 45.5 | <0.001 |
| Shock | 1.4 | 1.0 | 1.3 | <0.001 |
| Length of stay (days) (Mean±SE) | 2.8±0.01 | 2.55±0.02 | 2.78±0.01 | <0.001 |
| Cost of Hospitalization($)(Means ± SE) | 18,019±18 | 19,779±14 | 18,111±18 | <0.001 |
| Disposition | <0.001 | |||
| Home | 95.2 | 96.9 | 95.3 | |
| Facility/others | 3.6 | 2.4 | 3.6 | |
| Death | 0.8 | 0.4 | 0.8 | <0.001 |
∗ Race was missing in 18% of the study population and hence excluded in the multivariable analysis.
† Charlson/Deyo comorbidity index was calculated as per Deyo classification.
‡ Variables are AHRQ comorbidity measures.
§ This represents a quartile classification of the estimated median household income of residents in the patient’s ZIP Code. These values are derived from ZIP Code-demographic data obtained from Claritas. The quartiles are identified by values of 1 to 4, indicating the poorest to wealthiest populations. Because these estimates are updated annually, the value ranges vary by year. http://www.hcupus.ahrq.gov/db/vars/zipinc_qrtl/nisnote.jsp .
¶ All the procedure and diagnosis were identified by using International Classification of Disease (ICD-9) codes. 36.06 Insertion of non-drug-eluting coronary artery stent (bare metal stent), 36.07 insertion of drug-eluting coronary artery stent, 410.xx acute myocardial infarction, 785.5x shock,00.40 procedure on single vessel, 00.41 procedure on two vessels, 00.42 procedure on three vessels, 00.43 procedure on four or more vessels, 00.44 procedure on vessel bifurcation, 00.45 insertion of one vascular stent, 00.46 insertion of two vascular stents, 00.47 insertion of three vascular stents, 00.48 insertion of four or more vascular stents.
The mean LOS for the population was 2.78 ± 0.01 days (2.5 ± 0.02 days for IVUS and 2.80 ± 0.01 days for AO PCIs, p <0.001). Overall cost of hospitalization was $18,111 ± 18 ($19,779 ± 14 for IVUS and $18,019 ± 18 for AO, p <0.001). The mortality rate was lower in patients receiving IVUS (0.4% in IVUS group vs 0.8% in angiography group, p <0.001). The overall complications rate was similar in the 2 groups (5.5%); however, vascular and iatrogenic cardiac complications were more frequent in the IVUS group (2% vs 1.7%, p <0.001, and 1.7% vs 1.4%, p <0.001; Table 2 ).
| Complications | Angiography guided PCI | IVUS guided PCI | Overall | P-value |
|---|---|---|---|---|
| Overall any complication | 5.5 | 5.5 | 5.5 | 0.538 |
| Vascular complications | 1.7 | 2 | 1.8 | <0.001 |
| Postoperative hemorrhage requiring transfusion | 0.5 | 0.7 | 0.5 | <0.001 |
| Vascular injury | 1.2 | 1.4 | 1.3 | <0.001 |
| Cardiac complications | 1.4 | 1.8 | 1.5 | <0.001 |
| Iatrogenic cardiac complications | 1.4 | 1.7 | 1.4 | <0.001 |
| Pericardial complications | 0.1 | 0.1 | 0.1 | <0.001 |
| Requiring CABG | 0.01 | 0.01 | 0.01 | 0.012 |
| Respiratory complications (Post-op resp failure) | 1.5 | 1 | 1.5 | <0.001 |
| Postop-Stroke/TIA/Stroke effects | 0.2 | 0.2 | 0.2 | 0.372 |
| Renal and metabolic complications | 0.24 | 0.15 | 0.2 | <0.001 |
| Postoperative DVT/PE | 0.3 | 0.3 | 0.3 | 0.930 |
| Postop infectious complications | 0.5 | 0.4 | 0.5 | 0.01 |
∗ Details in supplementary Table 2 .
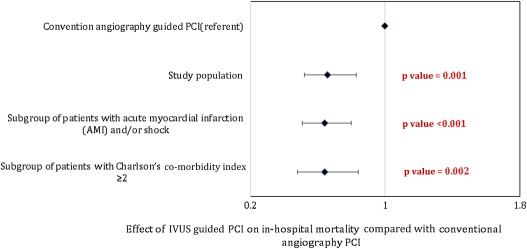
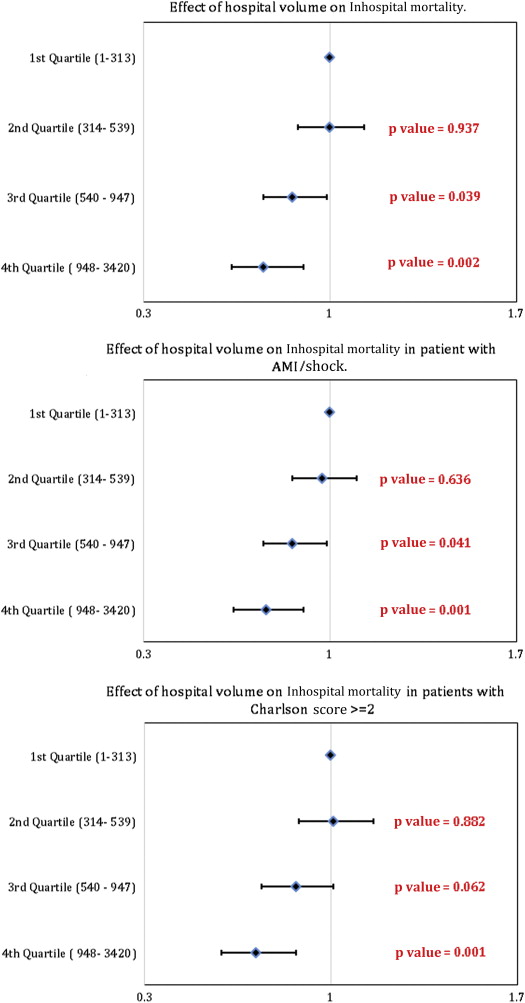
In a multivariate model, significant predictors of higher mortality were increasing age, female gender, higher baseline co-morbidity burden (high CCI score), presence of AMI or shock, weekend and emergent admission, or occurrence of any complication during hospitalization ( Table 3 ). Significant predictors of reduced mortality were use of IVUS guidance for PCI (odds ratio [OR] 0.65, 95% CI 0.52 to 0.83; p <0.001; Figure 1 ) and higher hospital volumes (third and fourth quartiles; Figure 2 ). Similar results were obtained in a multivariate analysis performed in a subgroup of patients with AMI and/or shock and those with higher co-morbidity burden (CCI score ≥2; Table 4 and Figures 1 and 2 . Multivariate predictors of increased LOS and cost of hospitalization are listed in Table 5 . The use of IVUS did not significantly alter the LOS; however, it was associated with slightly higher hospitalization costs compared with AO PCIs ($2302; 95% CI $1912 to $2693; p <0.001).
| Variables | Odds Ratio | LL | UL | P-value |
|---|---|---|---|---|
| Presence of any complications | 5.80 | 5.25 | 6.41 | <0.001 |
| Age (10 year increment) | 1.63 | 1.56 | 1.71 | <0.001 |
| Female | 1.12 | 1.03 | 1.22 | 0.007 |
| AMI | 3.70 | 3.24 | 4.23 | <0.001 |
| Shock | 15.40 | 13.86 | 17.12 | <0.001 |
| Charlson/Deyo comorbidity index ∗ | ||||
| 0 | Referent | Referent | Referent | |
| 1 | 1.81 | 1.36 | 2.42 | <0.001 |
| ≥2 | 2.81 | 2.11 | 3.75 | <.001 |
| Median household income category for patient’s zip code † | ||||
| 1. 0-25th percentile | Referent | Referent | Referent | |
| 2. 26-50th percentile | 1.00 | 0.89 | 1.12 | 0.968 |
| 3. 51-75th percentile | 0.97 | 0.86 | 1.10 | 0.620 |
| 4. 76-100th percentile | 0.94 | 0.82 | 1.09 | 0.418 |
| Procedure | ||||
| Angiography | Referent | Referent | Referent | |
| IVUS | 0.65 | 0.52 | 0.83 | <0.001 |
| Primary Payer | ||||
| Medicare / Medicaid | Referent | Referent | Referent | |
| Private including HMO | 0.86 | 0.75 | 0.97 | 0.018 |
| Self pay/no charge/other | 1.27 | 1.07 | 1.51 | 0.007 |
| Teaching vs non-teaching hospital | 1.02 | 0.91 | 1.14 | 0.717 |
| Weekend vs Weekdays admission | 1.14 | 1.04 | 1.26 | 0.007 |
| Emergent/urgent admission vs elective | 1.58 | 1.36 | 1.84 | <.001 |
| Hospital Region | ||||
| Northeast | Referent | Referent | Referent | |
| Midwest or North Central | 1.17 | 0.98 | 1.39 | 0.083 |
| South | 1.45 | 1.23 | 1.71 | <.001 |
| West | 1.17 | 0.96 | 1.43 | 0.128 |
| hospital Volume (Quartile) | ||||
| 1st Quartile (1-313) | Referent | Referent | Referent | |
| 2nd Quartile (314- 539) | 1.00 | 0.88 | 1.13 | 0.937 |
| 3rd Quartile (540 – 947) | 0.86 | 0.75 | 0.99 | 0.039 |
| 4th Quartile ( 948- 3420) | 0.75 | 0.63 | 0.90 | 0.002 |
| c-Index | 0.92 |
∗ Charlson/Deyo comorbidity index was calculated as per Deyo classification.
† Please refer Table 1 .
| Variables | AMI and/or Shock | Charlson Score >= 2 | ||||||
|---|---|---|---|---|---|---|---|---|
| Odds ratio | LL | UL | P-value | Odds ratio | LL | UL | P-value | |
| Presence of any complications | 9.00 | 8.22 | 9.84 | <.001 | 4.90 | 4.37 | 5.48 | <.001 |
| Age (10 year increment) | 1.61 | 1.54 | 1.69 | <.001 | 1.60 | 1.52 | 1.68 | <.001 |
| Female | 1.12 | 1.03 | 1.21 | 0.006 | 1.05 | 0.95 | 1.15 | 0.347 |
| AMI | Referent Group | 3.40 | 2.93 | 3.94 | <.001 | |||
| Shock | 13.01 | 11.55 | 14.67 | <.001 | ||||
| Charlson/Deyo comorbidity index ∗ | ||||||||
| 0 | Referent Group | |||||||
| 1 | Referent | Referent | Referent | |||||
| ≥2 | 1.66 | 1.51 | 1.83 | <.001 | ||||
| Median household income category for patient’s zip code | ||||||||
| 1. 0-25 th percentile | Referent | Referent | Referent | Referent | Referent | Referent | ||
| 2. 26-50 th percentile | 1.03 | 0.93 | 1.15 | 0.559 | 0.98 | 0.86 | 1.11 | 0.713 |
| 3. 51-75 th percentile | 0.96 | 0.86 | 1.09 | 0.539 | 1.01 | 0.87 | 1.16 | 0.934 |
| 4. 76-100 th percentile | 1.01 | 0.87 | 1.16 | 0.925 | 0.99 | 0.86 | 1.15 | 0.932 |
| Procedure | ||||||||
| Angiography | Referent | Referent | Referent | Referent | Referent | Referent | ||
| IVUS | 0.64 | 0.51 | 0.80 | <.001 | 0.64 | 0.48 | 0.84 | 0.002 |
| Primary Payer | ||||||||
| Medicare / Medicaid | Referent | Referent | Referent | Referent | Referent | Referent | ||
| Private including HMO | 0.82 | 0.72 | 0.93 | 0.002 | 0.87 | 0.75 | 1.01 | 0.075 |
| Self pay/no charge/other | 1.28 | 1.08 | 1.51 | 0.004 | 1.15 | 0.94 | 1.41 | 0.174 |
| Teaching vs non-teaching hospital | 0.98 | 0.88 | 1.10 | 0.747 | 1.01 | 0.89 | 1.14 | 0.920 |
| Weekend vs Weekdays admission | 1.16 | 1.06 | 1.27 | 0.001 | 1.13 | 1.01 | 1.26 | 0.029 |
| Emergent/urgent admission vs elective | 1.59 | 1.35 | 1.88 | <.001 | 1.59 | 1.33 | 1.92 | <.001 |
| Hospital Region | ||||||||
| Northeast | Referent | Referent | Referent | Referent | Referent | Referent | ||
| Midwest or North Central | 1.20 | 1.01 | 1.43 | 0.037 | 1.18 | 0.99 | 1.40 | 0.067 |
| South | 1.39 | 1.17 | 1.65 | <.001 | 1.43 | 1.21 | 1.69 | <.001 |
| West | 1.22 | 1.00 | 1.49 | 0.049 | 1.14 | 0.92 | 1.40 | 0.231 |
| hospital Volume (Quartile) | ||||||||
| 1st Quartile (1-313) | Referent | Referent | Referent | Referent | Referent | Referent | ||
| 2nd Quartile (314- 539) | 0.97 | 0.86 | 1.10 | 0.636 | 1.01 | 0.88 | 1.16 | 0.882 |
| 3rd Quartile (540 – 947) | 0.86 | 0.75 | 0.99 | 0.041 | 0.87 | 0.74 | 1.01 | 0.063 |
| 4th Quartile ( 948- 3420) | 0.76 | 0.64 | 0.90 | 0.001 | 0.72 | 0.59 | 0.87 | 0.001 |
| c-Index | 0.83 | 0.89 | ||||||
Stay updated, free articles. Join our Telegram channel

Full access? Get Clinical Tree


