In a fraction of patients aged ≥90 years, less-invasive transcatheter aortic valve implantation (TAVI) has been considered a therapeutic option for aortic stenosis under careful clinical screening. However, the safety and effectiveness using TAVI in such a population has not been fully elucidated. The aim of the present study was to investigate the feasibility of TAVI in nonagenarians. We prospectively enrolled 136 consecutive patients with severe aortic stenosis who were referred for TAVI. The procedural, early, and midterm clinical outcomes were compared between patients aged <90 years (n = 110, average age 82.3 ± 8.3 years) and ≥90 years (n = 26; average age 91.6 ± 1.9 years). A comparison of the baseline characteristics revealed that among patients aged ≥90 years, the prevalence of women (50% vs 81%, p <0.001) and the mean aortic valve gradient (45.5 ± 15.4 vs 56.3 ± 23.4 mm Hg, p = 0.005) were greater than those in patients aged <90 years. Major vascular complications occurred more frequently in patients ≥90 years (5% vs 19%, p = 0.022), although the rate of procedural success and 30-day and 6-month mortality were not different between the 2 age groups (96% vs 100%, p = 0.58; 6% vs 15%, p = 0.22; and 14% vs 27%, p = 0.14, respectively). The mortality rates were greater among patients aged ≥90 years. At 6 months, both groups of survivors were similar in symptom status, with a New York Heart Association classification less than class II (89% vs 84%, p = 0.68). The cumulative survival (median 13.4 ± 8.0 months of follow-up) was not significantly different between the 2 age groups (p = 0.22, log-rank test). In conclusion, even very elderly nonagenarians can experience acceptable clinical results and benefits after TAVI.
Aortic valve replacement (AVR) has been performed for many patients at the advanced age of ≥80 years, resulting in functional benefits and adequate clinical outcomes. In addition, since the introduction of transcatheter aortic valve implantation (TAVI), large numbers of elderly patients worldwide, who were considered too high risk to undergo cardiac surgery, have been also treated using this less-invasive, catheter-based method. Furthermore, 2 pivotal trials demonstrated that TAVI significantly reduced mortality compared to medical therapy and was comparable to conventional AVR among these high-risk patients. Although these TAVI study populations were composed mainly of octogenarians and some nonagenarians, this treatment is thought to be challenging for nonagenarians, and its use in this population is still under debate. To date, no studies have focused on the clinical data from nonagenarians after TAVI. Therefore, the aim of the present study was to compare the procedural results, status of clinical symptoms, and early to midterm outcomes of TAVI between nonagenarian and other patient populations.
Methods
From December 2007 to June 2011, 137 consecutive patients who were diagnosed with severe symptomatic aortic stenosis (AS) and were at high surgical risk were prospectively enrolled in the present study at the Henri Mondor University Hospital. “Severe AS” was defined as an aortic valve area of <0.8 cm 2 , a peak aortic jet velocity of >4.0 m/s, or mean aortic valve gradient >40 mm Hg, as determined by echocardiography. Evaluation of the operative risk was calculated using the logistic European System for Cardiac Operative Risk Evaluation and the Society of Thoracic Surgeons predictive risk of mortality score. A high risk of surgery was defined as a logistic European System for Cardiac Operative Risk Evaluation >20% or Society of Thoracic Surgeons Predictive Risk of Mortality score >10% and was also assessed by the presence of cardiac or noncardiac co-morbidities. From the prescreening results, patients had been determined to be unsuitable for conventional AVR by both a cardiac surgeon and a cardiologist. The decision to use TAVI in these nonagenarians was determined by the usual indicators for TAVI but with additional confirmation that the patients were free from severe dementia, understood this procedure, could receive supportive care in the hospital and from their family, had a life expectancy of >1 year, and were expected to experience improvement in their activities of daily life. One male patient (aged 84 years) was excluded from the initial analysis because TAVI was not performed. The patient had experienced a stroke before implantation of the valve. The remaining 136 patients were divided into 2 groups: those aged <90 years and those aged ≥90 years. All the data to be analyzed were obtained from the patients’ medical records. The data included the baseline clinical findings; patient characteristics; findings from coronary angiography, computed tomography, transthoracic echocardiography, and transesophageal echocardiography; procedural parameters; and the length of intensive care unit and hospital stays. Information regarding patient survival was obtained from the treating hospital or through telephone calls directly to the patients. The status of the clinical symptoms was evaluated using the New York Heart Association (NYHA) classification system for all patients at baseline. The survivors were also evaluated 6 months after TAVI. The medical ethics committee at Henri Mondor University Hospital, Val-de-Marne University approved the study protocol, and all patients provided written informed consent before the TAVI procedure.
The TAVI procedure was previously reported in detail. In brief, the access route was first chosen as the femoral artery; other access sites (the subclavian or carotid artery) were considered when femoral access was not suitable for advancing the large sheath. The femoral artery was punctured percutaneously and closed using a suture device (Proster XL, Abbott, Chicago, Illinois), and the other access sites were managed surgically. We used 2 commercially available systems: a self-expandable prosthesis, the Medtronic CoreValve Revalving System (Medtronic, Minneapolis, Minnesota), and a balloon-expandable prosthesis, the Edwards SAPIEN valve (Edwards Lifesciences, Irvine, California). After the procedure, all patients were evaluated using transthoracic echocardiography and, if required, transesophageal echocardiography. In accordance with the Valve Academic Research Consortium (VARC) criteria, procedural complications, device success, and 30-day combined safety were evaluated. According to the VARC criteria, bleeding complications were classified as “life-threatening,” “major,” or “minor.” Vascular and stroke complications were also classified as major or minor. Acute kidney injury was classified as grade 1 and 2, or 3, with a grade greater than 2 defined as an acute kidney injury complication. The combined safety end point was set as any of the following: all-cause mortality, major stroke, life-threatening bleeding, acute kidney injury stage 3 (including renal replacement therapy), periprocedural myocardial infarction, major vascular complications, or repeat procedure for valve-related dysfunction (surgical or interventional therapy). The degree of pre- and postprocedural aortic regurgitation and mitral regurgitation were measured with color Doppler using transthoracic echocardiography on the basis of the current guidelines and the VARC definition. Semiquantitative analysis was applied to preprocedural aortic regurgitation and pre- and postprocedural mitral regurgitation: grade 0, none; grade 1, trivial; grade 2, mild; grade 3, moderate; and grade 4, severe.
All statistical analyses were performed using the SPSS software, version 19 (SPSS, Chicago, Illinois). Continuous variables are expressed as the mean ± SD or median, depending on the variable distribution. Categorical data are expressed as the percentage of the total. Comparisons between the 2 groups were performed using the chi-square test or the unpaired Student’s t test, as appropriate. The Kaplan-Meier method was used to estimate the cumulative mortality rates in the 2 age groups. Differences in mortality between the 2 groups were compared using the log-rank test. Cox regression analysis was used to detect the predictive values of cumulative survival at follow-up between the 2 groups. All statistical tests were 2-sided, and p <0.05 was considered significant.
Results
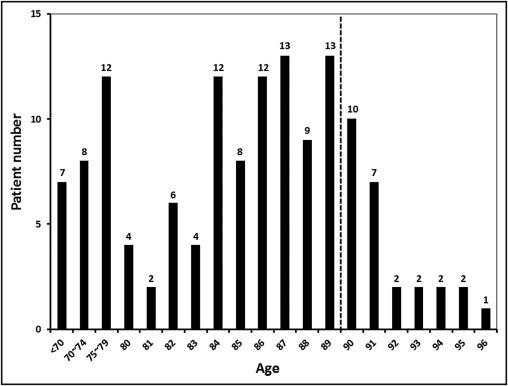
The baseline patient characteristics are listed in Table 1 , and the age distribution of all 136 patients is presented in Figure 1 . The echocardiographic findings are listed in Table 2 . The group aged <90 years included 110 patients (81% of the total enrolled), with a mean age of 82.3 ± 8.3 years. The group aged ≥90 years included 26 patients (19%), with a mean age of 91.6 ± 1.9 years. The prevalence of women was lower in the <90-years group than the ≥90-year group (50% vs 81%; p = 0.004). All parameters related to body characteristics showed significant differences between the 2 groups. In the ≥90-year group, the patients had a lower height, lower weight, lower body mass index, and lower body surface area. Smoking was more prevalent, and β blockers were more frequently prescribed for patients aged <90 years than those aged ≥90 years (p = 0.004 and p = 0.046, respectively). Other baseline characteristics did not differ between the 2 groups, nor did the estimated operative mortalities calculated using the logistic European System for Cardiac Operative Risk Evaluation and Society of Thoracic Surgeons Predictive Risk of Mortality score (p = 0.25 and p = 0.55, respectively). The degree of AS was more severe in the patients aged ≥90 years than in those aged <90 years. Differences were present between the 2 groups with respect to the peak aortic valve gradient and mean aortic valve gradient. The prevalence of grade 2 or greater mitral regurgitation was also greater in patients aged ≥90 years (11% vs 35%, p = 0.006). The postprocedural peak aortic valve gradient and the presence of grade 2 aortic regurgitation or greater did not differ between the 2 groups.
| Variable | Overall (n = 136) | Age (years) | p Value | |
|---|---|---|---|---|
| <90 (n = 110) | ≥90 (n = 26) | |||
| Age (years) | 84.1 ± 7.3 | 82.3 ± 7.0 | 91.6 ± 1.9 | <0.001 |
| Woman | 76 (56%) | 55 (50%) | 21 (81%) | 0.004 |
| Height (cm) | 163.0 ± 8.3 | 163.6 ± 8.4 | 159.9 ± 7.3 | 0.047 |
| Weight (kg) | 69.0 ± 13.4 | 71.0 ± 13.1 | 60.2 ± 11.6 | <0.001 |
| Body mass index (kg/m 2 ) | 26.0 ± 4.7 | 26.6 ± 4.7 | 23.4 ± 4.4 | 0.003 |
| Body surface area (m 2 ) | 1.7 ± 0.18 | 1.8 ± 0.17 | 1.6 ± 0.16 | <0.001 |
| New York Heart Association class III/IV | 86 (63%) | 70 (64%) | 17 (65%) | 0.87 |
| Peripheral artery disease | 30 (22%) | 25 (23%) | 5 (19%) | 0.80 |
| Previous heart failure | 100 (74%) | 82 (75%) | 18 (69%) | 0.58 |
| Previous myocardial infarction | 16 (12%) | 11 (10%) | 5 (19%) | 0.19 |
| Previous cerebrovascular event | 15 (11%) | 12 (11%) | 3 (12%) | >0.99 |
| Previous cardiac surgery | 17 (13%) | 16 (15%) | 1 (4%) | 0.19 |
| Diabetes mellitus | 33 (24%) | 27 (25%) | 6 (23%) | >0.99 |
| Hypertension | 102 (75%) | 83 (76%) | 19 (73%) | 0.80 |
| Dyslipidemia | 72 (53%) | 62 (56%) | 10 (39%) | 0.10 |
| Smoking | 41 (30%) | 39 (36%) | 2 (8%) | 0.004 |
| Chronic obstructive pulmonary disease | 38 (28%) | 33 (30%) | 5 (19%) | 0.34 |
| Chronic kidney disease | 88 (65%) | 71 (65%) | 17 (65%) | 0.94 |
| Logistic European System for Cardiac Operative Risk Evaluation (%) | 24.1 ± 11.9 | 23.6 ± 12.4 | 26.6 ± 9.3 | 0.25 |
| Society of Thoracic Surgeons predictive risk of mortality score (%) | 12.5 ± 8.5 | 12.3 ± 8.8 | 13.4 ± 7.2 | 0.55 |
| Serum creatinine (μmol/L) | 107.9 ± 38.0 | 109.5 ± 39.5 | 101.5 ± 31.3 | 0.34 |
| Estimated glomerular filtration rate (ml/min/1.73 m 2 ) | 56.7 ± 23.0 | 57.3 ± 23.8 | 54.3 ± 19.7 | 0.54 |
| Leukocyte count (×10 3 /µL) | 7.5 ± 2.3 | 7.7 ± 2.4 | 6.7 ± 1.8 | 0.047 |
| Hemoglobin (g/dl) | 11.9 ± 1.6 | 12.0 ± 1.6 | 11.4 ± 1.4 | 0.061 |
| C-reactive protein (mg/dl) | 0.49 ± 0.91 | 0.48 ± 0.79 | 0.57 ± 1.3 | 0.66 |
| Aspirin | 86 (63%) | 68 (62%) | 18 (69%) | 0.48 |
| Clopidogrel | 30 (22%) | 25 (23%) | 5 (19%) | 0.80 |
| Antivitamin K | 36 (27%) | 31 (28%) | 5 (19%) | 0.48 |
| β Blocker | 56 (41%) | 50 (46%) | 5 (23%) | 0.046 |
| Angiotensin-converting enzyme inhibitors | 40 (29%) | 33 (30%) | 7 (27%) | 0.76 |
| Angiotensin receptor blockers | 25 (18%) | 21 (19%) | 4 (15%) | 0.66 |
| Diuretics | 94 (69%) | 75 (68%) | 19 (73%) | 0.63 |
| Statin | 58 (43%) | 46 (42%) | 12 (46%) | 0.69 |
| Variable | Overall (n = 136) | Age (years) | p Value | |
|---|---|---|---|---|
| <90 (n = 110) | ≥90 (n = 26) | |||
| Baseline | ||||
| Left ventricle ejection fraction (%) | 49.1 ± 13.8 | 48.6 ± 14.2 | 51.3 ± 12.3 | 0.38 |
| Left ventricle ejection fraction >50% | 67 (49%) | 54 (49%) | 13 (50%) | |
| Left ventricle ejection fraction 30–50% | 49 (36%) | 39 (35%) | 10 (38%) | 0.87 |
| Left ventricle ejection fraction ≤30% | 20 (15%) | 17 (16%) | 3 (12%) | |
| Aortic valve area (cm 2 ) | 0.68 ± 0.20 | 0.68 ± 0.20 | 0.57 ± 0.20 | 0.001 |
| Corrected aortic valve area (cm 2 /m 2 ) | 0.40 ± 0.11 | 0.41 ± 0.11 | 0.37 ± 0.12 | 0.066 |
| Peak gradient (mm Hg) | 75.3 ± 27.7 | 71.8 ± 23.5 | 91.2 ± 38.2 | 0.002 |
| Mean gradient (mm Hg) | 47.6 ± 17.6 | 45.5 ± 15.4 | 56.3 ± 23.4 | 0.005 |
| Aortic regurgitation grade 2 or greater | 19 (14) | 16 (15) | 3 (12) | >0.99 |
| Mitral regurgitation grade 2 or greater | 21 (15) | 12 (11) | 9 (35) | 0.002 |
| Pulmonary hypertension | 72 (53) | 55 (50) | 17 (65) | 0.16 |
| Pulmonary artery pressure (mm Hg) | 49.1 ± 15.5 | 48.5 ± 15.8 | 51.4 ± 14.8 | 0.45 |
| Postprocedure | ||||
| Left ventricle ejection fraction (%) | 52.4 ± 12.1 | 51.9 ± 11.5 | 54.4 ± 14.1 | 0.35 |
| Left ventricle ejection fraction >50% | 72 (53%) | 56 (51%) | 16 (62%) | |
| Left ventricle ejection fraction 30–50% | 52 (38%) | 45 (41%) | 7 (27%) | 0.41 |
| Left ventricle ejection fraction <30% | 12 (9%) | 9 (8%) | 3 (12%) | |
| Aortic valve are (cm 2 ) | 2.0 ± 0.43 | 2.0 ± 0.44 | 2.0 ± 0.43 | 0.81 |
| Peak gradient (mm Hg) | 15.9 ± 6.2 | 16.4 ± 6.0 | 12.4 ± 6.7 | 0.080 |
| Aortic regurgitation grade 2 or greater | 29 (21) | 22 (20) | 7 (27) | 0.43 |
| Mitral regurgitation grade 2 or greater | 21 (15) | 12 (11) | 9 (35) | 0.002 |
| Pulmonary hypertension | 55 (40) | 44 (40) | 11 (42) | 0.83 |
| Pulmonary artery pressure (mm Hg) | 44.4 ± 12.3 | 44.1 ± 12.9 | 45.4 ± 12.3 | 0.65 |
The procedural characteristics are listed in Table 3 . No significant differences were found in the procedural time, dose of contrast media, valve types, or the approach sites used between the 2 groups. Moreover, the length of hospital and intensive care unit stays in patients aged ≥90 years were equal to those of the patients aged <90 years (p = 0.55 and p = 0.87, respectively). In VARC-defined procedural variables, the procedural success rates were similar (96% vs 100%, p = 0.58). Although the occurrence of most procedural complications did not differ between the 2 groups, the major vascular complications were more prevalent in the group aged ≥90 years (5% vs 19%, p = 0.022). Thus, the 30-day combined safety end point showed a significant difference between the 2 groups (13% vs 31%, p = 0.037). The follow-up rate for both groups was 100%, and all patients were followed up for ≥6 months after TAVI. No statistically significant differences were found between the 2 groups with respect to the 30-day and 6-month mortality rates (6% vs 15%, p = 0.22; and 14% vs 27%, p = 0.14, respectively). However, the mortality of patients aged ≥90 years was double that of patients aged <90 years. We lost 7 patients aged ≥90 years within 6 months after TAVI. The clinical findings of these patients are listed in Table 4 . Most of patients were from the early half experience since introducing TAVI and had NYHA class III or IV at baseline. Of the 4 patients who died within 30 days, 2 had an associated vascular complication. At baseline, no patients were categorized as NYHA class I (0% vs 0%). The prevalence of NYHA class II and III was similar in the 2 groups (40 [36%] of 110 vs 9 [34%] of 26, p = 0.87; and 63 [57%] of 100 vs 11 [42%] of 26, p = 0.17, respectively). The rate of NYHA class IV was greater in patients aged ≥90 years than in those aged <90 years (7 [6%] of 110 vs 6 [23%] of 26, p = 0.014). Of these, 15 patients aged <90 years died (NYHA class II in 7, NYHA class III in 6, NYHA class IV in 2) and 7 patients aged ≥90 years died (NYHA class II in 1, NYHA class III in 3, and NYHA class IV in 3).
| Variable | Overall (n = 136) | Age (years) | p Value | |
|---|---|---|---|---|
| <90 (n = 110) | ≥90 (n = 26) | |||
| Periprocedural | ||||
| Procedure time (min) | 79.6 ± 27.7 | 79.7 ± 26.5 | 79.2 ± 32.8 | 0.93 |
| Fluoroscopy time (min) | 19.8 ± 9.9 | 20.3 ± 10.3 | 17.8 ± 8.2 | 0.27 |
| Contrast medium volume (ml) | 184.4 ± 89.9 | 187.5 ± 94.1 | 171.4 ± 70.3 | 0.46 |
| Medotronic CoreValve | 130 (95%) | 106 (96%) | 24 (92%) | 0.32 |
| Edwards SAPIEN | 6 (5%) | 4 (4%) | 2 (8%) | 0.32 |
| Transfemoral approach | 130 (96%) | 106 (96%) | 24 (92%) | 0.32 |
| Subclavian approach | 4 (3%) | 3 (3%) | 1 (4%) | 0.58 |
| Carotid approach | 2 (2%) | 1 (1%) | 1 (4%) | 0.35 |
| Postprocedural | ||||
| Length of stay in hospital (days) | 9.4 ± 7.7 | 9.6 ± 8.1 | 8.6 ± 5.8 | 0.55 |
| Length of stay in intensive care unit (days) | 3.4 ± 1.7 | 3.4 ± 1.6 | 3.4 ± 2.2 | 0.87 |
| 30-Day mortality | 11 (8%) | 7 (6%) | 4 (15%) | 0.22 |
| 6-Month mortality | 22 (16%) | 15 (14%) | 7 (27%) | 0.14 |
| Valve Academic Research Consortium | ||||
| Procedural success | 131 (96%) | 105 (96%) | 26 (100%) | 0.58 |
| 30-Day combined safety end point | 22 (16%) | 14 (13%) | 8 (31%) | 0.037 |
| Myocardial infarction | 2 (1%) | 1 (1%) | 1 (4%) | 0.83 |
| Stroke and transient ischemic accident | 9 (7%) | 5 (5%) | 4 (15%) | 0.068 |
| Major stroke | 3 (2%) | 2 (2%) | 1 (4%) | 0.47 |
| Acute kidney injury grade 2 or greater | 24 (18%) | 20 (18%) | 4 (15%) | >0.99 |
| Vascular complication (major) | 10 (7%) | 5 (5%) | 5 (19%) | 0.022 |
| Bleeding (life-threatening) | 6 (4%) | 5 (5%) | 1 (4%) | >0.99 |
| Bleeding (major) | 41 (30%) | 33 (30%) | 8 (31%) | >0.99 |
| Other complications | ||||
| Two-valve implantation | 3 (2%) | 3 (3%) | 0 (0%) | >0.99 |
| Device migration | 6 (4%) | 5 (5%) | 1 (4%) | >0.99 |
| Surgery for vascular complication | 8 (6%) | 4 (4%) | 4 (15%) | 0.043 |
| Red blood cell transfusion | 24 (18%) | 20 (18%) | 4 (15%) | >0.99 |
| Newly implantation of pacemaker | 23 (21%) | 20 (24%) | 3 (12%) | 0.39 |
| Cardiogenic shock during procedure | 4 (3%) | 3 (3%) | 1 (4%) | >0.99 |
| Cardiac tamponade during procedure | 1 (1%) | 1 (1%) | 0 (0%) | >0.99 |
| Conversion to aortic valve replacement | 1 (1%) | 1 (1%) | 0 (0%) | >0.99 |
| Ventricular fibrillation | 0 (0%) | 0 (0%) | 0 (0%) | >0.99 |
Stay updated, free articles. Join our Telegram channel

Full access? Get Clinical Tree


