Despite significant advances in therapies for patients with heart failure with reduced ejection fraction (HFrEF), there are no evidence-based therapies for heart failure with preserved ejection fraction (HFpEF), also known as diastolic heart failure (HF). Differences in pathophysiologic mechanisms are touted as to why patients with HFpEF purportedly do not derive similar therapeutic benefits compared with HFrEF. Similarly, the relative frequencies of HFpEF and HFrEF may differ between hospitalized and ambulatory settings. There are limited data on the prevalence, characteristics, treatment, and short-term outcomes of patients hospitalized with HFpEF. We sought to investigate these in patients hospitalized with HFpEF in an urban, hospitalized setting using the Get With The Guidelines registry. We retrospectively reviewed all consecutive discharges (n = 1,701) with a diagnosis of acute decompensated HF from December 1, 2006 to September 30, 2008. Patients with HFpEF (n = 499) were older, overweight, predominantly women, and had underlying hypertension and dyslipidemia. Presenting blood pressure and levels of creatinine were higher, with lower brain natriuretic peptide levels compared with patients with HFrEF (n = 598). Length of stay and 30-day mortality were comparable between patients with HFpEF and HFrEF. Thirty-day readmission was initially lower in patients with HFpEF. However 30-day mortality from any cause after the index HF hospitalization and survival curve at 1-year was no different between patients with HFpEF and HFrEF. In conclusion, lower 30-day readmissions do not translate into improved long-term outcome in patients with HFpEF.
Characteristics of patients with heart failure with preserved ejection fraction (HFpEF) are touted as older, predominantly women, with underlying hypertension, and less likely to have coronary artery disease. Additionally, patients with HFpEF have not derived clinical benefits from angiotensin-converting enzyme inhibition or angiotensin receptor blockade compared to patients with heart failure with reduced ejection fraction (HFrEF). Similarly, there are limited data on the prevalence, treatment, and short-term outcomes of patients hospitalized with HFpEF. Thus, the present study sought to provide these data in patients hospitalized with HFpEF in an urban hospitalized setting. We reviewed patient characteristics over a two year period of all patients with heart failure (HF) admitted to Boston Medical Center (BMC), an urban city hospital with an underrepresented patient population. We examined the risk factors and outcomes of all patients with HF.
Methods
The American Heart Association’s Get With The Guidelines (GWTG) program is a quality-improvement program that assists hospitals in ensuring that the cardiac care patients receive is in accordance with the most up-to-date guidelines and recommendations. Using the GWTG registry, we retrospectively reviewed all consecutive patients admitted and discharged from BMC with a diagnosis of acute decompensated HF from December 1, 2006 to September 30, 2008. Patients were considered eligible for inclusion if HF was the primary discharge diagnosis. Patient age, sex, admission and discharge date, and body weight were obtained by electronic chart review. Demographics, co-morbidities, and pertinent diagnostic and/or therapeutic studies were reviewed for each admission. We used the first available admission values for creatinine, hemoglobin, and brain natriuretic peptide. Glomerular filtration rate was calculated using the Modification of Diet in Renal Disease Study Group equation. Left ventricular EF (LVEF) was obtained by resting echocardiographic or nuclear stress tests either 30 days before or during the index admission. As per GWTG recommendations, the final study group included only patients who had undergone documentation of left ventricular systolic function within 30 days before or during hospitalization.
Patients with LVEF ≥50% were classified as HFpEF, whereas those with LVEF <50% were classified as having HFrEF. Survival was determined using the Social Security Death Index. For patients without a Social Security number, the last available hospital or clinic patient contact was used as the censoring date. If patients were admitted multiple times for HF during the study period, only the first readmission was utilized in the analyses.
The primary composite end point was defined as readmission for HF-free survival. The secondary end points included overall survival and 30-day mortality from any cause after the index HF hospitalization. The Boston University Medical Center Institutional Review Board approved the study.
Demographics and clinical characteristics of patients with HFpEF and HFrEF were compared using the 2-sample t test or Wilcoxon test for continuous variables and the Pearson chi-square test for categorical variables. Patients without contraindications or intolerance to medications were included when reporting medication use. We used a multivariate Cox proportional hazards model to estimate the risk of readmission and mortality in the follow-up period after excluding those patients with in-hospital mortality. Initially, all potential confounders were entered into the model. We then used a backward selection to retain significant variables (defined as p <0.2) in the final models. We used SAS software, version 9.3 (SAS Institute Inc., Cary, North Carolina). A p value of <0.05 was considered to be statistically significant.
Results
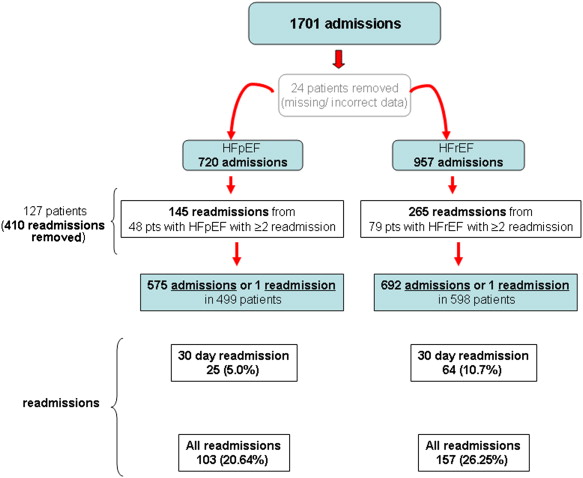
From December 1, 2006 to September 30, 2008, there were 1,701 HF admissions to BMC. Of these HF admissions, 127 patients had ≥2 admissions during the time period studied. These ranged from 2 to 13 recurrent admissions. Twenty-four patients had missing, mismatched, or incorrect data and were excluded from all analyses. In toto, 410 HF admissions were excluded. Thus, a total of 1,097 patients were included in this study. Four hundred ninety-nine patients (45%) had a diagnosis of HFpEF and 598 (55%) had HFrEF ( Figure 1 ).
Clinical characteristics are listed in Table 1 . Forty-five percent of all HF admissions were women and 45% were blacks. Mean age was 67 ± 14 years and mean LVEF was 43 ± 18%. Patients with HFpEF were older, women, and had underlying hypertension as a coexisting illness, compared with HFrEF. Additionally, patients with HFpEF were more overweight, had significantly lower rates of coronary artery disease and prior myocardial infarction than those with HFrEF. However, patients with HFpEF had significantly higher rates of hyperlipidemia but comparable rates of diabetes, atrial fibrillation, chronic obstructive pulmonary disease, peripheral vascular disease, chronic renal insufficiency, cerebrovascular accidents, and prior coronary artery bypass surgery or percutaneous coronary intervention than those with HFrEF.
| Variable | LVEF | ||
|---|---|---|---|
| ≥50% (n = 499) | <50% (n = 598) | p Value | |
| Age (yrs) | 68 ± 14 | 66.6 ± 14 | 0.05 |
| Women | 263 (53) | 232 (39) | <0.001 ∗ |
| Black | 208 (42) | 281 (47) | 0.07 |
| LVEF (%) | 60 ± 6 | 29 ± 11 | <0.001 ∗ |
| Hypertension | 391 (78) | 430 (72) | 0.01 ∗ |
| Diabetes mellitus | 209 (42) | 231 (38) | 0.27 |
| Hyperlipidemia | 230 (46) | 231 (39) | 0.01 ∗ |
| Coronary artery disease | 121 (24) | 213 (36) | <0.001 ∗ |
| Peripheral vascular disease | 39 (8) | 41 (7) | 0.5 |
| Previous myocardial infarction | 52 (10) | 122 (20) | <0.001 ∗ |
| Previous coronary artery bypass grafting | 5 (1) | 13 (2) | 0.13 |
| Previous percutaneous coronary intervention | 12 (2) | 9 (2) | 0.28 |
| Atrial fibrillation/atrial flutter | 97 (19) | 128 (21) | 0.4 |
| Chronic renal insufficiency | 64 (13) | 89 (15) | 0.32 |
| Chronic obstructive pulmonary disease | 123 (25) | 121 (20) | 0.07 |
| Cerebrovascular accident | 55 (11) | 72 (12) | 0.6 |
| Systolic blood pressure (mm Hg) | 150 ± 34 | 142 ± 32 | <0.001 ∗ |
| Mean arterial pressure (mm Hg) | 103 ± 22 | 103 ± 23 | 0.51 |
| Pulse (beats/min) | 80 ± 18 | 89 ± 21 | <0.001 ∗ |
| Weight (kg) | 90 ± 31 | 86 ± 28 | 0.01 ∗ |
| Admission laboratory values | |||
| Hemoglobin (g/dl) | 11.9 ± 3 | 12.4 ± 2 | 0.006 ∗ |
| Creatinine (mg/dl) | 1.82 ± 2 | 1.58 ± 1.4 | 0.03 ∗ |
| Modification of Diet in Renal Disease Study Group estimated glomerular filtration rate (ml/min/1.73 m 2 ) | 64.8 ± 34 | 65.3 ± 30 | 0.76 |
| Brain natriuretic peptide (pg/ml) | 679 ± 1,996 | 1,380 ± 1,546 | <0.001 ∗ |
| LOS (days), median (interquartile range) | 4.6 (2.8–7.8) | 4.8 (3.6–7.7) | NS |
| Medications received at discharge | |||
| Angiotensin-converting enzyme inhibitor | 232 (48) | 370 (65) | <0.001 ∗ |
| Angiotensin receptor blocker | 58 (12) | 69 (12) | 0.9 |
| β Blocker | 376 (77) | 496 (87) | <0.001 ∗ |
| Isosorbide dinitrate | 60 (17) | 138 (31) | <0.001 ∗ |
| Spironolactone | 9 (2) | 42 (8) | <0.001 ∗ |
On initial hospital presentation, patients with HFpEF were more hypertensive (150 ± 34 vs 142 ± 32 mm Hg), whereas those with HFrEF were more tachycardic (89 ± 21 vs 80 ± 18 beats/min). Patients with HFpEF had higher creatinine levels (1.82 ± 2.2 vs 1.58 ± 1.5 mg/dl; although Modification of Diet in Renal Disease glomerular filtration rate was no different) and lower brain natriuretic peptide (679 ± 1,997 vs 1,380 ± 1,547 pg/ml) and hemoglobin levels (11.95 ± 2.9 vs 12.4 ± 1.9 g/dl) than those with HFrEF. The average length of stay (LOS) for our cohort was 6.7 ± 6.2 days. Median LOS was no different between HFpEF (4.6 days; range 2.8 to 7.8) and HFrEF (4.8 days; range: 3.6 to 7.7) groups.
Despite there being no evidence-based therapies for HFpEF, angiotensin receptor blocker use was comparable between patients with HFpEF and HFrEF at discharge. However, there were significant differences in the percentage of other discharge medications between groups with patients with HFpEF being less likely to receive angiotensin-converting enzyme inhibitors (48% vs 65%), β blockers (77% vs 87%), spironolactone (2% vs 8%), and long-acting nitrates (17% vs 31%) at discharge than those with HFrEF.
There were 38 in-hospital deaths. The in-hospital mortality was comparable between HFpEF and HFrEF groups (2.7% vs 3.9%, p = 0.3).
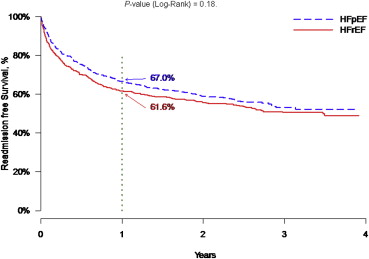
Patients were followed up until November 30, 2010. There were 24% total readmissions (260 of 1,097) during the follow-up period, of which 8% (89 of 1,097) occurred during the first 30 days after discharge. The 30-day readmission rate was lower among patients with HFpEF than those with HFrEF (5% vs 11%, p <0.001; Table 2 ). At 1 year (365 days) the Kaplan-Meier estimate of readmission-free rate for HFpEF and HFrEF groups was 67% versus 61.6%, respectively (p = 0.18; Figure 2 ). However, when looking at readmission-free survival over the follow-up period, the unadjusted hazard ratio [HR] for readmissions in those patients with HFpEF was greater compared with those with HFrEF and was 1.18 (95% confidence interval [CI] 0.995 to 1.397), p = 0.058. Multivariate analysis using a Cox proportional hazards regression model yielded an adjusted hazard ratio for readmission, in those with HFpEF compared with those with HFrEF, of 1.14 (95% CI 0.95 to 1.36), p = 0.16 ( Table 3 ). Confounders retained in the model included creatinine (HR 1.065, 95% CI 1.010 to 1.122; p <0.05) and hemoglobin (HR 1.044, 95% CI 1.004 to 1.085; p <0.05) and were predictors of readmission for all HF ( Table 3 ).
| Variable | LVEF | ||
|---|---|---|---|
| ≥50% (n = 499) | <50% (n = 598) | p Value | |
| 30-Day mortality † | 15 (2.7) | 16 (3.0) | 0.74 |
| 30-Day HF readmission rate | 25 (5.0) | 64 (10.7) | <0.001 ∗ |
| 30-Day mortality † or HF readmission | 40 (8.0) | 79 (13.2) | 0.006 ∗ |
∗ p <0.05 denoting significance.
† Excluding patients with in-hospital mortality. Unadjusted data.
| Variable | HR (95% CI) | p Value |
|---|---|---|
| HFpEF | 1.14 (0.95–1.36) | 0.162 |
| Women | 0.85 (0.7–1.02) | 0.083 |
| Black race | 0.71 (0.59–0.84) | <0.001 ∗ |
| Creatinine | 1.07 (1.01–1.112) | 0.020 ∗ |
| Modification of Diet in Renal Disease Study Group estimated glomerular filtration rate | 1.006 (1.003–1.009) | <0.001 ∗ |
| Received angiotensin receptor blocker at discharge | 0.75 (0.58–0.97) | 0.028 ∗ |
| Received aldosterone inhibitor at discharge | 0.711 (0.46–1.11) | 0.131 |
| Hemoglobin | 1.04 (1.00–1.09) | 0.031 ∗ |
| Pulse | 0.996 (0.991–1.00) | 0.043 ∗ |
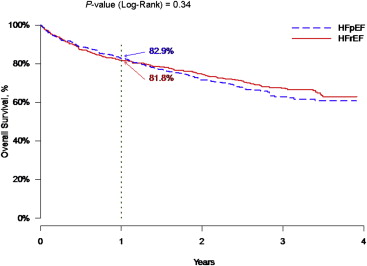
Survival data were available for 1,097 of the 1,097 patients, with a mean follow-up of 649 ± 463 days (median 819 days, range 0 to 1,428) until death or readmission. However, a total of 361 deaths occurred during the time period followed (399 including the in-hospital deaths) and were similar between HFpEF and HFrEF groups (p = 0.46). Similarly, all-cause 30-day mortality was no different between HFpEF and HFrEF groups (2.7% vs 3.0%, p = 0.74; Table 2 ). At 1 year (365 days) the mortality rate based on the Kaplan-Meier estimate for HFpEF and HFrEF groups was comparable at 17.1% versus 18.2%, respectively (p = 0.34; Figure 3 ). Multivariate analysis showed that age (HR 1.04, 95% CI 1.03 to 1.05; p <0.001), blood urea nitrogen (HR 1.007, 95% CI 1.00 to 1.014; p <0.05), receiving aldosterone inhibitor at discharge (HR 1.781, 95% CI 1.162 to 2.732; p = 0.008), and pulse rate (HR 1.007, 95% CI 1.00 to 1.01; p <0.01) were predictors of mortality for all HF ( Table 4 ). Using the composite end point of death or HF readmission, the unadjusted 30-day readmission or death rate was 8.0% versus 13.2% (p = 0.006) for HFpEF and HFrEF groups, respectively.