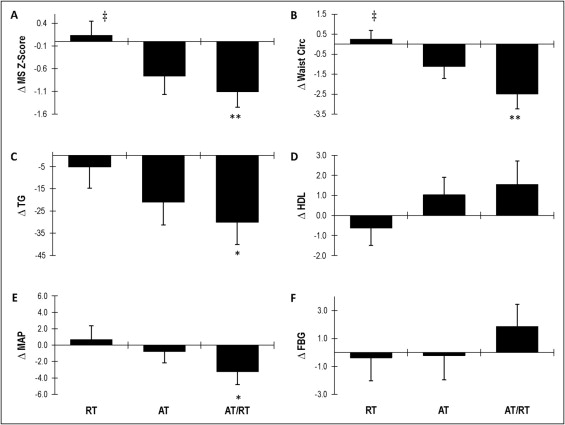
Aerobic training (AT) improves the metabolic syndrome (MS) and its component risk factors; however, to our knowledge, no randomized clinical studies have addressed whether resistance training (RT) improves the MS when performed alone or combined with AT. Sedentary, overweight dyslipidemic men and women, aged 18 to 70 years completed a 4-month inactive run-in period and were randomized to 1 of 3 eight-month exercise programs (n = 196). The exercise programs were (1) RT (3 days/week, 3 sets/day of 8 to 12 repetitions of 8 different exercises targeting all major muscle groups); (2) AT (∼120 minutes/week at 75% of the maximum oxygen uptake), and (3) AT and RT combined (AT/RT) (exact combination of AT and RT). Of the 196 randomized patients, 144 completed 1 of the 3 exercise programs. The 86 participants with complete data for all 5 MS criteria were used in the present analysis, and a continuous MS z score was calculated. Eight months of RT did not change the MS score. AT improved the MS score (p <0.07) and showed a trend toward significance compared to RT (p <0.10). AT/RT significantly decreased the MS score and was significantly different from RT alone. In conclusion, RT was not effective at improving the MS score; however, AT was effective. Combined AT and RT was similarly effective but not different from AT alone. When weighing the time commitment versus health benefit, the data suggest that AT alone was the most efficient mode of exercise for improving cardiometabolic health.
Numerous studies have examined the beneficial effects of aerobic training (AT) on the measures of obesity and cardiometabolic risk factors ; however, few randomized trials have examined the optimal mode of exercise or combination of modalities for specific cardiometabolic health benefits. The few studies evaluating the effects of resistance training (RT) on the metabolic syndrome (MS) have failed to use a robust RT program and did not directly compare RT to AT. Therefore, questions remain unaddressed whether RT alone improves cardiometabolic health in overweight and obese adults; whether AT is more effective than RT at improving cardiometabolic health; and whether AT and RT combined (AT/RT) provide additional improvements that outweigh or justify the additional time required for a combined program for improving this cardiometabolic end point. The Studies of a Targeted Risk Reduction Intervention through Defined Exercise (STRRIDE-AT/RT) was designed, in part, to address these questions in a large randomized trial of overweight and obese adults.
Methods
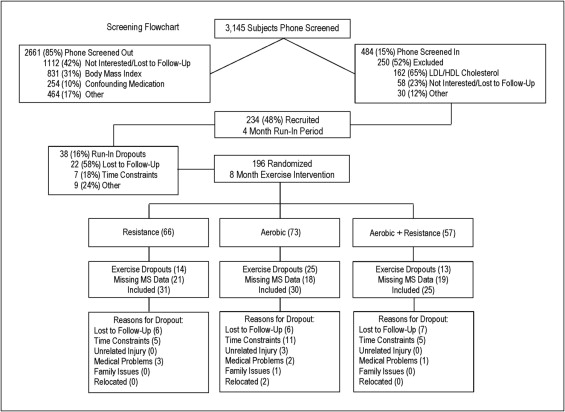
The institutional review boards at Duke University Medical Center (Duke) and East Carolina University (ECU) reviewed and approved the protocol. The subjects recruited for the STRRIDE-AT/RT study were selected from the 3,145 who responded to newspaper, magazine, and Internet advertisements and word of mouth from Durham, Greenville and the surrounding communities in North Carolina. The subjects were initially screened by telephone. Of these, 2,661 were screened out, leaving 484 eligible subjects. Of these, 250 were excluded after a more detailed assessment of interest and clinical inclusion criteria at an initial consent meeting, leaving 234 subjects who were recruited into the study ( Figure 1 ). Of the 234 subjects, 75% were recruited at Duke and the remaining 25% at ECU.
The inclusion criteria included age 18 to 70 years, sedentary (exercising ≤2 times/week), overweight or moderately obese (body mass index 25 to 35 kg/m 2 ), with mild to moderate dyslipidemia (either low-density lipoprotein [LDL] cholesterol 130 to 190 mg/dl or high-density lipoprotein [HDL] cholesterol ≤40 mg/dl for men or ≤45 mg/dl for women). The subjects were excluded if they used tobacco; had a history of diabetes, hypertension (systolic blood pressure >160 mm Hg and/or diastolic blood pressure >90 mm Hg or taking blood pressure medication), musculoskeletal disorders, or coronary artery disease; were currently dieting or intending to diet; were taking confounding medications; or were unwilling to be randomized into 1 of 3 study groups.
After informed written consent was obtained and the baseline tests were completed, all subjects were asked to maintain their current lifestyle for 4 months, followed by clinical testing and randomization into 1 of 3 exercise training groups. This period for all subjects constituted the inactive run-in period. Randomization was performed using a standard computer-based random number generator using a randomized design, blocked by gender, race, and study site. Of the subjects recruited, 196 (84%) completed the 4-month run-in period and were randomized. Of those randomized, 144 subjects (74%) completed the study. A subset of that group (86 of the 144) had data for all 5 criteria that constitute the MS at both testing points (after run-in/before training and after 8 months of exercise training), and the data from these subjects were included in the present analysis ( Table 1 ). Of the 5 MS criteria, the most often missed variable was the mean arterial pressure.
| Variable | RT (n = 31) | AT (n = 30) | AT + RT (n = 25) |
|---|---|---|---|
| Age (years) | 51.8 ± 11.0 | 51.1 ± 9.49 | 45.8 ± 11.8 |
| Body mass index (kg/m 2 ) | 30.3 ± 3.10 | 30.8 ± 3.20 | 30.4 ± 3.76 |
| Race (n) | |||
| White | 27 | 25 | 21 |
| Black | 3 | 5 | 4 |
| Other | 1 | 0 | 0 |
| Gender (n) | |||
| Female | 15 | 14 | 12 |
| Male | 16 | 16 | 13 |
| Resistance exercise | |||
| Frequency (sessions/week) | 3 | 3 | |
| Intensity | Progressive | Progressive | |
| Amount (sets/week) ⁎ | 72 | 72 | |
| Time (min/week) † | 135–180 | 135–180 | |
| Adherence (%) | 83.8 ± 13.8 | 77.6 ± 15.6 | |
| Actual frequency (sessions/week) | 2.52 ± 0.41 | 2.36 ± 0.45 | |
| Actual amount (sets/week) ‡ | 60.4 ± 9.91 | 55.9 ± 11.3 | |
| Aerobic exercise | |||
| Intensity (% peak oxygen consumption) | 65–80 | 65–80 | |
| Amount (kcal × kg −1 · week −1 ) § | 14 | 14 | |
| Time (min/week) | 130 ± 22.7 | 128 ± 26.7 | |
| Adherence (%) | 91.0 ± 10.0 | 77.9 ± 18.1 | |
| Actual frequency (sessions/week) | 3.07 ± 0.46 | 2.68 ± 0.64 | |
| Actual time (min/week) ¶ | 117 ± 19.6 | 99.7 ± 30.2 |
⁎ Amount (72 sets/week) = 3 days/week, 3 sets of 8 to 12 reps, using 8 different machines.
† Actual amount (min/week) = approximate range of number of minutes per week to complete prescribed sets/week.
‡ Actual amount (sets/week) = amount × adherence.
§ Amount (14 and 23 kcal × kg −1 week −1 ) approximately calorically equivalent to 12 and 20 miles of jogging per week, respectively.
The exercise groups were as follows: (1) RT (3 days/week, 3 sets/day, 8 to 12 repetitions/set); (2) AT (calorically equivalent to ∼12 miles/week at 65% to 80% peak oxygen consumption); (3) AT/RT (AT, calorically equivalent to ∼12 miles/week at 65% to 80% peak oxygen consumption plus RT, 3 days/week, 3 sets/day, 8 to 12 repetitions/set).
A ramp period of 8 to 10 weeks, designed to gradually increase the amount of aerobic exercise over time, was prescribed to all subjects followed by 5 to 6 additional training months at the appropriate exercise prescription. For subjects randomized to RT, the ramp period began with 1 set during weeks 1 and 2, 2 sets during weeks 3 and 4, building up to the prescribed amount of 3 sets by week 5.
The aerobic exercise prescription for the AT and AT/RT groups was 14 kcal/kg of body mass/week, which is calorically equivalent to approximately 12 miles/week of walking or jogging. The number of minutes of exercise needed per week was dependent on the prevailing fitness level. The calculation of the caloric expenditure was determined by each 1 L of oxygen consumed during exercise being equivalent to 5.0 kcal (this was not corrected for the respiratory exchange ratio). The details of the prescribed and actual exercise training amounts and frequency by group are listed in Table 1 . Although the amount of exercise is expressed in terms of walking or jogging, the actual exercise modes included treadmill, elliptical trainers, and cycle ergometers for the aerobic exercise.
All aerobic exercise sessions were verified by direct supervision and/or the use of a heart rate monitor that provided recorded, downloadable data (Polar Electro, Woodbury, New York). Aerobic compliance was calculated each week as a percentage, equal to the number of minutes completed within the prescribed heart rate range divided by the number of total minutes prescribed. All weekly compliance percentages were averaged to yield the overall aerobic adherence for each subject for the study ( Table 1 ).
The RT groups at Duke were prescribed 3 sessions/week of 3 sets of 8 to 12 repetitions on 8 Cybex weight lifting machines, 4 upper body and 4 lower body, designed to target all major muscle groups. The resistance training groups at ECU were prescribed 3 sessions/week of 3 sets of 8 to 12 repetitions on 8 Cybex machines, 2 free weight exercises, plus abdominal crunches, designed to target all major muscle groups. Eight Cybex machines were used at the Duke site throughout the study; however, at ECU, the prescribed resistance training program during the first 13 weeks used 8 Cybex machines until week 14, in which they began using free weights instead of the Cybex machines for all upper body exercises. The Cybex machine exercises involving the lower body remained the same throughout the study at ECU. For all participants, at both sites, study trainers determined the baseline amount of weight lifted for each exercise by selecting a weight that the participant could lift 8 to 12 times with proper form. Throughout the training intervention, the weight amounts were increased by 2.3 kg (5 lb) each time the participant performed 12 repetitions with proper form for all 3 sets during 2 consecutive workout sessions.
All RT sessions at Duke were verified by direct supervision and/or the use of the FitLinxx Strength Training Partner, a state-of-the-art technological computer system designed to monitor and track workouts electronically (FitLinxx, Norwalk, Connecticut). The “training partner” automatically sent data from each workout to the FitLinxx server computer, where it was aggregated once each week for compliance reports by the study staff. RT compliance was calculated each week as a percentage, equal to the number of sets completed divided by the number of sets prescribed. All weekly compliance percentages were averaged to yield the overall RT adherence ( Table 1 ).
No dietary prescriptions or instructions were provided to the participants, except for the prescription to not change their diet during the study period.
Height was measured to the nearest 0.25 cm. Body mass was measured with the subject in light clothing without shoes to the nearest 0.1 kg on a digital scale (Scale 5005, ScaleTronix, Wheaton, Illinois). The body mass index was calculated by dividing the body mass (kg) by the height (m 2 ). The waist circumference was taken around the abdomen at the level of the iliac crest twice and averaged. Two blood pressure readings were taken at rest approximately 20 minutes apart and averaged.
HDL cholesterol and triglycerides (TG) were determined from fasting plasma samples using nuclear magnetic resonance spectroscopy (LipoScience, Raleigh, North Carolina). Glucose was determined from fasting plasma samples at the beginning of an intravenous glucose tolerance test.
As previously described in earlier STRRIDE studies, the MS z score used for the present study was a continuous score of the 5 MS variables. A modified z score was calculated for each variable using individual subject data, the Adult Treatment Panel (ATP) III criteria, and standard deviations using data from the entire STRRIDE-AT/RT cohort at baseline (n = 234). Gender-specific MS z score equations were used to account for variations in the ATP III criteria for men and women. Standard deviations for HDL cholesterol and waist circumference were also determined separately for men and women. The equations used to calculate the MS z score were as follows: {z-Score = [(40 − HDL)/6.2] + [(TG − 150)/66.2] + [(fasting blood glucose − 100)/10.4] + [(waist circumference − 102)/9.3] + [(mean arterial pressure − 100)/8.7]} for men and { z score = [(50 − HDL)/11.8] + [(TG − 150)/66.2] + [(fasting blood glucose − 100)/10.4] + [(waist circumference − 88)/9.2] + [(mean arterial pressure − 100)/8.7]} for women. A MS risk factor score using the ATP III guidelines was also determined for each subject as a sum of the number of ATP III criteria met before and after the exercise intervention.
Cardiopulmonary exercise tests with 12-lead electrocardiography and expired gas analysis were performed with the subject on a treadmill using a TrueMax 2400 Metabolic Cart (ParvoMedics, Sandy, Utah). The 2 highest, consecutive, 15-second readings from each test were averaged to determine the peak oxygen consumption (L/min). A respiratory exchange ratio ≥1.10 was sought and achieved during 86% of the pre-training cardiopulmonary exercise test and 74% of the post-training cardiopulmonary exercise test (range 0.93 to 1.32).
The upper and lower body total amounts of weight lifted in kilograms from a single training session during week 5 were used as the baseline measure of overall strength and the same totals from a single session at approximately week 32 were used as the end of training measure of overall strength. By calculating the difference in the amount of weight lifted at week 32 from week 5, we determined the overall strength gains expressed in kilograms lifted/session.
All of the tests were completed after the 4-month run-in/pre-training and after the 8-month exercise training intervention.
The data were analyzed using analysis of variance (StatView or SAS software, SAS Institute, Cary, North Carolina). When the analysis of variance was impressionable (p <0.10), Fisher’s protected least significant difference post hoc analysis was performed to determine the differences between the groups ( Figure 2 ). Three pairwise comparisons (AT, RT, and AT/RT exercise groups compared to each other) were of interest. p Values <0.05 were considered significant in post hoc testing. Paired t tests, 2-tailed, were used to determine whether the post- versus pre-intervention score for changes within each group were significant ( Table 2 ).