Patients with end-stage renal disease commonly develop acute coronary syndromes (ACS). Little is known about the natural history of ACS in patients receiving dialysis. We evaluated the presentation, management, and outcomes of patients with ACS who were receiving dialysis before presentation for an ACS and were enrolled in the Global Registry of Acute Coronary Events (GRACE) at 123 hospitals in 14 countries from 1999 to 2007. Of 55,189 patients, 579 were required dialysis at presentation. Non–ST-segment elevation myocardial infarction was the most common ACS presentation in patients receiving dialysis, occurring in 50% (290 of 579) of patients versus 33% (17,955 of 54,610) of those not receiving dialysis. Patients receiving dialysis had greater in-hospital mortality rates (12% vs 4.8%; p <0.0001) and, among those who survived to discharge, greater 6-month mortality rates (13% vs 4.2%; p <0.0001), recurrent myocardial infarction (7.6% vs 2.9%; p <0.0001), and unplanned rehospitalization (31% vs 18%; p <0.0001). The outcome in patients receiving dialysis was worse than that predicted by their calculated GRACE risk score for in-hospital mortality (7.8% predicted vs 12% observed; p <0.05), 6-month mortality/myocardial infarction (10% predicted vs 21% observed; p <0.05). In conclusion, in the present large multinational study, approximately 1% of patients with ACS were receiving dialysis. They were more likely to present with non–ST-segment elevation myocardial infarction, and had markedly greater in-hospital and 6-month mortality. The GRACE risk score underestimated the risk of major events in patients receiving dialysis.
Cardiovascular disease is the major cause of mortality and morbidity in patients with end-stage renal disease. The number of patients receiving renal replacement therapy has been increasing steadily worldwide, and the frequency with which clinicians encounter acute coronary syndromes (ACS) in patients receiving chronic dialysis is increasing. This unique cohort of patients, although relatively small, represents an important group for whom therapy remains ill-defined. Multiple studies have established renal function to be an important prognostic factor in patients with acute and chronic coronary artery disease, yet little is known about patients receiving dialysis, because they have usually been excluded from large randomized controlled trials that have established the evidence base for contemporary treatment of coronary artery disease. Data from small series have suggested that patients receiving dialysis often present with atypical symptoms and are less likely to be treated with traditional medical therapy and invasive therapy owing to a number of factors. These include hemodynamic instability, perceived excess bleeding risk, and, in general, a lack of clinical certainty about the best therapy because the representation of dialysis patients in large clinical trials has been minimal. This latter factor creates unease surrounding many of the therapies traditionally used for ACS. The Global Registry of Acute Coronary Events (GRACE) was a large multinational effort designed to understand the current presentation, treatment, and outcomes of patients with ACS. Because of its size, GRACE provides a unique opportunity to examine the presentation, management, treatment, and outcomes of patients receiving chronic dialysis who present with ACS.
Methods
The methods for the GRACE registry have been previously published in detail. GRACE was designed to reflect an unselected population of patients with ACS, irrespective of geographic region. A total of 123 hospitals located in 14 countries in North and South America, Europe, Australia, and New Zealand contributed data to this observational study. Data from all 123 sites were used for the present analysis.
Adult patients (age ≥18 years) admitted with a presumptive diagnosis of ACS at participating hospitals were potentially eligible for the study. The eligibility criteria were a clinical history of ACS accompanied by ≥1 of the following: electrocardiographic changes consistent with ACS, serial increases in biochemical markers of cardiac necrosis (creatine kinase-MB, creatine phosphokinase, or troponin), and documented coronary artery disease. Patients with noncardiovascular causes for the clinical presentation, such as trauma, surgery, or an aortic aneurysm, were excluded. Patients were followed up at approximately 6 months by telephone, clinic visits, or by telephone calls to their primary care physician to ascertain the occurrence of several long-term outcomes. Where required, study investigators received approval from their local hospital ethics or institutional review board for the conduct of the present study.
To enroll an unselected population of patients with ACS, the sites were encouraged to recruit the first 10 to 20 consecutive eligible patients each month. Regular audits were performed at all participating hospitals. The data were collected by trained study coordinators using standardized case report forms. The demographic characteristics, medical history, presenting symptoms, biochemical and electrocardiographic findings, treatment practices, and a variety of hospital outcome data were collected. Standardized definitions of all patient-related variables, clinical diagnoses, and hospital complications and outcomes were used (available from http://www.outcomes-umassmed.org ).
Patients were diagnosed with ST-segment elevation myocardial infarction (STEMI) when they had new or presumed new ST-segment elevation ≥1 mm seen in any location or new left bundle branch block on the index or subsequent electrocardiogram with ≥1 positive cardiac biochemical marker of necrosis (including troponin measurements, whether qualitative or quantitative). In cases of non–STEMI (NSTEMI), ≥1 positive cardiac biochemical marker of necrosis without new ST-segment elevation seen on the index or subsequent electrocardiogram had to be present. Unstable angina was diagnosed when serum biochemical markers indicative of myocardial necrosis in each hospital’s laboratory were within the normal range.
The present report focused on patients enrolled in GRACE from 1999 to 2007 who had a discharge diagnosis of ACS, had not been transferred from another hospital, and had a known dialysis status. The presentation, management, treatment, and outcomes of patients with ACS who were receiving dialysis were compared to those of patients not receiving dialysis. The outcomes for patients receiving dialysis were further evaluated according to the presenting diagnosis (i.e., STEMI, NSTEMI, or unstable angina). The predictive ability of the GRACE risk score for patients receiving dialysis was evaluated by comparing the predicted and observed rates of in-hospital mortality and death or myocardial infarction within 6 months of discharge from the hospital. Continuous variables are expressed as the median with the 25th and 75th percentiles, and categorical variables are expressed as proportions. The differences in categorical variables were evaluated using the chi-square test or Fisher’s exact test, as indicated; continuous variables were analyzed using the Mann-Whitney U test. All tests were 2-sided. Analyses were performed using SAS, version 9.1 (SAS Institute, Cary, North Carolina).
Results
The final study population included 55,189 patients, 579 of whom were receiving dialysis. The risk factors, medical history, and presentation characteristics of the patients receiving and not receiving dialysis are listed in Table 1 . Patients receiving dialysis were more likely to have a history of hypertension, myocardial infarction, percutaneous coronary intervention, coronary bypass graft surgery, diabetes, transient ischemic attack or stroke, and heart failure.
| Variable | Nondialysis (n = 54,610) | Dialysis (n = 579) | p Value |
|---|---|---|---|
| Age (years) | 67 (56, 76) | 68 (57, 76) | 0.40 |
| Men | 67% | 65% | 0.38 |
| Current smoker | 27% | 11% | <0.0001 |
| Major bleeding | 1.1% | 3.5% | <0.0001 |
| Heart failure | 10% | 30% | <0.0001 |
| Diabetes mellitus | 25% | 47% | <0.0001 |
| Hyperlipidemia ⁎ | 48% | 52% | 0.06 |
| Hypertension † | 62% | 87% | <0.0001 |
| Myocardial infarction | 30% | 46% | <0.0001 |
| Transient ischemic attack/stroke | 8.3% | 17% | <0.0001 |
| Coronary artery bypass grafting | 13% | 21% | <0.0001 |
| Percutaneous coronary intervention | 18% | 26% | <0.0001 |
| Presentation characteristics | |||
| Blood pressure (mm Hg) | 140 (120, 160) | 140 (120, 165) | 0.63 |
| Cardiac arrest | 1.9% | 1.6% | 0.53 |
| Initial creatinine (mg/dl) | 1.0 (0.9, 1.3) | 5.8 (3.5, 7.9) | <0.0001 |
| Killip class | |||
| I | 83% | 72% | <0.0001 |
| II | 12% | 20% | <0.0001 |
| III | 3.8% | 7.9% | <0.0001 |
| IV | 1.0% | 0.7% | 0.52 |
| Positive initial cardiac marker | 45% | 57% | <0.0001 |
| Pulse (beats/min) | 6 (65, 90) | 83 (71, 96) | <0.0001 |
| ST deviation on presentation | 54% | 50% | 0.037 |
| Global Registry of Acute Coronary Events risk score | 129 (105, 155) | 150 (126, 180) | <0.0001 |
⁎ Defined as previous diagnosis of elevated total cholesterol or low-density lipoprotein cholesterol or use of lipid-lowering therapy.
† Defined as per patient report or medical chart review documentation of previously diagnosed systemic arterial hypertension.
Of the patients receiving dialysis, ½ presented with NSTEMI (290 of 579) compared to approximately 1/3 of those in the nondialysis group (17,955 of 54,610). Patients receiving dialysis were more likely to present with Killip class II or III compared to those not receiving dialysis. When patients receiving dialysis were compared to those not receiving dialysis by the type of ACS (i.e., STEMI, NSTEMI, or unstable angina), similar differences in Killip class and baseline risk factors were noted ( Table 2 ).
| Variable | STEMI | NSTEMI | Unstable angina | |||
|---|---|---|---|---|---|---|
| Nondialysis (n = 19,088) | Dialysis (n = 147) | Nondialysis (n = 17,955) | Dialysis (n = 290) | Nondialysis (n = 17,567) | Dialysis (n = 142) | |
| Age (years) | 65 (54, 75) | 67 (58, 77) | 69 (58, 78) | 68 (57, 77) | 66 (56, 75) | 66 (57, 75) |
| Men | 71% | 70% | >66% | 63% | 64% | 65% |
| Current smoker | 36% | 18% | 24% | 9.5% | 21% | 8.1% |
| Heart failure | 6.4% | 32% | 14% | 32% | 11% | 25% |
| Diabetes mellitus | 21% | 43% | 28% | 51% | 26% | 42% |
| Hyperlipidemia | 39% | 48% | 49% | 55% | 57% | 51% |
| Hypertension | 53% | 86% | 65% | 88% | 69% | 87% |
| Myocardial infarction | 19% | 43% | 32% | 47% | 41% | 47% |
| Transient ischemic attack/stroke | 6.8% | 17% | 10% | 16% | 8.2% | 20% |
| Coronary artery bypass grafting | 5.4% | 13% | 14% | 25% | 19% | 22% |
| Percutaneous coronary intervention | 9.4% | 21% | 17% | 29% | 28% | 26% |
| Presentation | ||||||
| Blood pressure (mm Hg) | 137 (120, 157) | 143 (120, 160) | 142 (124, 161) | >141 (116, 170) | 140 (123, 160) | >140 (120, 160) |
| Cardiac arrest | 3.3% | 2.7% | 1.4% | 1.4% | 0.9% | 0.7% |
| Creatinine (mg/dl) | 1.0 (0.9, 1.2) | 5.6 (3.0, 8.0) | >1.1 (0.9, 1.3) | 6.1 (4.1, 8.0) | 1.0 (0.9, 1.2) | 5.2 (2.9, 7.7) |
| Killip class | ||||||
| I | 81% | 68% | 80% | 68% | 88% | 84% |
| II | 13% | 22% | 14% | 22% | 9.4% | 12% |
| III | 4.1% | 8.8% | 5.3% | 9.4% | 1.9% | 3.6% |
| IV | 1.7% | 0.7% | 0.6% | 0.7% | 0.5% | 0.7% |
| Positive marker | 61% | 72% | 70% | 75% | 0.0% | 0.0% |
| Pulse (beats/min) | 78 (65, 90) | 85 (72, 100) | 80 (68, 94) | 84 (71, 98) | 73 (63, 85) | 80 (70, 90) |
| ST deviation | 91% | 84% | 36% | 36% | 32% | 42% |
| Global Registry of Acute Coronary Events risk score | 142 (119, 167) | 167 (142, 192) | 132 (106, 159) | 151 (127, 180) | 111 (91, 133) | 135 (112, 157) |
The in-hospital use of statins, platelet glycoprotein IIb/IIIa inhibitors, aspirin, and enoxaparin was lower among patients receiving dialysis ( Table 3 ). Overall, percutaneous coronary intervention was performed less frequently in patients with ACS in the dialysis group ( Table 3 ), but the rates of primary percutaneous coronary intervention use did not differ between the 2 groups ( Figure 1 ) . The dialysis patients with STEMI were much less likely to receive any form of reperfusion than patients not receiving dialysis ( Figure 1 ).
| Variable | Nondialysis (n = 54,610) | Dialysis (n = 579) | p Value |
|---|---|---|---|
| In-hospital management | |||
| Angiotensin-converting enzyme inhibitor | 64% | 55% | <0.0001 |
| Angiotensin II receptor blocker | 5.8% | 9.5% | <0.001 |
| Angiotensin-converting enzyme inhibitor or angiotensin II receptor blocker. | 68% | 62% | <0.001 |
| Aspirin | 93% | 88% | <0.0001 |
| β Blocker | 83% | 80% | 0.054 |
| Enoxaparin | 53% | 34% | <0.0001 |
| Glycoprotein IIb/IIIa inhibitor | 24% | 15% | <0.0001 |
| Statin | 66% | 59% | <0.001 |
| Thienopyridine | 52% | 50% | 0.29 |
| Percutaneous coronary intervention | 36% | 26% | <0.0001 |
| Timing of percutaneous coronary intervention | |||
| <24 hours | 54% | 44% | 0.020 |
| 24–72 hours | 22% | 23% | |
| >72 hours | 23% | 33% | |
| Coronary artery bypass grafting | 4.7% | 5.1% | 0.69 |
| In-hospital outcome | |||
| Major bleeding | 2.4% | 4.4% | 0.002 |
| Death | 4.8% | 12% | <0.0001 |
| Atrial fibrillation/flutter | 7.7% | 11% | 0.004 |
| Cardiac arrest/ventricular fibrillation | 4.5% | 9.0% | <0.0001 |
| Congestive heart failure/pulmonary edema | 13% | 21% | <0.0001 |
| Recurrent myocardial infarction ⁎ | 2.3% | 3.2% | 0.24 |
| Stroke | 0.7% | 0.5% | 0.99 † |
| Treatments at discharge | |||
| Angiotensin-converting enzyme inhibitor | 62% | 55% | 0.004 |
| Angiotensin-converting enzyme inhibitor or angiotensin receptor blocker | 66% | 62% | 0.09 |
| Aspirin | 90% | 85% | <0.0001 |
| β Blocker | 78% | 75% | 0.21 |
| Nitrate | 38% | 49% | <0.0001 |
| Statin | 69% | 63% | 0.007 |
| Thienopyridine | 49% | 47% | 0.39 |
| Warfarin | 6.8% | 10% | 0.009 |
⁎ From data collected using most recent version of case-report form (about 2002 onward, n = 31,013); before that, data were missing (n = 24,176).

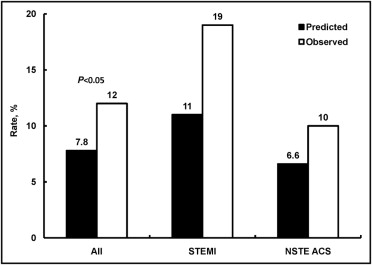
Patients receiving dialysis had markedly increased rates of in-hospital mortality (12% vs 4.8%; Table 3 ). The predicted rates of in-hospital mortality, using the GRACE risk score, were lower than those seen in practice, both overall and across the ACS subgroups ( Figure 2 ) .
At discharge, compared to patients not receiving dialysis, those receiving dialysis were equally likely to receive β blockers but were far less likely to receive angiotensin-converting enzyme inhibitors, statins, or aspirin ( Table 3 ). The use of angiotensin receptor blockers appeared to be more common in patients receiving dialysis, and the difference between the patients receiving dialysis and those not receiving dialysis was attenuated when comparing the use of either angiotensin receptor blockers or angiotensin-converting enzyme inhibitors.
Data on in-hospital management and outcomes and therapies given at discharge according to ACS type are listed in Table 4 .
| Variable | STEMI | NSTEMI | Unstable Angina | |||
|---|---|---|---|---|---|---|
| Nondialysis (n = 19,088) | Dialysis (n = 147) | Nondialysis (n = 17,955) | Dialysis (n = 290) | Nondialysis (n = 17,567) | Dialysis (n = 142) | |
| In-hospital management | ||||||
| Angiotensin-converting enzyme inhibitor | 71% | 57% | 63% | 53% | 58% | 56% |
| Angiotensin II receptor blocker | 4.2% | 10% | 7.0% | 9.1% | 6.3% | 9.5% |
| Angiotensin-converting enzyme inhibitor or angiotensin II receptor blocker | 74% | 63% | 68% | 60% | 63% | 63% |
| Aspirin | 94% | 86% | 93% | 89% | 92% | 87% |
| β Blocker | 85% | 78% | 85% | 81% | 80% | 82% |
| Enoxaparin | 49% | 36% | 60% | 34% | 51% | 34% |
| Glycoprotein IIb/IIIa inhibitor | 34% | 25% | 25% | 13% | 11% | 7.1% |
| Statin | 68% | 65% | 67% | 59% | 62% | 55% |
| Thienopyridine | 585 | 61% | 55% | 48% | 44% | 43% |
| Coronary artery bypass graft | 3.4% | 3.5% | 5.8% | 5.2% | 5.0% | 6.4% |
| Percutaneous coronary intervention | 50% | 43% | 32% | 20% | 24% | 21% |
| <24 hours | 74% | 71% | 38% | 18% | 31% | 35% |
| 24–72 hours | 11% | 9.1% | 33% | 41% | 33% | 19% |
| >72 hours | 15% | 20% | 29% | 41% | 37% | 46% |
| In-hospital outcome | ||||||
| Death | 7.5% | 19% | 4.1% | 11% | 2.5% | 9.2% |
| Atrial fibrillation/flutter | 9.2% | 13% | 8.6% | 10% | 5.3% | 9.9% |
| Cardiac arrest/ventricular fibrillation | 8.1% | 14% | 3.0% | 7.6% | 2.1% | 7.0% |
| Recurrent myocardial infarction | 3.5% | 5.9% | 2.7% | 3.4% | 0.3% | 0.0% |
| Stroke | 0.9% | 0.0% | 0.7% | 0.7% | 0.4% | 0.7% |
| Congestive heart failure/pulmonary edema | 18% | 27% | 14% | 21% | 7.1% | 15% |
| Major bleeding | 3.1% | 3.5% | 2.7% | 3.9% | 1.3% | 6.5% |
| Treatment at discharge | ||||||
| Angiotensin-converting enzyme inhibitor | 70% | 61% | 60% | 52% | 55% | 54% |
| Angiotensin-converting enzyme inhibitor or angiotensin II receptor blocker | 73% | 70% | 65% | 59% | 60% | 61% |
| Aspirin | 93% | 88% | 89% | 84% | 89% | 83% |
| β Blocker | 81% | 75% | 79% | 76% | 74% | 74% |
| Nitrate | 27% | 43% | 38% | 49% | 49% | 55% |
| Statin | 73% | 75% | 69% | 61% | 66% | 58% |
| Thienopyridine | 58% | 59% | 49% | 48% | 39% | 34% |
| Warfarin | 6.8% | 7.8% | 7.1% | 12% | 6.6% | 7.5% |
Stay updated, free articles. Join our Telegram channel

Full access? Get Clinical Tree


