Short- and long-term mortality in women who undergo coronary artery bypass grafting (CABG) has been evaluated in multiple studies with conflicting results. The investigators conducted a meta-analysis of all existing studies to evaluate the impact of female gender on mortality in patients who undergo isolated CABG. A comprehensive search of studies published through May 31, 2012 identified 20 studies comparing men and women who underwent isolated CABG. All-cause mortality was evaluated at short-term (postoperative period and/or at 30 days), midterm (1-year), and long-term (5-year) follow-up. Odds ratios (ORs) and 95% confidence interval (CIs) were calculated using a random-effects model. A total of 966,492 patients (688,709 men [71%], 277,783 women [29%]) were included in this meta-analysis. Women were more likely to be older; had significantly greater co-morbidities, including hypertension, diabetes mellitus, hyperlipidemia, unstable angina, congestive heart failure, and peripheral vascular disease; and were more likely to undergo urgent CABG (51% vs 44%, p <0.01). Short-term mortality (OR 1.77, 95% CI 1.67 to 1.88) was significantly higher in women. At midterm and long-term follow-up, mortality remained high in women compared with men. Women remained at increased risk for short-term mortality in 2 subgroup analyses including prospective studies (n = 41,500, OR 1.83, 95% CI 1.59 to 2.12) and propensity score–matched studies (n = 11,522, OR 1.36, 95% CI 1.04 to 1.78). In conclusion, women who underwent isolated CABG experienced higher mortality at short-term, midterm, and long-term follow-up compared with men. Mortality remained independently associated with female gender despite propensity score–matched analysis of outcomes.
The impact of female gender on clinical outcomes after isolated coronary artery bypass grafting (CABG) has been reported in multiple studies, with conflicting results. The existing research is based largely on retrospective review of large databases and is therefore affected by confounding and bias. A few prospective studies have shown increased mortality in women after isolated CABG, while others have shown no difference. The impact of gender on clinical outcomes after CABG remains controversial and needs further review.
Higher postoperative mortality in women after isolated CABG has been attributed to various gender-specific factors. Women who undergo CABG tend to have more co-morbid illnesses compared with men, including hypertension, diabetes mellitus, hyperlipidemia, peripheral vascular disease, and congestive heart failure. Women are more likely to present with cardiogenic shock and ST-segment elevation myocardial infarction and to undergo urgent or emergent CABG surgery. A comparatively smaller body surface area is believed to account for smaller epicardial coronary arteries, leading to technical difficulties after CABG and making women prone to higher risk for poor graft patency. More recently, longer term follow-up studies in women after isolated CABG have also reported a conflicting impact of female gender on surgical mortality after isolated CABG. Therefore, we conducted an aggregate data meta-analysis of all the existing retrospective and prospective studies to evaluate the impact of female gender on mortality in patients who undergo isolated CABG at short-term, midterm, and long-term follow-up.
Methods
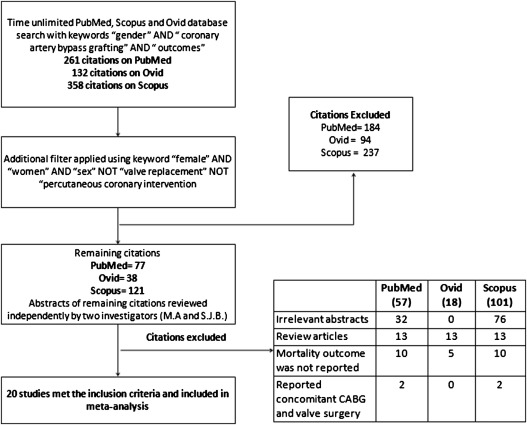
We conducted an extensive search of published studies using multiple online databases (PubMed, Scopus, and Ovid) for studies evaluating the association between female gender and short-term, midterm, and long-term outcomes after isolated CABG. The search was limited through May 31, 2012 and was performed using the Medical Subject Headings search string “gender AND female AND women AND coronary artery bypass grafting AND outcomes.” We included peer-reviewed and published studies for our analysis. We excluded meeting abstracts, studies in languages other than English when translations were not available, studies that did not provide comparative outcomes, and studies reporting outcomes of CABG with any other concomitant surgery (e.g., valve repair or replacement, aortic root repair or replacement). Figure 1 shows the flowchart of the search method of studies included in the meta-analysis. Once inclusion criteria were met, each of the studies was thoroughly reviewed, and baseline and outcomes data were extracted independently by 2 reviewers (MA and SJB). The quality of included studies was assessed independently by 2 reviewers (MA and SJB) using the Newcastle-Ottawa Quality Assessment Scale (NOQAS), and disparities were resolved by concensus. Twenty studies that included ≥1 of the following outcomes were included in the meta-analysis: postoperative mortality, 30-day mortality, and mortality at 1, 5, or 10 years. Short-term mortality was defined as a composite of postoperative and 30-day mortality. Outcome definitions among the individual studies were found to be comparable.
Percentages, means, and SDs were calculated to describe the distributions of categorical and continuous variables, respectively. Continuous variables were compared using 2-tailed independent-samples Student’s t tests. Categorical variables were compared using chi-square tests with Yates’ correction. Measures of heterogeneity, including Cochran’s Q statistic the and I 2 index, were computed. An I 2 value ≥25% was considered to indicate significant heterogeneity. Publication bias was assessed using funnel-plot analysis for short-term mortality. We used a random-effects model to summarize the effect size for clinical outcomes using odds ratios (ORs) and their 95% confidence intervals (CIs). The baseline data were analyzed using SPSS version 19.0 (SPSS, Inc., Chicago, Illinois). A p value ≤0.05 was considered significant. The meta-analysis was performed using Review Manager version 5.1 (Cochrane Collaboration, Copenhagen, Denmark). Various subgroup analyses were performed. The first subgroup analysis included 7 prospective studies only. The second subgroup analysis included 4 propensity score–matched studies only. We also performed additional analyses on the basis of study quality assessment. All included studies were stratified on the basis of NOQAS score (≥7 = high quality, 6 = intermediate quality, ≤5 = lower quality). These stratified analyses are provided in the online supplement. Supplemental Table 1 lists the details of NOQAS scores for included studies. A time-sensitive analysis to ascertain the impact of contemporary practice on clinical outcomes was performed. For this analysis, all studies were divided into 2 groups: studies published before 2001 and contemporary studies (published in 2001 and later).
Results
A cumulative 966,492 patients were included in the meta-analysis (688,709 men [71%] and 277,783 women [29%]). A list of the included studies is provided in Table 1 . As listed in Table 2 , women were more likely to be older at presentation and to have multiple co-morbidities, including diabetes mellitus, hypertension, hyperlipidemia, peripheral vascular disease, unstable angina, congestive heart failure, and New York Heart Association class III or IV symptoms. In contrast, men had a higher prevalence of smoking and history of cerebrovascular accident and myocardial infarction. Angiographic data showed that men had a higher burden of coronary artery disease than women, with triple-vessel disease being more prevalent in men (68% vs 58%, p <0.01). However, women were more likely to undergo urgent surgery (51% vs 44%, p <0.01) ( Table 2 ).
| Study | Region | Design | Men | Women | Analysis Type | Mortality Outcomes Reported |
|---|---|---|---|---|---|---|
| Alam et al (2012) | United States | Retrospective | 9,848 | 3,267 | Multivariate and propensity score matching | Postoperative mortality |
| Saxena et al (2012) | Australia | Retrospective | 16,754 | 4,780 | Multivariate | Mortality (postoperative, 30 days, 1 and 5 yrs) |
| Emmert et al (2010) | Switzerland | Retrospective | 807 | 176 | Multivariate | 30-day mortality |
| Fukui and Takanashi (2010) | Japan | Retrospective | 766 | 188 | Multivariate | 30-day mortality |
| Bukkapatnam et al (2010) | United States | Retrospective | 29,669 | 10,708 | Multivariate | 30-day mortality |
| Ennker et al (2009) | Germany | Retrospective | 9,527 | 3,079 | Propensity score matching | 30-day mortality |
| Kasirajan et al (2009) | United States | Retrospective | 667 | 309 | Propensity score matching | Postoperative mortality |
| Humphries et al (2007) | Canada | Retrospective | 20,229 | 4,983 | Multivariate | 30-day mortality |
| Guru et al (2006) | Canada | Retrospective | 52,800 | 15,043 | Multivariate and propensity score matching | Mortality (1, 5, and 10 yrs) |
| Hassan et al (2005) | Canada | Retrospective | 2,511 | 893 | Multivariate | Postoperative mortality |
| Woods et al (2003) | United States | Prospective | 3,582 | 1,742 | Multivariate | Postoperative mortality |
| Koch et al (2003) | United States | Prospective | 12,001 | 3,596 | Propensity score matching | Postoperative mortality |
| Hogue et al (2001) | United States | Retrospective | 283,116 | 133,231 | Multivariate | 30-day mortality |
| Abramov et al (2000) | Canada | Prospective | 3,891 | 932 | Multivariate | 30-day mortality |
| Aldea et al (1999) | United States | Prospective | 1,220 | 523 | Multivariate | Postoperative mortality |
| Edwards et al (1998) | United States | Retrospective | 247,760 | 97,153 | Multivariate | Postoperative mortality |
| Hammar et al (1997) | Sweden | Prospective | 3,326 | 607 | Multivariate | Mortality (30 days, 1 yr, 5 yrs) |
| Christakis et al (1995) | Canada | Prospective | 5,694 | 1,331 | Multivariate | 30-day mortality |
| O’Connor et al (1993) | United States | Prospective | 2,236 | 819 | Multivariate | Postoperative mortality |
| Fisher et al (1982) | United States | Retrospective | 6,258 | 1,153 | Multivariate | Postoperative mortality |
| Variable | Men | Women | p Value |
|---|---|---|---|
| Number of patients | 659,195 | 269,161 | — |
| Mean age (yrs) | 63.04 ± 3.49 | 66.74 ± 3.99 | 0.04 |
| Body mass index (kg/m 2 ) | 28.17 ± 1.81 | 28.3 ± 2.44 | 0.88 |
| Hypertension ∗ | 382,830/639,367 (60%) | 182,766/263,902 (69%) | <0.01 |
| Diabetes mellitus | 175,295/688,709 (25%) | 95,701/277,783 (34%) | <0.01 |
| Unstable angina patients | 376,666/572,432 (66%) | 162,290/241,922 (67%) | <0.01 |
| Hyperlipidemia ∗ | 266,885/564,729 (47%) | 121,797/240,448 (51%) | <0.01 |
| New York Heart Association class III/IV | 307,411/580,012 (53%) | 138,332/245,999 (56%) | <0.01 |
| Previous myocardial infarction | 22,320/48,341 (46%) | 6,538/15,255 (43%) | <0.01 |
| Preoperative renal insufficiency | 26,599/591,632 (4%) | 10,759/248,218 (4%) | <0.01 |
| Smoker | 207,301/566,214 (37%) | 67,743/241,924 (28%) | <0.01 |
| Family history of CAD | 121,490/264,109 (46%) | 48,109/101,927 (47%) | <0.01 |
| Peripheral vascular disease | 78,527/645,063 (12%) | 36,267/262,592 (14%) | <0.01 |
| Previous transient ischemic attack | 295/9,848 (3%) | 181/3,267 (6%) | <0.01 |
| Previous cerebrovascular accident | 47,513/645,095 (7%) | 25,609/262,198 (10%) | <0.01 |
| Congestive heart failure | 88,539/675,580 (13%) | 56,177/273,237 (21%) | <0.01 |
| Preoperative intra-aortic balloon pump | 35,886/548,878 (7%) | 15,708/236,101 (7%) | 0.06 |
| Urgent surgery | 141,990/319,371 (44%) | 63,101/123,557 (51%) | <0.001 |
| Preoperative aspirin use | 319,371/542,751 (59%) | 123,557/234,350 (53%) | <0.01 |
| 1-vessel CAD | 34,395/586,174 (6%) | 19,759/245,533 (8%) | <0.01 |
| 2-vessel CAD | 115,712/580,480 (20%) | 54,433/244,202 (22%) | <0.01 |
| 3-vessel CAD | 426,515/630,378 (68%) | 151,359/259,893 (58%) | <0.01 |
∗ Hypertension and hyperlipidemia cutoffs were not well defined in most included studies.
Figure 2 shows a funnel plot of short-term all-cause mortality. This funnel plot shows the standard error of log(OR) on the y axis and the OR for short-term mortality on the x axis. A review of this plot shows a strong treatment effect, as most of the studies with narrow standard errors for log(OR) lie around the mean treatment effect, which itself lies to the right of the no-effect line (i.e., 1.0). However, as all except 1 study lie to the right of the no-effect line, it is possible that negative studies may not have been published, and therefore publication bias cannot be excluded.
The impact of female gender on all-cause mortality after isolated CABG is listed in Table 3 . Female gender was associated with a 77% increase in the relative risk for short-term mortality (4.28% vs 2.53%, OR 1.77, 95% CI 1.67 to 1.88) after CABG. This was reflected in the postoperative period (4.36% vs 2.47%, OR 1.85, 95% CI 1.66 to 2.05) and at 30 days (4.17% vs 2.53%, OR 1.66, 95% CI 1.59 to 1.74). Mortality rates in women remained higher compared with men at 1-year and 5-year follow-up (2.55% vs 1.95%, OR 1.31, 95% CI 1.18 to 1.45, and 9.26% vs 8.16%, OR 1.14, 95% CI 1.08 to 1.20, respectively). Figure 3 displays forest plots showing higher mortality in women after isolated CABG at short-term (postoperative or 30-day), midterm (1-year), and long-term (5-year) follow-up. Long-term follow-up at 10 years was reported in only 1 study; therefore, meta-analysis could not be performed. However, in this study, women had higher mortality compared with men as well (14.78% vs 12.76%, OR 1.19, 95% CI 1.13 to 1.25). Figure 4 shows ORs for all-cause mortality at various follow-up intervals from the immediate postoperative period up to 10-year follow-up. At longer term follow-up, the OR for all-cause mortality in women decreased but remained significantly higher than in men.
| Mortality | n ∗ | N † | Event Rate in Women | Event Rate in Men | OR (Random) (95% CI) | Q ‡ | P(Q) § | I 2 ⋮ | τ 2 ¶ | ||||
|---|---|---|---|---|---|---|---|---|---|---|---|---|---|
| n | Total | % | n | Total | % | ||||||||
| Postoperative | 9 | 416,096 | 4,963 | 113,926 | 4.4 | 7,457 | 302,170 | 2.5 | 1.85 (1.66–2.05) | 13.51 | 0.10 | 41.0 | 0.01 |
| 30 days | 10 | 533,794 | 6,676 | 160,015 | 4.2 | 9,443 | 373,779 | 2.5 | 1.66 (1.59–1.74) | 9.55 | 0.39 | 06.0 | 0 |
| Postoperative/30 days | 18 | 928,356 | 11,534 | 269,161 | 4.3 | 16,665 | 659,195 | 2.5 | 1.77 (1.67–1.88) | 33.34 | 0.01 | 49.0 | 0 |
| 1 yr | 3 | 92,660 | 504 | 19,780 | 2.6 | 1,420 | 72,880 | 1.9 | 1.31 (1.18–1.45) | 0.69 | 0.71 | 0 | 0 |
| 5 yrs | 3 | 92,660 | 1,832 | 19,780 | 9.3 | 5,945 | 72,880 | 8.2 | 1.14 (1.08–1.20) | 1.34 | 0.51 | 0 | 0 |
| 10 yrs | 1 | 67,193 | 2,128 | 14,393 | 14.8 | 6,737 | 52,800 | 12.8 | 1.19 (1.13–1.25) # | NA | NA | NA | NA |
∗ Number of studies reporting the outcome.
† Number of patients included in the analysis.
‡ Cochran’s Q score for heterogeneity.
§ P wave for Cochran’s Q score for heterogeneity.
⋮ I 2 index for degree of heterogeneity.
¶ Tau-squared measure of heterogeneity.
In the first subgroup analysis of all prospective data (7 studies; Table 4 ) reported for 41,500 patients, women exhibited high short-term mortality (postoperative and/or 30-day) compared with men (3.12% vs 1.71%, OR 1.83, 95% CI 1.59 to 2.12). A second subgroup analysis including 4 studies ( Table 5 ) that performed propensity score matching (3 studies reporting postoperative mortality and 1 reporting 30-day mortality) was performed. This included 11,522 patients well matched for baseline demographics and equally divided between men and women ( Table 6 ). The analysis revealed an increased risk for short-term mortality after CABG in women compared with men (6.14% vs 4.48%, OR 1.36, 95% CI 1.04 to 1.78). Details of this propensity score–matched analysis are listed in Table 7 .
| Mortality | n ∗ | N † | Event Rate in Women | Event Rate in Men | OR (Random) (95% CI) | Q ‡ | P(Q) § | I 2 ⋮ | τ 2 ¶ | ||||
|---|---|---|---|---|---|---|---|---|---|---|---|---|---|
| n | Total | % | n | Total | % | ||||||||
| Postoperative | 4 | 25,719 | 208 | 6,680 | 3.1 | 319 | 19,039 | 1.7 | 1.86 (1.53–2.25) | 3.31 | 0.35 | 9.0 | 0 |
| 30 days | 3 | 15,781 | 90 | 2,870 | 3.1 | 228 | 12,911 | 1.8 | 1.80 (1.41–2.31) | 0.95 | 0.62 | 0 | 0 |
| Postoperative/30 days | 7 | 41,500 | 298 | 9,550 | 3.1 | 547 | 31,950 | 1.7 | 1.83 (1.59–2.12) | 4.28 | 0.64 | 0 | 0 |
∗ Number of studies reporting the outcome.
† Number of patients included in the analysis.
‡ Cochran’s Q score for heterogeneity.
§ P wave for Cochran’s Q score for heterogeneity.
⋮ I 2 index for degree of heterogeneity.
Stay updated, free articles. Join our Telegram channel

Full access? Get Clinical Tree


