Assays monitoring P2Y12 platelet reactivity can accurately predict which patients will have a poor response to clopidogrel. We sought to determine the cost-effectiveness of using platelet reactivity assays (PRAs) to select a dual-antiplatelet regimen for patients with acute coronary syndrome. A hybrid decision tree Markov model was developed to determine the cost-effectiveness of universal clopidogrel, ticagrelor, or prasugrel (given to all patients) or PRA-driven ticagrelor or prasugrel (given to patients with high platelet reactivity, defined as >230 on the VerifyNow P2Y12 assay; the others received generic clopidogrel). We assumed a cohort of 65-year-old patients with acute coronary syndrome and an incidence of high platelet reactivity of 32% and 13% at ∼24 to 48 hours after revascularization and 1 month, respectively. The 5-year costs, quality-adjusted life-years, and incremental cost-effectiveness ratios were calculated for PRA-driven ticagrelor and prasugrel compared with universal clopidogrel, ticagrelor, or prasugrel. PRA-driven ticagrelor and prasugrel were cost-effective compared with universal clopidogrel (incremental cost-effectiveness ratio $40,100 and $49,143/quality-adjusted life-year, respectively); however, universal ticagrelor and prasugrel were not (incremental cost-effectiveness ratio $61,651 and $96,261/quality-adjusted life-year, respectively). Monte Carlo simulation suggested PRA-driven ticagrelor, PRA-driven prasugrel, universal ticagrelor, and universal prasugrel would have an incremental cost-effectiveness ratio <$50,000/quality-adjusted life-year in 52%, 40%, 23%, and 2% of the iterations compared with universal clopidogrel, respectively. Universal ticagrelor and prasugrel were not cost-effective compared with their respective PRA-driven regimens (incremental cost-effectiveness ratio $68,182; $116,875/quality-adjusted life-year, respectively). Monte Carlo simulation suggested universal ticagrelor and prasugrel would have an incremental cost-effectiveness ratio <$50,000/quality-adjusted life-year in 26% and 4% of iterations compared with their respective PRA-driven regimens. The results were most sensitive to differences in agent costs and drug-specific relative risks of death. In conclusion, even with generic clopidogrel, PRA-driven selection of antiplatelet therapy appeared to be a cost-effective strategy with the potential to decrease the overall acute coronary syndrome-associated healthcare costs.
Point-of-care platelet reactivity assays (PRAs), such as the VerifyNow P2Y12 and the VerifyNow PRU assays (Accumetrics, San Diego, California), have been developed to monitor on-treatment platelet reactivity, and these tests are capable of accurately predicting patients with poorer responses to clopidogrel. Thus, these assays provide prescribers with a tool to better determine which patients will be the best candidates for clopidogrel-based dual-antiplatelet therapy (DAPT), and which patients should receive the more expensive, nongeneric P2Y12 platelet inhibitors. Decision makers adopting PRA testing will have to choose among numerous treatment strategies. In the present analysis, we sought to estimate the quality-adjusted life-years, costs, and incremental cost-effectiveness of PRA-driven and universal DAPTs in patients with acute coronary syndrome (ACS).
Methods
We constructed a hybrid 1-year decision tree Markov model to evaluate the cost-effectiveness of 12 months of universal or PRA-driven use of DAPT in patients with ACS (e.g., unstable angina, non–ST-segment elevation myocardial infarction, ST-segment elevation myocardial infarction) managed medically, with percutaneous coronary intervention or coronary artery bypass grafting ( Figure 1 ). We assumed all patients received appropriate clopidogrel loading before revascularization and periprocedural doses (clopidogrel exposure needed to perform PRA testing). Thus, this model was only concerned with the selection of maintenance DAPT. The 5 maintenance dosing strategies evaluated in our model included (1) universal and generically priced clopidogrel, (2) universal ticagrelor, (3) universal prasugrel, (4) PRA-driven ticagrelor, and (5) PRA-driven prasugrel. Double-dose clopidogrel (150 mg/day) was not considered, because clinical trials have not supported the efficacy of this regimen. For universal strategies, we assumed patients were prescribed the drug without PRA testing. For the ticagrelor and prasugrel PRA-driven treatment arms, the patients were tested using the VerifyNow P2Y12 assay 24 to 48 hours after revascularization and were prescribed clopidogrel in the absence of high platelet reactivity (HPR; defined as a value <230). Patients who had HPR received either ticagrelor or prasugrel, depending on the treatment arm. The maintenance dosages for the treatment strategies were assumed to be as follows: clopidogrel 75 mg/day, ticagrelor 90 mg twice daily, and prasugrel 10 mg/day, each administered with aspirin (with a dose of 75 to 325 mg/day, as appropriate).
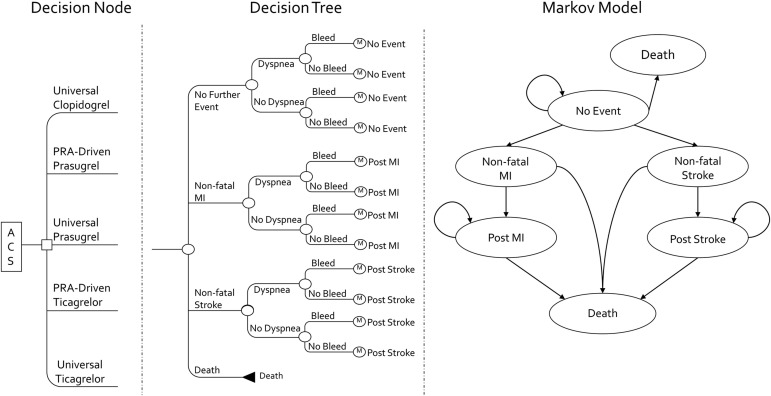
Our base-case model simulated the progression of a hypothetical cohort of 65-year-old men and women (to mimic the age of patients in the Clopidogrel in Unstable angina to prevent Recurrent Events [CURE] study, TRial to assess Improvement in Therapeutic Outcomes by optimizing platelet inhibitioN with prasugrel Thrombolysis In Myocardial Infarction 38 [TRITON-TIMI 38], and PLATelet inhibition and patient Outcomes [PLATO] trial) experiencing ACS as they moved through a series of health states during a 5-year period at 1-year intervals or cycle lengths. The model started with the decision to initiate 1 of the 5 previously mentioned DAPTs. The subsequent probability of experiencing a nonfatal myocardial infarction (MI), nonfatal stroke, or dying during the 1-year (decision tree) period after the index ACS event was conditional on the initial DAPT chosen. Patients could not experience both a nonfatal MI and a nonfatal stroke in the first year. Regardless of whether patients experienced no event or a nonfatal MI or stroke in the decision tree, all patients had a risk of developing a major bleeding event and/or dyspnea.
At the end of the decision tree portion of the model, the patients were allocated to 1 of 3 (of the 6) health states in the long-term Markov model. Patients not experiencing recurrent MI, stroke, or death were placed in the “no event” health state. Those patients experiencing recurrent MI or a stroke during the decision tree were entered in the Markov model in the “post-MI” and “poststroke” health state, respectively. The “nonfatal MI” and “nonfatal stroke” states were reserved for patients who had experienced an event ≥1 year after the index ACS event. These served as “tunnel states,” because patients were only allowed to spend 1 year in either state before moving to the corresponding postevent health state or death. Just as in the decision tree, the patients could not experience both a nonfatal MI and a nonfatal stroke during the Markov portion of the model.
Model inputs were derived from published ACS DAPT studies and decision-analytic models identified through searches of MEDLINE and the Tufts Cost-Effectiveness Analysis Registry ( Table 1 ). For the decision tree portion of the model, the rates of nonfatal MI and bleeding during aspirin therapy were derived from published Medicare beneficiary data for patients with ACS. The rates of nonfatal stroke, all-cause mortality during aspirin therapy, and dyspnea with clopidogrel and ticagrelor therapy (prasugrel rate assumed to be similar to that of clopidogrel) were derived from ACS clinical trials. The relative rates of these events occurring during the decision tree portion of the model in patients receiving clopidogrel, ticagrelor, or prasugrel universally (i.e., without selection by PRA testing) were derived by multiplying these aspirin-only rates by the corresponding hazard ratios reported in CURE (clopidogrel plus aspirin vs aspirin alone), PLATO (ticagrelor plus aspirin vs clopidogrel plus aspirin), and TRITON-TIMI 38 (prasugrel plus aspirin vs clopidogrel plus aspirin), as appropriate. However, because the PLATO and TRITON-TIMI 38 trials did not individualize therapy using PRA test results or exclude those with HPR, we assumed these studies likely underestimated the performance of clopidogrel. Thus, the hazard rates of nonfatal MI, major bleeding, and death were adjusted accordingly, assuming patients taking clopidogrel with HPR experienced efficacy and safety effects similar to those receiving placebo in the CURE study. Because the ACS disease state itself can cause temporary HPR, we assumed the incidence of HPR during maintenance therapy would be 13% according to 1-month postpercutaneous coronary intervention assay data. This value was used to adjust the hazard rates as denoted previously. However, because PRA testing would typically occur during the index ACS visit and prescribers would make treatment decisions according to these PRA results, we assumed a 32% incidence of HPR at discharge. Thus, 32% of tested patients would be considered candidates for ticagrelor or prasugrel in the PRA-driven strategies.
| Variable | Base-Case | Range | Investigator |
|---|---|---|---|
| Decision-tree costs in 2011 USD | |||
| Clopidogrel, yearly | 639 | 48–1,160 | Per survey |
| Prasugrel, yearly | 2,496 | 1,583–3,408 | Per survey |
| Ticagrelor, yearly | 3,348 | 1,982–4,014 | Per survey |
| VerifyNow P2Y12 assay | 30 | 14–60 | Vandvik et al ; Centers for Medicare |
| ACS event costs | |||
| MI | 28,011 | 20,922–33,359 | Greenhalgh et al |
| Stroke | 29,930 | 22,255–35,773 | Greenhalgh et al |
| No event | 14,779 | 10,919–17,383 | Greenhalgh et al |
| Bleeding | 7,970 | 3,045–20,861 | Crespin et al |
| Death | 23,822 | 17,642–28,228 | Greenhalgh et al |
| Decision tree utilities | |||
| Nonfatal MI | 0.77 | 0.75–0.80 | Greenhalgh et al |
| Nonfatal stroke | 0.70 | 0.63–0.76 | Greenhalgh et al |
| No event | 0.84 | 0.84–0.85 | Greenhalgh et al |
| Bleeding | −0.02 | −0.04–0 | Crespin et al ; Pignone et al ; Augustovski et al ; Meenan et al |
| Dyspnea | −0.01 | −0.02–0 | Crespin et al ; Pignone et al ; Augustovski et al ; Meenan et al |
| Death | 0.22 | 0.18–0.26 | Greenhalgh et al |
| Decision tree probabilities (event rates) | |||
| Nonfatal MI on aspirin | 0.1223 | 0.1191–0.1255 | Crespin et al ; Pignone et al ; Augustovski et al ; Meenan et al |
| Nonfatal stroke on aspirin | 0.013 | 0.0045–0.0403 | Yusuf et al ; Greenhalgh et al |
| Nonfatal stroke on clopidogrel and aspirin | 0.0112 | 0.0039–0.0347 | Greenhalgh et al |
| Any bleeding on aspirin | 0.1745 | 0.1712–0.1781 | Crespin et al |
| Death from any cause on aspirin | 0.0619 | 0.0562–0.0681 | Yusuf et al |
| Relative risk or hazard ratio for clopidogrel vs placebo | |||
| Nonfatal MI | 0.77 | 0.67–0.89 | Yusuf et al |
| Nonfatal stroke | 0.86 | 0.63–1.18 | Yusuf et al |
| Bleeding | 1.69 | 1.47–1.94 | Yusuf et al |
| Death | 0.91 | 0.78–1.06 | Yusuf et al |
| Hazard ratio for ticagrelor vs clopidogrel | |||
| Nonfatal MI | 0.84 | 0.75–0.95 | Wallentin et al |
| Nonfatal stroke | 1.17 | 0.91–1.52 | Wallentin et al |
| Bleeding (major or minor, TIMI criteria) | 1.05 | 0.96–1.15 | Wallentin et al |
| Dyspnea | 1.84 | 1.68–2.02 | Wallentin et al |
| Death | 0.78 | 0.69–0.89 | Wallentin et al |
| Hazard ratio for prasugrel vs clopidogrel | |||
| Nonfatal MI | 0.76 | 0.67–0.85 | Wiviott et al |
| Nonfatal stroke | 1.02 | 0.71–1.45 | Wiviott et al |
| Bleeding | 1.31 | 1.11–1.56 | Wiviott et al |
| Death | 0.95 | 0.78–1.16 | Wiviott et al |
| PRA >230 at ∼24–48 h | 0.328 | NA | Marcucci et al |
| PRA >230 at 1 month | 0.13 | NA | Campo et al |
| Discount rate (%) | 3 | 0–5 | Gold |
| Markov model costs in 2011 USD | |||
| Nonfatal MI | 19,689 | 4,922–39,379 | Choudhry et al |
| Nonfatal stroke | 20,837 | 16,497–29,930 | Greenhalgh et al ; Choudhry et al ; O’Sullivan et al |
| No event | 2,652 | 663–5,304 | Choudhry et al |
| After MI | 2,889 | 722–5,777 | Choudhry et al |
| After stroke | 4,555 | 1,139–6,772 | Greenhalgh et al ; O’Sullivan et al |
| Markov model utilities | |||
| Nonfatal MI | 0.78 | 0.76–0.80 | Greenhalgh et al |
| Nonfatal stroke | 0.7 | 0.52–0.87 | Greenhalgh et al ; Tengs et al |
| No event | 0.84 | 0.84–0.85 | Greenhalgh et al |
| After MI | 0.82 | 0.80–0.84 | Greenhalgh et al |
| After stroke | 0.70 | 0.63–0.78 | Greenhalgh et al |
| Death | 0 | NA | Assumption |
| Markov model probabilities (event rates) | |||
| Annual rate of MI | 0.0428 | 0.0403–0.0454 | Crespin et al |
| Annual rate of stroke | 0.0102 | 0.0072–0.0145 | Greenhalgh et al |
| Risk of death in no event state | 2.21 | 0.18–4.24 | Greenhalgh et al |
| Risk of death in nonfatal MI state | 5.84 | 3.72–7.97 | Greenhalgh et al |
| Risk of death in post-MI state | 2.21 | 0.18–4.24 | Greenhalgh et al |
| Risk of death in nonfatal stroke state | 7.43 | 6.50–8.50 | Greenhalgh et al |
| Risk of death in poststroke state | 2.07 | 1.30–3.32 | Greenhalgh et al |
For the Markov portion of the model, we assumed patients would discontinue clopidogrel, ticagrelor, and prasugrel, and no additional treatment effect from these drugs would occur. Thus, all event rates in the Markov model were assumed to be the same for patients who had received any of the strategies, with the only difference being the proportion of patients starting in each Markov health state. The rates of nonfatal MI and nonfatal stroke in year 2 onward were derived from published epidemiologic studies. Age-adjusted mortality rates for nonevent death were derived from life tables published by the United States Census Bureau, and these rates were multiplicatively adjusted for the patients’ specific Markov model health state.
We conducted analyses from the United States payor or Medicare perspective. All costs are expressed in 2011 United States dollars. When needed, the costs were converted to United States dollars from foreign currency using exchange rates and inflated using the Consumer Price Index for Medical Care. The drug costs were obtained by contacting 5 nationally representative pharmacies, with median cash prices used in the base-case analysis, the highest cash price set as the high end of the plausible sensitivity range, and the lower range set as the wholesale acquisition cost minus 25%. We valued the total cost of the VerifyNow P2Y12 assay (PRA test) using the Medicare reimbursement rates. The costs of recurrent nonfatal MI, nonfatal stroke, and death for the decision tree portion of our model were taken from the clopidogrel arm of the PLATO health economics and quality-of-life substudy and were assumed to be the same for all strategies. The costs related to a bleeding event were not reported in the PLATO substudy; thus, this cost was assumed to be the national average Diagnosis-Related Group payment for a gastrointestinal bleeding event. The cost of thrombotic events occurring in year 2 onward and the costs assigned to the no event and post-nonfatal MI and nonfatal stroke heath states were derived from published economic studies.
Utility values were derived from the PLATO health economics and quality-of-life substudy and the published data. In the decision tree, the death state was assigned a utility value of 0.22, because death was not assumed to occur at the beginning of the model but after an average of 2 to 3 months. In the Markov model, however, death was assigned a utility of 0. Major bleeding and dyspnea were only accounted for in the decision tree.
The model was run separately for each of the 5 DAPTs and was used to calculate the total treatment costs, quality-adjusted life-years, and incremental cost-effectiveness ratios (defined as the costs per quality-adjusted life-year gained). The costs and outcomes were discounted at 3% annually. We conducted a 1-way sensitivity analysis for each variable in the model over its plausible range. This included rerunning the model with a time horizon of 2, 3, 4, 10, and 40 years. We also conducted a Monte Carlo simulation by randomly sampling a distribution of all variables and simulating the outcomes 10,000 times. For all variables, we assumed a triangle distribution (defined by the likeliest, low, and high values), because the true nature of variance for these variables is not well understood, and the triangle distribution (when used appropriately) does not violate the requirements of any variable (i.e., costs cannot be <$0, and probabilities and utilities must lie between 0 and 1). The results from these analyses are presented as cost-effectiveness acceptability curves. The model was programmed in TreeAge Pro 2008 (TreeAge Software, Williamstown, Massachusetts).
Results
The total costs and quality-adjusted life-years for each strategy during the 5-year period are listed in Table 2 . The PRA-driven ticagrelor and prasugrel strategies were cost-effective compared with universal clopidogrel; however, the universal ticagrelor and prasugrel strategies were not. Moreover, universal ticagrelor or prasugrel were not cost-effective strategies compared with the PRA-driven use of these same agents.


