In an era of rapidly expanding and evolving 3-dimensional echocardiographic (3DE) technology, 1 of the issues facing the 3DE quantification of chamber volumes and function is that different software vendors use different methodologies and algorithms. The aim of this study was to evaluate the comparability and reproducibility of 3DE direct volumetric and speckle-tracking methods for left ventricular (LV) and left atrial (LA) chamber quantification. A total of 120 subjects (mean age 53 ± 17 years, 65% men), including 88 unselected patients and 32 healthy volunteers, underwent 3DE acquisitions and analysis using direct volumetric and speckle-tracking methods successively. Measurements of LV and LA volumes and LV function were compared between the 2 3DE methods. Additionally, intraobserver and interobserver reproducibility was assessed in 40 randomly selected patients. Measurements of LV end-diastolic volume, end-systolic volume, and ejection fraction by 3DE direct volumetric and 3DE speckle-tracking methods were comparable, with good correlations (r = 0.98, r = 0.98, and r = 0.87, respectively), small biases, and narrow limits of agreement (−1 ± 8 ml, −1 ± 8 ml, and 0 ± 6%, respectively). For measurements of LA end-systolic volume and end-diastolic volume, similar correlations (r = 0.96 for both), small biases, and narrow limits of agreement (−2 ± 6 and −1 ± 5 ml, respectively) were found between the 2 methods. Intraobserver and interobserver reproducibility for LV and LA quantification were comparable for the 2 methods. In conclusion, 3DE direct volumetric and speckle-tracking methods give comparable and reproducible quantification of LV and LA volumes and function, making interchangeable application a viable option in daily clinical practice.
Accurate and reliable quantitative evaluation of left ventricular (LV) and left atrial (LA) size and function are vital for the diagnosis, treatment, and prediction of prognosis of heart disease in daily clinical practice. In this regard, many studies have shown that 3-dimensional echocardiographic (3DE) imaging has better accuracy and higher reproducibility than 2-dimensional echocardiography in comparison with reference techniques such as cardiac magnetic resonance (CMR). These results were derived from 3DE methods based on direct volumetric quantification. Recently, 3DE speckle tracking was introduced to provide a comprehensive assessment of global and regional LV function through strain analysis in 4 dimensions. In addition, its accuracy for the quantitative evaluation of LV volumes was demonstrated in comparison to CMR. However, the comparability and reproducibility of measurements by different 3DE methods are fundamental requirements for their interchangeable application in clinical trials and practice. Although different direct volumetric quantification algorithms have been previously demonstrated to give comparable results, no such comparison has been performed for chamber quantification between 3DE direct volumetric and speckle-tracking methods. Therefore, the aim of our study was to determine the comparability and intraobserver and interobserver reproducibility of these 2 different 3DE analysis methods for LV and LA chamber quantification.
Methods
A total of 120 subjects (mean age 53 ± 17 years, 65% men) were enrolled in this study, including 88 unselected patients in sinus rhythm with various diagnoses of heart disease and 32 healthy volunteers. Three-dimensional echocardiographic acquisitions of the left ventricle and left atrium were performed in all 120 subjects and in 105 of 120 subjects (mean age 54 ± 19 years, 66% men), respectively. After acquisition, 22 subjects (18%) were excluded from the LV analysis because of poor LV image quality (defined as >4 nonvisualized LV segments by either 1 or both methods), and 9 subjects (9%) were excluded from the LA analysis because of suboptimal LA image quality by either 1 or both methods. All subjects gave informed consent, and the local ethics committee approved the protocol.
All patients underwent 3DE acquisitions by the same operator using 2 echocardiographic machines successively during the same examination, without alteration of hemodynamics or therapy. The iE33 echocardiography machine with the X3-1 matrix-array transducer (Philips Medical Systems, Best, The Netherlands) was used for the 3DE direct volumetric method, after which the Artida 4D scanner with the PST-25SX matrix-array transducer (Toshiba Medical Systems, Tokyo, Japan) was used for the 3DE speckle-tracking method. Within a single breath-hold and during a constant RR interval, 6 to 7 wedge-shaped subvolumes were acquired from an apical window to create full-volume data sets with the Artida and iE33 machines, respectively. While retaining the entire left ventricle within the pyramidal volume, depth and sector width were decreased as much as possible to improve the temporal and spatial resolution of the images. After acquisition of the left ventricle, depth was increased and sector width decreased to obtain a full-volume data set of the left atrium with optimal border delineation of the left atrium in the far field.
Chamber quantification using the 3DE direct volumetric method was performed offline using QLAB version 7.0 (Philips Medical Systems). For quantification of LV volumes and function, the longitudinal axes were aligned in the first frame of the loop that corresponded to LV end-diastolic time, in the apical 4-chamber and 2-chamber views, with the transverse axes perpendicular to them ( Figure 1 ). Then, tracing was performed by marking 5 points: septal, lateral, anterior, and inferior on the mitral annulus and the fifth point on the LV apex. A semiautomated cavity–endocardial wall interface detection algorithm then automatically identified the endocardial border and calculated LV end-diastolic volume (EDV) by voxel count. If necessary, manual adjustment of the endocardial border tracing could be performed at this time. End-systole was selected by visually identifying the frame with the smallest LV cavity cross-sectional area in both apical views just before mitral valve opening, with tracing repeated in the same manner as for end-diastole to obtain LV end-systolic volume (ESV), after which the LV ejection fraction was automatically calculated. For LA volume quantification, 5 points were marked: septal, lateral, anterior, and inferior on the mitral annulus and the fifth point on the LA apex ( Figure 2 ). Then, the same procedure was followed as described for the LV analysis to obtain LA EDV, defined as the minimum LA volume during the cardiac cycle, and LA ESV, defined as the maximum LA volume just before mitral valve opening. The LA appendage and the pulmonary veins were excluded from the LA cavity.
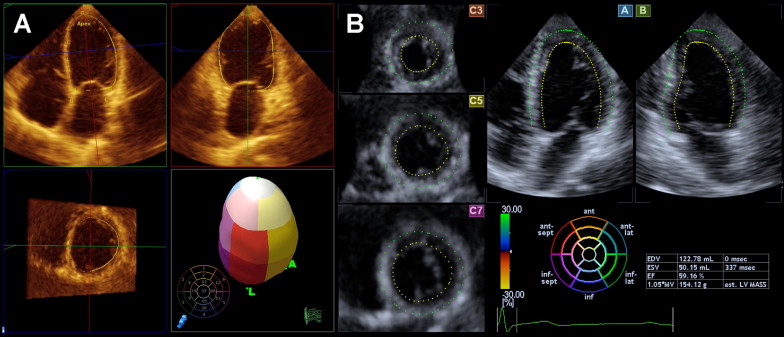
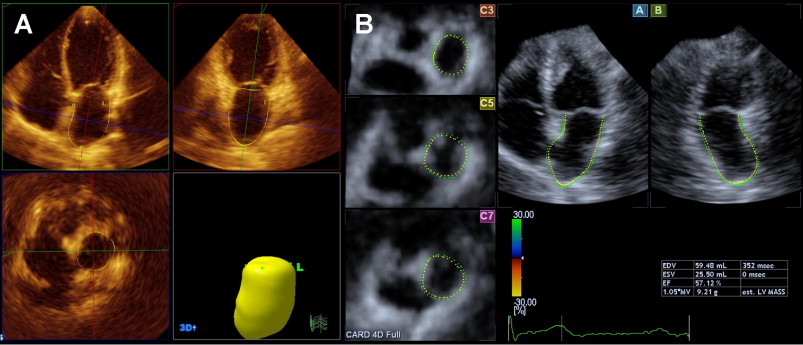
Chamber quantification by 3DE speckle tracking was performed on-line using 3D Wall Motion Tracking software version 2.5 (Toshiba Medical Systems). Three-dimensional echocardiographic data sets were displayed in apical 4-chamber and 2-chamber views and 3 short-axis views in the basal, midventricular, and apical regions, respectively ( Figure 1 ). In the apical 4- and 2-chamber views, the endocardial border is traced by setting multiple reference points by the user starting at the base of the left ventricle at the mitral valve level going toward the apex. The epicardial border can be entered manually or by setting a default thickness for the myocardium. After detection of the myocardial borders at the end-diastolic reference frame, the user can correct the shape of the left ventricle if necessary. The 3-dimensional wall motion tracking, which is based on a 3-dimensional block-matching algorithm, is then automatically performed through the entire cardiac cycle, providing LV EDV, LV ESV, and the LV ejection fraction. The same steps as in LV volume analysis were repeated for tracing of the LA endocardial border, starting from the base of the left atrium at the mitral valve level going toward the LA apex and excluding the LA appendage and the pulmonary veins from the LA cavity ( Figure 2 ).
Reproducibility of the 3DE direct volumetric and 3DE speckle-tracking methods was assessed for LV and LA chamber quantification in 40 randomly selected patients. Data sets were analyzed for interobserver reproducibility by 2 separate observers. Intraobserver analyses were performed on average 1 week apart in random order. During these repeated analyses, the investigators were blinded to the results of all previous measurements. The observers participating in the study were experienced with the specific analysis methodologies and analysis of 3-dimensional echocardiograms in general.
Data are presented as mean ± SD. Correlations between 3DE direct volumetric and speckle-tracking methods were assessed using Pearson’s correlation coefficient, while agreement between the 2 methods was expressed according to the method of Bland and Altman. The statistical significance of the biases between measurements by the 2 methods was tested using a paired Student’s t test with a 2-tailed distribution. The reproducibility of the 2 methods were assessed using the intraclass correlation coefficient 2-way random-effects model with absolute agreement definition. Z transformations were performed between each group to see if there was any significant difference between correlations. To allow evaluation of clinical relevance and comparison with previous studies, the standard error of measurement and coefficient of variation were also assessed. A p value <0.05 was considered significant. Data analyses were performed using SPSS version 15.0 (SPSS, Inc., Chicago, Illinois).
Results
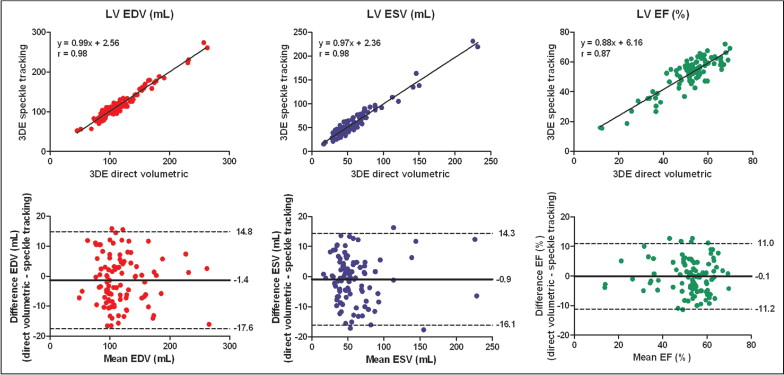
Mean LV volumes and ejection fraction measured by 3DE direct volumetric and speckle-tracking methods were not significantly different. Excellent correlations were found between the 2 methods for all variables, and Bland-Altman analysis demonstrated small biases and relatively narrow limits of agreement ( Figure 3 ).

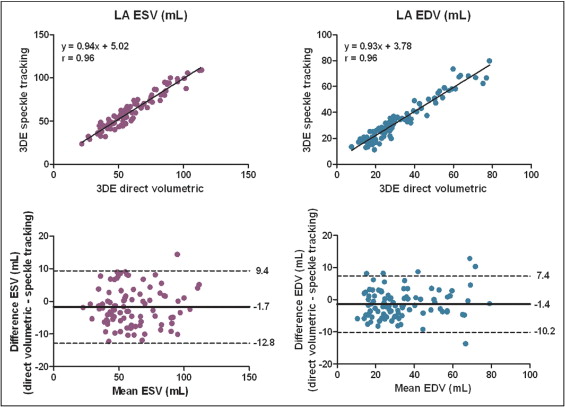
Measurements of LA volumes by the 2 methods also correlated well and demonstrated narrow limits of agreement. Similar to LV volume measurements, LA volumes were generally somewhat larger using 3DE speckle tracking compared to the direct volumetric method, with mean biases <2 ml ( Figure 4 ). Intraobserver and interobserver reproducibility of LV and LA volumes and functional measurements were comparable between the 2 methods ( Table 1 ).
| Variable | 3DE Direct Volumetric | 3DE Speckle Tracking | Difference | |||||
|---|---|---|---|---|---|---|---|---|
| ICC | SEM | CV | ICC | SEM | CV | Z | p Value | |
| Intraobserver | ||||||||
| LV EDV (ml) | 0.99 | 3.2 | 3.3 ± 2.5% | 0.99 | 3.8 | 4.1 ± 3.5% | 0.127 | 0.90 |
| LV ESV (ml) | 0.99 | 3.0 | 7.3 ± 7.9% | 0.99 | 2.9 | 6.1 ± 4.7% | 0.151 | 0.88 |
| LV ejection fraction (%) | 0.96 | 2.5 | 5.6 ± 5.3% | 0.98 | 1.7 | 3.6 ± 3.6% | 1.411 | 0.16 |
| LA EDV (ml) | 0.98 | 2.8 | 10.2 ± 9.2% | 0.98 | 4.0 | 13.7 ± 10.9% | 0.236 | 0.81 |
| LA ESV (ml) | 0.98 | 3.0 | 5.9 ± 6.1% | 0.98 | 4.3 | 7.7 ± 7.3% | 0.308 | 0.76 |
| Interobserver | ||||||||
| LV EDV (ml) | 0.99 | 3.9 | 4.7 ± 3.3% | 0.99 | 4.8 | 4.7 ± 3.4% | 0.914 | 0.36 |
| LV ESV (ml) | 0.99 | 3.9 | 10.2 ± 9.3% | 0.98 | 4.9 | 9.0 ± 6.5% | 1.461 | 0.14 |
| LV ejection fraction (%) | 0.91 | 3.4 | 7.1 ± 5.8% | 0.91 | 3.1 | 6.9 ± 5.9% | 0.002 | 1.00 |
| LA EDV (ml) | 0.98 | 3.0 | 9.8 ± 7.5% | 0.97 | 3.8 | 13.9 ± 14.7% | 0.883 | 0.38 |
| LA ESV (ml) | 0.98 | 3.1 | 6.9 ± 6.2% | 0.96 | 4.7 | 9.3 ± 9.3% | 1.513 | 0.13 |
Results
Mean LV volumes and ejection fraction measured by 3DE direct volumetric and speckle-tracking methods were not significantly different. Excellent correlations were found between the 2 methods for all variables, and Bland-Altman analysis demonstrated small biases and relatively narrow limits of agreement ( Figure 3 ).
Stay updated, free articles. Join our Telegram channel

Full access? Get Clinical Tree


