The aim of the present study was to determine whether peak oxygen consumption (VO 2 ) and the Heart Failure Survival Score (HFSS) predict prognosis in European-American, African-American, and Hispanic-American patients with chronic heart failure referred for heart transplantation. The peak VO 2 and the HFSS have previously been shown to effectively risk stratify patients with chronic heart failure and are criteria for the listing for heart transplantation. However, the effect of race on the predictive value of these variables has not been studied. A total of 715 patients with congestive heart failure (433 European American, 126 African American, 123 Hispanic American, and 33 other), who had been referred for heart transplantation, underwent cardiopulmonary exercise testing with measurement of the peak VO 2 and calculation of the HFSS. A total of 354 patients had died or undergone urgent heart transplantation or implantation of a left ventricular assist device during the 962 ± 912 days of follow-up. On univariate and multivariate Cox hazard analysis, both peak VO 2 and the HFSS were powerful prognostic markers in the overall cohort and in the separate races. In the receiver operating characteristic curve analysis, the areas under the curve at 1 and 2 years of follow-up were greater for the HFSS than for peak VO 2 . In conclusion, HFSS and peak VO 2 can be used for transplant selection; however, in the era of modern therapy and across races and genders, the HFSS might perform better than the peak VO 2 .
Measurement of the peak oxygen consumption (VO 2 ) effectively risk stratifies patients with chronic heart failure (CHF) and is a well-established selection criterion for heart transplantation (HTx). However, its value can be compromised by numerous factors (eg, gender and motivation). To improve risk stratification, multimarker score systems, such as the Heart Failure Survival Score (HFSS), have been developed and validated. The effect of race on the HFSS has never been evaluated. African-American and Hispanic-American patients have been under-represented in clinical CHF trials; however, they have constituted an increasing proportion of HTx recipients. We compared the prognostic power of these variables in European-American, African-American and Hispanic-American patients with CHF who had been referred for HTx.
Methods
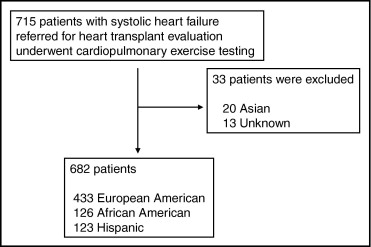
A total of 715 patients (433 European American, 126 African American, 123 Hispanic American, and 33 other; Figure 1 ) with systolic heart failure who had been referred for HTx underwent cardiopulmonary exercise testing from 1993 to 2008. The clinical characteristics are listed in Table 1 . The local human investigations committee approved our review of the data.
| Characteristic | All Patients (n = 715) | European-American Men (n = 309) | European-American Women (n = 124) | African-American Men (n = 64) | African-American Women (n = 62) | Hispanic-American Men (n = 75) | Hispanic-American Women (n = 48) |
|---|---|---|---|---|---|---|---|
| Age (years) | 53.6 ± 11.6 | 56.1 ± 11.1 | 52.3 ± 13.2 | 50.3 ± 11.9 ⁎ | 50.6 ± 12.1 | 54.3 ± 8.2 | 51.7 ± 11.1 |
| Body mass index (kg/m 2 ) | 27.5 ± 5.6 | 28.2 ± 5.0 | 25.6 ± 5.8 | 28.5 ± 6.4 | 28.7 ± 6.1 † | 28.6 ± 6.2 | 25.0 ± 4.3 |
| Ischemic heart disease/nonischemic | 284/431 | 172/137 | 39/85 | 20/44 ‡ | 7/55 ‡ | 26/49 | 10/38 |
| Heart rate at rest (beats/min) | 75.8 ± 14.7 | 75.0 ± 13.9 | 77.2 ± 16.2 | 78.1 ± 15.9 | 75.6 ± 15.9 | 75.9 ± 14.3 | 76.3 ± 12.5 |
| Mean blood pressure at rest (mm Hg) | 82.7 ± 12.7 | 82.5 ± 11.7 | 80.5 ± 13.0 | 84.8 ± 14.2 | 84.8 ± 12.7 | 84.9 ± 12.7 | 82.4 ± 13.8 |
| Peak oxygen consumption (ml/min/kg) | 13.6 ± 4.6 | 13.9 ± 4.2 | 13.7 ± 5.2 | 14.6 ± 5.1 | 11.7 ± 4.3 § | 13.6 ± 4.4 | 12.1 ± 3.5 |
| Sodium (mEq/L) | 137.2 ± 3.6 | 137.0 ± 3.6 | 137.6 ± 3.3 | 137.5 ± 4.0 | 137.3 ± 3.9 | 137.5 ± 3.3 | 136.9 ± 4.0 |
| Left ventricular ejection fraction (%) | 21.6 ± 7.0 | 21.2 ± 6.8 | 22.7 ± 6.9 | 20.5 ± 7.3 | 21.0 ± 7.9 | 22.3 ± 6.8 | 22.9 ± 7.0 |
| Intraventricular conduction defect | 401 (56.1%) | 205 (66.3%) | 65 (52.4%) | 28 (43.8%) ¶ | 28 (45.2%) | 41 (54.7%) | 22 (45.8%) |
| New York Heart Association | 2.82 ± 0.69 | 2.83 ± 0.71 | 2.85 ± 0.67 | 2.78 ± 0.65 | 2.98 ± 0.67 | 2.79 ± 0.62 | 2.75 ± 0.60 |
| Heart failure survival score | 8.04 ± 0.89 | 7.86 ± 0.86 | 8.08 ± 0.89 | 8.21 ± 0.91 ∥ | 8.24 ± 0.94 | 8.19 ± 0.91 ∥ | 8.18 ± 0.76 |
| Angiotensin-converting enzyme inhibitor/angiotensin-receptor blocker | 577 (80.7%) | 256 (82.8%) | 97 (78.2%) | 55 (85.9%) | 50 (80.6%) | 57 (76.0%) | 38 (79.2%) |
| β Blocker | 504 (70.5%) | 228 (73.8%) | 72 (58.1%) | 48 (75.0%) | 46 (74.2%) | 59 (78.7%) | 28 (37.3%) |
⁎ Age significantly younger for African-American men than for European-American men (p <0.001).
† Body mass index significantly greater for African-American women than for European-American and Hispanic-American women (p <0.05).
‡ Percentage of ischemic heart disease significantly less for African-American men and women than for European-American men and women (p <0.05).
§ Peak VO 2 significantly lower in African-American women than European-American women (p <0.05).
¶ Presence of intraventricular conduction defect significantly lower in African-American men than European-American men (p <0.05).
∥ HFSS in African-American men and Hispanic-American men was significantly greater than in European-American men (p <0.05).
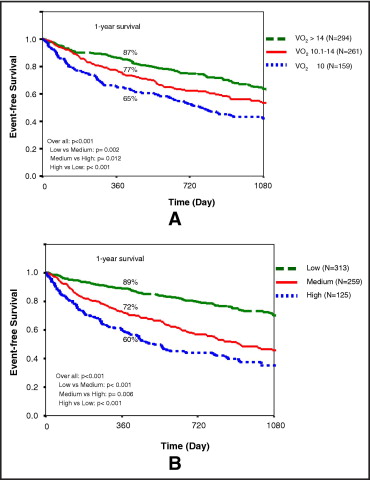
The peak VO 2 was determined during the maximal treadmill exercise using a modified Naughton protocol and a metabolic cart (Medical Graphics, Minneapolis, Minnesota). The peak VO 2 risk strata were defined as a low (>14 ml/kg/min), medium (10.1 to 14 ml/kg/min), or high risk (≤10 ml/kg/min), using previously described criteria. The HFSS includes 7 parameters: heart rate at rest, mean blood pressure, left ventricular (LV) ejection fraction, serum sodium, ischemic heart disease, intraventricular conduction defect, and peak VO 2 . For the LV ejection fraction and serum sodium, the measurements obtained within a ±3-month window and closest to the exercise test were used. Ischemic heart disease and intraventricular conduction were coded as 1 (present) and 0 (absent). Intraventricular conduction defect was defined as a QRS interval of ≥120 ms due to left or right bundle branch block, nonspecific intraventricular conduction delay, or ventricular-paced rhythm. Each variable was multiplied by a model coefficient, derived from a proportional hazard model. The 7 products were summed, and the absolute value was determined according to the following equation: HFSS = [(0.0216 × heart rate at rest) + (−0.0255 × mean blood pressure) + (−0.0464 × LV ejection fraction) + (−0.047 × serum sodium) + (−0.0546 × peak VO 2 ) + (0.608 × presence or absence of intraventricular conduction defect) + (0.6931 × presence or absence of ischemic heart disease)]. For the HFSS, the risk strata were defined as a low (≥8.10 ml/kg/min), medium (7.20 to 8.09 ml/kg/min), and high risk (≤7.19 ml/kg/min), using previously described cutoffs.
The outcome events were defined as death, United Network of Organ Sharing status 1 urgent transplantation or implantation of a LV assist device. Patients who underwent transplantation as United Network of Organ Sharing status 2 were censored alive on the date of the transplantation. The vital status of the patients lost to follow-up was assessed using the Social Security Death Index.
The variables were compared among races and between genders using analysis of variance. The association between the variables and mortality was assessed using Cox proportional hazards models. Event-free survival was determined using the Kaplan-Meier method and compared using log-rank analysis. The area under the receiver operating characteristic curve (AUC) analysis was calculated to examine the discriminatory value of the variables for the detection of an end point during 1 and 2 years of follow-up. The significance between AUC values was tested using the method of Hanley and McNeil. All analyses, except for the comparison between each AUC, were performed using the Statistical Package for Social Sciences, version 11.0 (SPSS, Chicago, Illinois).
Results
The clinical characteristics are listed in Table 1 . HFSS could not be calculated for 18 patients because of missing data. The peak VO 2 was lower in women, especially among African-American women. The HFSS was lower in European- than in African- or Hispanic-American men.
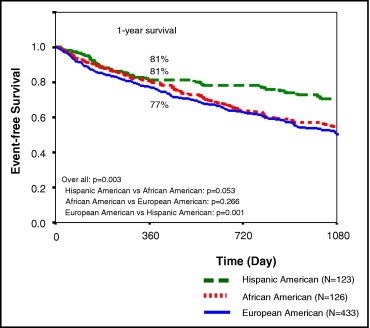
During the 962 ± 912 days of follow-up, 354 outcome events (49.5%) occurred. Of these 354 patients, 170 underwent United Network of Organ Sharing status 1 HTx, 148 patients died, 36 underwent LV assist device implantation, 35 underwent elective heart transplantation, and 326 patients were alive without transplantation at the last follow-up point. Event-free survival is shown by race in Figure 2 , overall survival by peak VO 2 and HFSS in Figure 3 , and peak VO 2 , HFSS, and race in Figures 4 and 5 . Survival differed markedly by peak VO 2 and HFSS in all comparisons but with greater significance for the HFSS. Table 2 lists the 1-year survival stratified by peak VO 2 , HFSS, and race.
| Variable | Total Cohort | European American | African American | Hispanic American | ||||
|---|---|---|---|---|---|---|---|---|
| Patients (n) | 1-Year Survival | Patients (n) | 1-Year Survival | Patients (n) | 1-Year Survival | Patients (n) | 1-Year Survival | |
| Overall survival | 78% | 77% | 81% | 81% | ||||
| Heart failure survival score stratum | 697 | 417 | 125 | 123 | ||||
| Low risk (≥8.10) | 313 (45%) | 89% | 168 (40%) | 87% | 68 (54%) | 91% | 61 (50%) | 93% |
| Medium risk (7.20–8.09) | 259 (37%) | 72% | 162 (39%) | 73% | 37 (30%) | 72% | 49 (40%) | 72% |
| High risk (≤7.19) | 125 (18%) | 60% | 87 (21%) | 61% | 20 (16%) | 58% | 13 (10%) | 62% |
| Peak oxygen consumption stratum | 714 | 432 | 126 | 123 | ||||
| Low risk (>14) | 294 (41%) | 87% | 190 (44%) | 84% | 43 (34%) | 93% | 44 (36%) | 88% |
| Medium risk (10.1–14) | 271 (38%) | 77% | 156 (36%) | 77% | 43 (34%) | 78% | 52 (42%) | 79% |
| High risk (≤10) | 159 (21%) | 65% | 86 (20%) | 62% | 40 (32%) | 70% | 27 (22%) | 74% |
Table 3 lists the prognostic significance of the measurements by Cox regression analysis. On univariate analysis, the HFSS, peak VO 2 , mean blood pressure, and serum sodium were significant predictors of events for all races. On multivariate Cox regression analysis with the individual components of the HFSS and other clinical variables, peak VO 2 was a significant predictor of events for all races. Also, on multivariate Cox regression analysis with HFSS and other clinical variables (except for the components of the HFSS), the HFSS was a significant predictor in all groups.
| Variable | Total Cohort | European American | African American | Hispanic American | ||||
|---|---|---|---|---|---|---|---|---|
| HR (95% CI) | p Value | HR (95% CI) | p Value | HR (95% CI) | p Value | HR (95% CI) | p Value | |
| Univariate | ||||||||
| Age | 0.99 (0.99–1.01) | 0.459 | 1.00 (0.99–1.01) | 0.526 | 0.99 (0.97–1.01) | 0.552 | 0.99 (0.97–1.03) | 0.846 |
| Men | 1.22 (0.98–1.52) | 0.081 | 1.30 (0.96–1.76) | 0.087 | 1.20 (0.74–1.95) | 0.462 | 0.83 (0.47–1.47) | 0.528 |
| Body mass index | 0.98 (0.96–0.99) | 0.019 ⁎ | 0.98 (0.96–1.01) | 0.150 | 0.99 (0.95–1.03) | 0.573 | 0.96 (0.90–1.01) | 0.113 |
| Ischemic heart disease | 1.14 (0.92–1.41) | 0.230 | 1.08 (0.83–1.41) | 0.566 | 0.80 (0.43–1.46) | 0.463 | 1.09 (0.60–1.99) | 0.778 |
| Heart rate at rest | 1.01 (1.00–1.02) | 0.010 ⁎ | 1.01 (1.00–1.02) | 0.020 ⁎ | 1.01 (0.99–1.03) | 0.258 | 0.99 (0.98–1.02) | 0.911 |
| Mean blood pressure at rest | 0.97 (0.96–0.98) | <0.001 ⁎ | 0.97 (0.96–0.98) | <0.001 ⁎ | 0.97 (0.96–0.99) | 0.001 ⁎ | 0.95 (0.93–0.97) | <0.001 ⁎ |
| Peak oxygen consumption | 0.92 (0.90–0.94) | <0.001 ⁎ | 0.93 (0.90–0.96) | <0.001 ⁎ | 0.90 (0.85–0.96) | 0.001 ⁎ | 0.89 (0.83–0.96) | 0.001 ⁎ |
| Sodium | 0.92 (0.90–0.95) | <0.001 ⁎ | 0.93 (0.89–0.96) | <0.001 ⁎ | 0.95 (0.90–0.99) | 0.040 ⁎ | 0.89 (0.83–0.95) | 0.001 ⁎ |
| Left ventricular ejection fraction | 0.96 (0.94–0.97) | <0.001 ⁎ | 0.97 (0.95–0.98) | <0.001 ⁎ | 0.98 (0.95–1.02) | 0.330 | 0.93 (0.89–0.97) | <0.001 ⁎ |
| Intraventricular conduction defect | 1.62 (1.36–2.01) | <0.001 ⁎ | 1.54 (1.16–2.05) | 0.003 ⁎ | 1.86 (1.14–3.04) | 0.013 ⁎ | 1.52 (0.86–2.69) | 0.147 |
| Heart Failure Survival Score | 0.52 (0.46–0.59) | <0.001 ⁎ | 0.57 (0.49–0.67) | <0.001 ⁎ | 0.54 (0.41–0.72) | <0.001 ⁎ | 0.39 (0.27–0.58) | <0.001 ⁎ |
| Multivariate (independent Heart Failure Survival Score parameters) | ||||||||
| Age | 0.99 (0.98–1.00) | 0.042 ⁎ | 0.99 (0.98–1.01) | 0.255 | 0.98 (0.96–1.00) | 0.105 | 1.00 (0.96–1.04) | 0.986 |
| Men | 1.48 (1.16–1.89) | 0.002 ⁎ | 1.55 (1.10–2.18) | 0.012 ⁎ | 1.79 (1.02–3.14) | 0.042 | 1.31 (0.66–2.58) | 0.441 |
| Body mass index | 0.97 (0.95–0.99) | 0.002 ⁎ | 0.97 (0.94–0.99) | 0.020 ⁎ | 0.98 (0.94–1.02) | 0.256 | 0.97 (0.92–1.03) | 0.350 |
| Ischemic heart disease | 1.02 (0.81–1.29) | 0.873 | 0.94 (0.70–1.27) | 0.692 | 0.81 (0.42–1.55) | 0.517 | 0.92 (0.43–1.95) | 0.826 |
| Heart rate at rest | 1.01 (1.00–1.02) | 0.006 ⁎ | 1.01 (0.99–1.02) | 0.143 | 1.00 (0.99–1.02) | 0.694 | 1.00 (0.98–1.03) | 0.813 |
| Mean blood pressure at rest | 0.97 (0.96–0.98) | <0.001 ⁎ | 0.98 (0.96–0.99) | <0.001 ⁎ | 0.98 (0.96–0.99) | 0.020 ⁎ | 0.95 (0.92–0.98) | 0.001 ⁎ |
| Peak oxygen consumption | 0.92 (0.89–0.94) | <0.001 ⁎ | 0.92 (0.89–0.96) | <0.001 ⁎ | 0.90 (0.84–0.96) | 0.002 ⁎ | 0.91 (0.83–0.99) | 0.037 |
| Sodium | 0.96 (0.94–0.99) | 0.013 ⁎ | 0.97 (0.93–1.01) | 0.084 | 0.98 (0.92–1.04) | 0.438 | 0.95 (0.87–1.03) | 0.209 |
| Left ventricular ejection fraction | 0.99 (0.97–1.00) | 0.069 | 0.99 (0.97–1.01) | 0.365 | 1.01 (0.97–1.05) | 0.780 | 0.98 (0.93–1.03) | 0.399 |
| Intraventricular conduction defect | 1.54 (1.23–1.93) | <0.001 ⁎ | 1.36 (1.01–1.84) | 0.041 | 1.97 (1.14–3.40) | 0.015 ⁎ | 1.92 (0.94–3.92) | 0.075 |
| Multivariate (Heart Failure Survival Score as 1 parameter) | ||||||||
| Age | 0.99 (0.98–0.99) | 0.020 ⁎ | 0.99 (0.98–1.00) | 0.206 | 0.99 (0.97–1.01) | 0.230 | 0.98 (0.95–1.01) | 0.189 |
| Men | 1.19 (0.94–1.49) | 0.146 | 1.25 (0.92–1.72) | 0.160 | 1.12 (0.69–1.82) | 0.659 | 1.15 (0.60–2.23) | 0.670 |
| Body mass index | 0.97 (0.95–0.99) | 0.005 ⁎ | 0.97 (0.95–0.99) | 0.045 | 0.98 (0.94–1.02) | 0.326 | 0.96 (0.91–1.02) | 0.183 |
| Heart Failure Survival Score | 0.52 (0.46–0.59) | <0.001 ⁎ | 0.58 (0.49–0.67) | <0.001 ⁎ | 0.53 (0.40–0.71) | <0.001 ⁎ | 0.37 (0.25–0.56) | <0.001 ⁎ |
Stay updated, free articles. Join our Telegram channel

Full access? Get Clinical Tree


