Transradial artery (TRA) approach is associated with fewer vascular complications and reduced mortality in patients at high risk compared with transfemoral approach (TFA). The objective of our study was to compare the characteristics and outcomes of patients who had coronary angiography by TRA and TFA over the course of hospital implementation of this approach. We included 12,928 patients from Baylor University Medical Center and Baylor Heart and Vascular Hospital, Dallas, Texas, who underwent a coronary angiography from January 2008 to March 2015. To control for selection bias and the learning curve, a nested matched study design was used for patients with percutaneous coronary intervention (PCI) with TRA patients matched with TFA by age (±2 years) and calendar year of the procedure in a ratio of 1:3. TRA for PCI increased from nearly 0% in 2008 to 9% in 2014. Including patients from 2011 to 2015 for the analysis, patients with TFA were older (65 ± 12 vs 64 ± 11) and had lower mean body mass index (30 ± 7 vs 33 ± 9 kg/m 2 ) than patients with TRA. Patients with TRA had less bleeding, dialysis, pseudoaneurysm, and access site hematomas than the patients with TRA (0.7% vs 0%; p = 0.02). By a conditional logistic regression, we observed fewer complications, readmissions, and in-hospital deaths among TRA patients than the matched TFA patients. In conclusion, patients undergoing angiography with/without PCI through TRA had fewer complications, readmissions, and a shorter length of hospital stay after procedure versus TFA at our hospital.
The transradial artery (TRA) approach for coronary angiography and percutaneous coronary intervention (PCI) was not widely practiced until 2007 in the United States. With the implementation of several training programs, the practice of TRA for PCI procedures increased from 1.18% in 2007 to 16.1% in 2012. These data were reported by National Cardiovascular Data Registry CathPCI registry that included 3 million cases from 1,400 US hospitals. The National Cardiovascular Data Registry CathPCI registry is one of the oldest of the American College of Cardiology registries and was launched in 1998. Since its inception, ≥12 million records have been submitted from 1,577 US hospitals. Data on demographics, history and risk factors, hospital presentations, medications, and in-hospital outcomes are contained in the registry. The objective of our study was to compare the characteristics and outcomes of patients who had a coronary angiography by TRA and transfemoral approach (TFA).
Methods
This is a retrospective cohort study including all patients (January 2008 to March 2015) from Baylor University Medical Center and Jack and Jane Hamilton Heart and Vascular Hospital, Dallas, Texas, who underwent coronary catheterization (with/without PCI) through a femoral or radial artery approach. Patients with a procedure through brachial artery approach and those with crossover from radial to femoral or vice versa were excluded. For those patients who had multiple instances, the first instance recorded in the registry was considered. A nested matched study was performed including only patients with a PCI procedure. Patients with a PCI by TRA were matched by age (±2 years) and year of the procedure with those patients who had the procedure performed by TFA in a ratio of 1:3.
Data were obtained from the Baylor patients captured for the American College of Cardiology CathPCI registry. Information on demographics, co-morbidities, procedure duration, arterial access, type and amount of contrast used, and fluoroscopy dose with associated fluoroscopic time were collected. Data on immediate complications were also obtained from the registry. In addition, data on readmissions and complications from our local hospital database were collated with the registry for analysis.
Analyses were conducted in Stata 14.1. Differences in baseline characteristics, procedural details, and complications between femoral and radial access were compared using chi-square/Fisher’s exact tests for proportions and Student t test/Wilcoxon rank sum test for continuous variables where applicable. Conditional logistic regression analysis was used to compare the risk factors and outcomes for the matched study design. Exact conditional logistic regression analysis was used for sparse outcomes.
This study was approved by the Baylor Health Care System Institutional Review Board with a waiver of consent.
Results
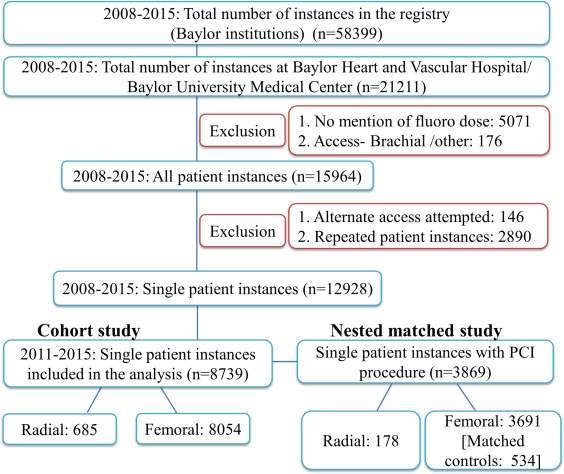
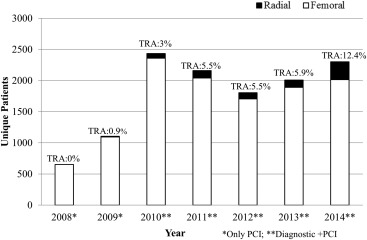
Among patients admitted to Baylor University Medical Center and Jack and Jane Hamilton Heart and Vascular Hospital during the study period, a total of 21,211 coronary angiography procedures were performed during the study period. Excluding patients based on our study criteria, we identified 12,928 patients for inclusion in the study ( Figure 1 ). Few patients had an angiography performed through TRA at our study centers between 2008 and 2010. Hence, only those patients who had coronary angiography with or without PCI from January 2011 to March 2015 were included in the analysis ( Figure 2 ). Of the 8,739 patients included in the analysis, 44% had a PCI. Among these patients with a PCI, 95% was by femoral artery approach. The rate of PCI by TRA approach increased from 3% in 2011 to about 9% in 2014.
The baseline characteristics, details of coronary stenosis, medication, and contrast details are presented in Table 1 . Patients with TRA were younger with a higher mean body mass index and better ejection fraction than those with TFA. More than 60% of the procedures in both groups were scheduled as an elective procedure. The 2 groups of patients had similar creatinine values before the procedure indicating similar kidney function. Almost all the patients in the TFA group who had heparin administered during their diagnostic catheterization had an additional procedure of either intravascular ultrasound, fractional flow reserve, or an insertion of intraaortic balloon pump. A median dose of 2,500 units of heparin was administered for those patients who had a diagnostic angiography by TRA approach. Bivalirudin was more frequently used for interventional procedures among our cohort of patients (both TRA and TFA).
| Variable | Radial (n=685) | Femoral (n=8054) | p-value |
|---|---|---|---|
| Mean Age± SD [yrs] | 64 ± 11 | 65 ± 12 | 0.04 |
| Mean Body mass index ± SD [kg/m 2 ] | 33 ± 9 | 30 ± 7 | <0.001 |
| Mean Body surface area ± SD [m 2 ] | 2.1 ±0.3 | 2 ± 0.3 | <0.001 |
| Mean Left ventricular ejection fraction pre-procedure ± SD [%] | 53 ±12 | 50 ± 13 | 0.0002 |
| Men | 401 (59%) | 4929 (61%) | |
| Women | 284 (42%) | 3125 (39%) | 0.17 |
| Elective procedure | 475 (69%) | 4929 (63%) | |
| Emergency procedure | 10 (2%) | 766 (10%) | |
| Urgent procedure | 199 (29%) | 2189 (28%) | <0.001 |
| Diabetes mellitus | 65 (10%) | 1347 (17%) | <0.001 |
| Cerebrovascular accident | 19 (3%) | 455 (6%) | 0.001 |
| Peripheral vascular disease | 31 (5%) | 359 (5%) | 0.93 |
| Chronic lung disease | 9 (1%) | 306 (4%) | 0.001 |
| Hypertension | 146 (21%) | 3085 (38%) | <0.001 |
| Congestive heart failure | 84 (12%) | 1383 (17%) | 0.001 |
| Cardiogenic shock 24 hours | 1 (0.2%) | 65 (0.8%) | 0.06 |
| Cardiac arrest 24 hours | 1 (0.2%) | 65 (0.8%) | 0.06 |
| Median Creatinine (range) [mg/dl] | 1.1 (0.5-3.9) | 1.1 (0.1-19.9) | 0.92 |
| Median Hemoglobin (range) [g/dl] | 13.8 (8.2-18) | 13.5 (1.3-19) | 0.13 |
| Family history of Coronary artery disease | 223 (33%) | 2022 (25%) | <0.001 |
| Prior Coronary Intervention | 75 (11%) | 1648 (21%) | <0.001 |
| Prior Coronary artery bypass grafting | 6 (0.9%) | 1117 (14%) | <0.001 |
| Prior Valvular Surgery | 2 (0.3%) | 67 (0.8%) | 0.17 |
| Left Ventriculogram | 456 (67%) | 6660 (83%) | <0.001 |
| Intra-aortic balloon pump | 1 (0.2%) | 106 (1%) | 0.003 |
| Mechanical ventilator support | 0 (0%) | 15 (0.2%) | 0.62 |
| Percutaneous coronary intervention | 178 (26%) | 3691 (46%) | <0.001 |
| Median duration of the procedure[mins] (range) | 42 (14-194) | 43 (3-328) | 0.92 |
| Native artery stenosis | |||
| Left main | 146 (21%) | 1970 (25%) | 0.07 |
| Prox left anterior descending | 109 (16%) | 1753 (22%) | <0.001 |
| Mid distal left anterior descending | 214 (31%) | 2652 (33%) | 0.37 |
| Left circumflex | 32 (5%) | 457 (6%) | 0.34 |
| Right coronary artery | 21 (3%) | 378 (5%) | 0.05 |
| Ramus | 543 (79%) | 6718 (83%) | 0.005 |
| Anticoagulation | |||
| Diagnostic (no PCI)[n=4870] ∗ | |||
| Bivalirudin | 0 (0%) | 10 (0.2%) | |
| Median Bivalirudin[cc] (range) | — | 13.9 (7.5-47.5) | NA |
| Heparin | 483 (95%) | 276 (6%) | |
| Median Heparin[units] (range) | 2500 (1000-7000) | 3000 (2000-9000) | <0.001 |
| Interventional (PCI)[n=3869] | |||
| Bivalirudin | 146 (82%) | 2172 (59%) | |
| Median Bivalirudin[cc] (range) | 13.5 (6.8-25.5) | 13.5 (5.6-180) | 0.02 |
| Heparin | 20 (11%) | 1262 (34%) | |
| Median Heparin[units] (range) | 3750 (1000-7000) | 5000 (1000-19000) | <0.001 |
| Radiation | |||
| Median Fluoroscopy dose [mGy] (range) | 806 (14-12622) | 972.5 (1-25009) | <0.001 |
| Median Fluoroscopy time [mins] (range) | 7 (1-77) | 6.7 (0.1-149) | <0.001 |
| Contrast | |||
| lopamidol | 568 (83%) | 5892 (73%) | |
| Median contrast volume[cc] (range) | 200 (20-600) | 200 (20-950) | <0.001 |
| Iohexol | 104 (15%) | 1870 (23%) | |
| Median contrast volume[cc] (range) | 200 (150-400) | 200 (20-1050) | 0.06 |
| Iodixanol | 13 (2%) | 265 (3%) | |
| Median contrast volume[cc] (range) | 150 (150-300) | 150 (30-450) | 0.25 |
| Median length of stay post Cath[days] (range) | 0 (0-14) | 1 (0-62) | <0.001 |
∗ TFA patients had additional procedure of intravascular ultrasound, fractional flow reserve measurement along with the diagnostic cath.
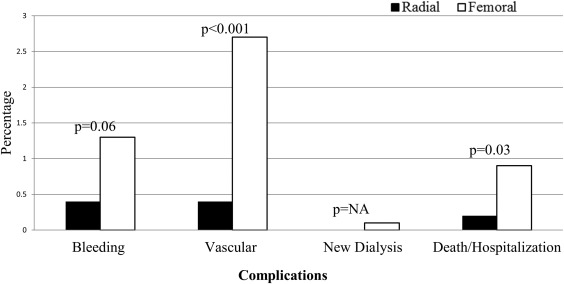
Patients with the TFA had higher crude rates of complications and readmissions compared with those with a TRA approach. The incidence of vascular complications and adverse events were greater among TFA and were statistically significant ( Figure 3 ). Access site hematomas occurred more frequently in the TFA group (p = 0.02). No in-hospital deaths were documented in the TRA group compared with 49 in the TFA group (p = 0.03; Table 2 ).
| Radial (n=685) | Femoral (n=8054) | p-value | |
|---|---|---|---|
| Bleeding | 3 (0.4%) | 102 (1%) | 0.06 |
| Entry site | 0 (0%) | 26 (0.3%) | 0.26 |
| Retroperitoneal | — | 11 (0.1%) | — |
| GI y & GU z | 0 (0%) | 21 (0.3%) | 0.18 |
| Vascular | 3 (0.4%) | 217 (3%) | <0.001 |
| Hematoma access site | 0 (0%) | 55 (0.7%) | 0.02 |
| Other vascular | 0 (0%) | 22 (0.3%) | 0.41 |
| Pseudoaneurysm | 0 (0%) | 22 (0.3%) | 0.41 |
| PCI significant dissection | 3 (2%) | 128 (4%) | 0.29 |
| PCI perforation | 0 (0%) | 15 (0.4%) | NA |
| New Dialysis | 0 (0%) | 10 (0.1%) | NA |
| Outcome | 1 (0.2%) | 73 (0.9%) | 0.03 |
| In-Hospital mortality | 0 (0%) | 49 (0.6%) | 0.03 |
| Readmissions | 1 (0.2%) | 24 (0.3%) | 0.48 |
Only those patients with a PCI were included in the nested matched study. TRA patients were matched by age (±2 years) and year of the procedure with TFA patients in a ratio of 1:3. There were a total of 178 TRA and 534 matched TFA patients. TRA patients had a higher mean body mass index and better left ventricular ejection fraction than TFA. A larger proportion of the TFA patients had a left ventriculogram done compared TRA. The baseline creatinine and hemoglobin levels were similar ( Table 3 ). Patients with a PCI by TRA had fewer complications compared with TFA ( Figure 4 ). TFA patients experienced significantly increased vascular complications than TRA patients (p = 0.03; Table 4 ).
| Variable | Radial (n=178) | Femoral Controls (n=534) | p-value |
|---|---|---|---|
| Mean Age± SD [yrs] | 64 ± 11 | 64 ± 11 | 0.19 |
| Mean Body mass index ± SD [kg/m 2 ] | 31 ± 8 | 30 ± 6 | 0.03 |
| Mean Body surface area ± SD [m 2 ] | 2.1 ± 0.3 | 2 ± 0.3 | <0.001 |
| Mean Left ventricular ejection fraction pre procedure ± SD [%] | 53 ± 10 | 49 ± 12 | 0.001 |
| Men | 129 (73%) | 360 (67%) | |
| Women | 49 (28%) | 174 (33%) | 0.19 |
| Elective procedure | 103 (58%) | 236 (46%) | Ref |
| Emergency procedure | 8 (5%) | 94 (18%) | <0.001 |
| Urgent procedure | 66 (37%) | 186 (36%) | 0.11 |
| Diabetes mellitus | 65 (37%) | 197 (37%) | 0.93 |
| Cerebrovascular disease | 10 (6%) | 41 (8%) | 0.36 |
| Peripheral vascular disease | 21 (12%) | 48 (9%) | 0.27 |
| Chronic lung disease | 9 (5%) | 46 (9%) | 0.14 |
| Hypertension | 145 (82%) | 424 (79%) | 0.49 |
| Congestive heart failure | 14 (8%) | 69 (13%) | 0.07 |
| Cardiogenic shock 24 hours | 0 (0%) | 4 (0.8%) | 0.58 ∗ |
| Cardiac arrest 24 hours | 0 (0%) | 5 (0.9%) | 0.34 ∗ |
| Median Creatinine (range) [mg/dl] | 1.1 (0.5-3.9) | 1 (0.4-19.9) | 0.36 |
| Hemoglobin (range) [g/dl] | 13.8 (8.2-18) | 13.6 (1.3-17.7) | 0.29 |
| Family history of Coronary artery disease | 52 (29%) | 119 (22%) | 0.05 |
| Prior Coronary Intervention | 38 (21%) | 132 (25%) | 0.33 |
| Prior Coronary artery bypass grafting | 3 (2%) | 97 (18%) | <0.001 ∗ |
| Prior Valvular Surgery | 1 (0.6%) | 2 (0.4%) | NA ∗ |
| Left Ventriculogram | 103 (58%) | 433 (81%) | <0.001 |
| Intra-aortic balloon pump | 0 (0%) | 5 (0.9%) | 0.34 ∗ |
| Native artery stenosis | |||
| Left Main | 63 (35%) | 152 (29%) | 0.08 |
| Prox left anterior descending | 31 (17%) | 167 (31%) | <0.001 |
| Mid distal left anterior descending | 64 (36%) | 138 (26%) | 0.01 |
| Left circumflex | 12 (7%) | 31 (6%) | 0.64 |
| Right coronary artery | 7 (4%) | 43 (8%) | 0.07 |
| Ramus | 139 (78%) | 421 (79%) | 0.8 |
| Interventional anticogulation | |||
| Bivalirudin | 146 (82%) | 277 (52%) | <0.001 |
| Median Total Bivalirudin[cc] (range) | 13.5 (6.8-25.5) | 13.5 (7.5-38) | 0.07 |
| Heparin | 20 (11%) | 221 (41%) | <0.001 |
| Median Total Heparin[units] (range) | 3750 (1000-7000) | 6000 (1000-11000) | 0.02 |
| Radiation | |||
| Median Fluoroscopy dose [mGy](range) | 1795.5 (23-12622) | 1728 (2-7636) | 0.1 |
| Median Fluoroscopy time [mins](range) | 16 (6-77.3) | 11.7 (3-59) | <0.001 |
| Median duration of the procedure [mins] (range) | 61 (25-194) | 52 (13-163) | <0.001 |
| Contrast | |||
| lopamidol | 145 (82%) | 402 (76%) | |
| Median contrast volume[cc] (range) | 200 (200-600) | 250 (50-600) | 0.03 |
| Iohexol | 28 (16%) | 116 (22%) | 0.03 |
| Median contrast volume[cc] (range) | 300 (150-400) | 300 (40-800) | 0.25 |
| Iodixanol | 5 (3%) | 13 (2%) | 0.89 |
| Median contrast volume[cc] (range) | 300 (150-300) | 300 (150-300) | 0.55 |
| Median length of stay post Cath[days] (range) | 1 (0-7) | 1 (0-61) | 0.001 |
Stay updated, free articles. Join our Telegram channel

Full access? Get Clinical Tree


