Although current literature demonstrates metabolic abnormalities are associated with mortality, obese patients who tend to have more metabolic abnormalities paradoxically have lower overall mortality rates compared to their normal-weight counterparts. In this study, we examined the prevalence of metabolic abnormality clustering and its relation to mortality in obese and normal-weight patients after percutaneous coronary intervention (PCI). Patients (n = 9,673) undergoing elective PCI from October 2003 through December 2006 at a single urban hospital were categorized by body mass index (BMI) levels of 18.5 to 24.9, 25.0 to 29.9, 30.0 to 34.9, and ≥35 kg/m 2 and by number of metabolic abnormalities possessed (hypertension, impaired fasting glucose/diabetes, triglycerides ≥150 mg/dl, high-density lipoprotein cholesterol < 40 mg/dl, and C-reactive protein ≥2.0 mg/L). All-cause mortality was assessed through June 30, 2007. Mean age of patients was 65.9 years and 66% were men. Prevalences of 4 or 5 metabolic abnormalities were 12%, 18%, 24%, and 31% in patients with BMI levels of 18.5 to 24.9, 25.0 to 29.9, 30 to 34.9, and ≥35 kg/m 2 , respectively. In patients with BMI of 30.0 to 34.9 kg/m 2 , hazard ratios (95% confidence intervals) for mortality associated with 2, 3, and 4 to 5 metabolic abnormalities versus 0 to 1 metabolic abnormality were 1.31 (0.79 to 2.17), 1.42 (0.83 to 2.43), and 2.39 (1.24 to 4.59), respectively. Analogous hazard ratios for patients with BMI ≥35 kg/m 2 were 1.94 (0.90 to 4.20), 1.44 (0.63 to 3.28), and 2.17 (0.91 to 5.18). All-cause mortality rates per 1,000 person-years were 55.5, 33.7, 28.3, and 33.8 in patients with BMI levels of 18.5 to 24.9, 25 to 29.9, 30 to 34.9, and ≥35 kg/m 2 , respectively. In conclusion, BMI levels of 25.0 to 29.9 and 30 to 34.9 kg/m 2 were associated with lower all-cause mortality after PCI. However, an increased number of metabolic abnormalities translated into increased all-cause mortality.
Metabolic abnormalities including impaired fasting glucose, increased C-reactive protein (CRP), increased triglycerides, low high-density lipoprotein (HDL) cholesterol, and hypertension are more common at higher levels of body mass index (BMI). In previous studies, these metabolic abnormalities have been associated with an increased mortality risk after percutaneous coronary intervention (PCI). Although obese patients are more likely to have metabolic abnormalities present, recent data have demonstrated that obese patients have lower mortality and complication rates after PCI compared to their normal-weight counterparts. This has given rise to the term “obesity paradox.” Because this is a recently described phenomenon, the association between clustering of multiple metabolic abnormalities in obese patients and mortality after PCI is not well studied. For the present study, we assessed the prevalence of clustering of metabolic abnormalities by category of BMI and whether this clustering is associated with increased mortality after PCI in patients with BMIs 18.5 to 24.9, 25 to 29.9, 30 to 34.9, and >35 kg/m 2 . In addition, we determined how clustering of metabolic abnormalities was related to the protective association between obesity and all-cause mortality in patients undergoing PCI.
Methods
All patients undergoing PCI at the Mount Sinai Hospital (New York, New York) since 1999 have been enrolled in an outcomes registry. The population for the present analysis was limited to adult patients ≥18 years of age who underwent elective PCI from October 1, 2003, when CRP data began to be collected, through December 31, 2006. For patients who received multiple PCI procedures during the study period, the earliest index presentation was used for data collection purposes. Patients with end-stage renal disease on dialysis, receiving primary PCI after acute myocardial infarction, or who died before hospital discharge were excluded from analysis. After these exclusions, the present analysis included 9,673 patients.
All aspects of this study including data collection, registry entry, and follow-up were approved by the Mount Sinai School of Medicine institutional review board. All patients provided consent for the collection and analysis of procedural and outcome data.
All data were collected using standardized methods and recorded onto forms designed for the PCI registry. Demographic characteristics and smoking status were based on patient self-report. Height and weight were measured by clinical staff on hospital admission before PCI. BMI was calculated as a patient’s weight divided by height in meters squared. Standard categorizations of BMI by the World Health Organization and International Obesity Task Force were employed in this study. Patients were categorized based on their calculated BMI into the following groups: 18.5 to 24.9, 25.0 to 29.9, 30.0 to 34.9, and ≥35 kg/m 2 . Medical history including a diagnosis of diabetes, hypertension, or left ventricular ejection fraction (LVEF) was ascertained through chart review conducted by trained research staff. Medications were abstracted from medical charts by research staff. Laboratory values including fasting lipid profiles, high-sensitivity CRP, and plasma glucose were measured before patients underwent PCI. Metabolic abnormalities were defined as CRP ≥2 mg/L, impaired fasting glucose (fasting plasma glucose ≥100 mg/dl or previous diagnosis of diabetes mellitus), documented previous diagnosis of hypertension, serum triglycerides ≥150 mg/dl, and HDL cholesterol <40 mg/dl.
All-cause mortality was ascertained through the New York State interventional database and the National Death Index by matching patients’ social security numbers to death index records. Deaths occurring through June 30, 2007 were ascertained for patients included in this study.
Baseline characteristics were calculated by BMI category (18.5 to 24.9, 25 to 29.9, 30 to 34.9, >35 kg/m 2 ) as means for continuous variables and prevalences for dichotomous variables. Statistical significance of linear trends for continuous and dichotomous variables across BMI categories was tested by including the median of each BMI category as a continuous independent variable in linear and logistic regression models, respectively. Follow-up for each patient was calculated as the time from their index procedure to date of death or, for those who were not deceased, June 30, 2007. All-cause mortality rates were calculated by BMI category, number of metabolic abnormalities present, and cross-classification of BMI categories with number of metabolic abnormalities present. Hazard ratios for all-cause mortality associated with BMI category were calculated using Cox proportional hazards regression models after initial adjustment for age, race, and gender, and, subsequently, after further adjustment for current and former cigarette smoking, history of myocardial infarction, statin use, chronic kidney disease, and LVEF. In a final model, the association between BMI levels 25 to 29.9, 30 to 34.9, and ≥35 kg/m 2 versus those with BMI levels 18.5 to 24.9 kg/m 2 and mortality was calculated after further adjustment for all metabolic abnormalities. In addition, multivariable-adjusted hazard ratios for mortality associated with BMI categories were calculated separately for patients with 0 to 1 metabolic abnormality and 2, 3, and 4 to 5 metabolic abnormalities. Association between number of metabolic abnormalities present and all-cause mortality was calculated after age, race, gender, and multivariable adjustment including BMI categories and in models stratified by BMI categories. Statistical significance of differences in associations across strata of metabolic abnormalities and BMI categories was assessed by comparing log likelihood for models without and with interaction terms. The proportionality assumption of Cox regression models was confirmed using Schoenfeld residuals. All data management and analysis were conducted using SAS 8.1 (SAS Institute, Cary, North Carolina).
Results
Characteristics of 9,673 patients included in the present analysis at time of PCI are presented by BMI category in Table 1 . Approximately 26% of patients had BMI 18.5 to 24.9 kg/m 2 and 40%, 22%, and 12% had BMIs of 25.0 to 29.9, 30 to 34.9, and ≥35 kg/m 2 , respectively. Patients in the higher BMI categories were younger, more likely to be African-American or Hispanic, and women. In addition, patients with a higher BMI were more likely to be current smokers, use statins, and have higher levels of low-density lipoprotein cholesterol, triglycerides, glucose, CRP, and LVEF. Each of the 5 metabolic abnormalities was more prevalent at higher BMI categories.
| Characteristic | Body Mass Index (kg/m 2 ) | p Value for Trend | |||
|---|---|---|---|---|---|
| 18.5–24.9 (n = 2,500) | 25.0–29.9 (n = 3,897) | 30.0–34.9 (n = 2091) | ≥35.0 (n = 1,185) | ||
| Age (years) | 69.5 ± 12.2 | 66.4 ± 11.5 | 64.4 ± 11.2 | 62.1 ± 11.3 | <0.001 |
| Race | <0.001 | ||||
| Caucasian | 49.6% | 50.2% | 46.4% | 46.3% | |
| African-American | 12.4% | 12.1% | 18.2% | 22.6% | |
| Hispanic | 18.1% | 22.9% | 27.6% | 26.1% | |
| Asian | 19.8% | 14.8% | 7.9% | 4.8% | |
| Women | 35.2% | 28.8% | 37.5% | 48.4% | <0.001 |
| Current smokers | 16.6% | 18.5% | 19.9% | 20.6% | <0.001 |
| Low-density lipoprotein-cholesterol (mg/dl) | 81.4 ± 35.0 | 84.6 ± 37.8 | 85.1 ± 37.5 | 85.5 ± 38.8 | <0.001 |
| High-density lipoprotein-cholesterol (mg/dl) | 45.9 ± 16.0 | 42.7 ± 14.6 | 42.5 ± 14.2 | 41.7 ± 14.9 | <0.001 |
| Triglycerides (mg/dl) | 79 (57–115) | 91 (64–132) | 101 (71–146) | 106 (74–155) | <0.001 |
| Statin use | 77.7% | 82.1% | 81.7% | 81.8% | 0.001 |
| Plasma glucose (mg/dl) | 102 (91–127) | 105 (93–132) | 110 (95–140) | 118 (99–159) | <0.001 |
| C-reactive protein (mg/L) | 1.8 (0.5–5.8) | 2.3 (0.7–5.6) | 3.1 (1.0–6.7) | 4.6 (1.8–10.8) | <0.001 |
| Chronic kidney disease | 29.6% | 26.6% | 26.8% | 27.8% | 0.146 |
| Previous myocardial infarction | 19.7% | 19.9% | 19.2% | 18.7% | 0.488 |
| Left ventricular ejection fraction (%) | 49.9 ± 16.7 | 51.2 ± 15.9 | 52.0 ± 14.7 | 52.0 ± 14.9 | <0.001 |
| Diabetes mellitus | 29.3% | 35.1% | 45.9% | 55.8% | <0.001 |
| Metabolic abnormalities | |||||
| Impaired fasting glucose (plasma glucose ≥100) or diabetes | 48.7% | 55.3% | 64.3% | 71.7% | <0.001 |
| Hypertension | 82.7% | 86.1% | 90.0% | 92.0% | <0.001 |
| High-density lipoprotein-cholesterol <40 (mg/dl) | 34.1% | 41.2% | 40.3% | 44.4% | <0.001 |
| Triglycerides ≥150 mg/dl | 12.5% | 18.1% | 23.1% | 26.2% | <0.001 |
| C-reactive protein ≥2.0 mg/L | 44.6% | 50.2% | 58.8% | 70.0% | <0.001 |
Only 26%, 17%, 10%, and 5% of patients with BMI of 18.5 to 24.9, 25 to 29.9, 30 to 34.9, and BMI >35 kg/m 2 , respectively, had 0 or 1 metabolic abnormality at time of PCI (p for trend <0.001; Figure 1 ). Rates of 4 or 5 metabolic abnormalities in patients with BMI levels of 18.5 to 24.9, 25 to 29.9, 30 to 34.9, and ≥35 kg/m 2 were 12%, 18%, 24%, and 31%, respectively (p for trend <0.001).
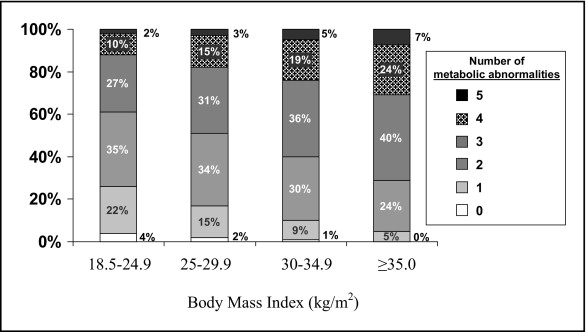
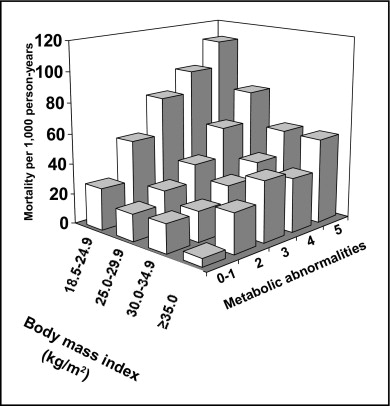
Figure 2 shows all-cause mortality rates by cross-classification of BMI categories and number of metabolic abnormalities. Regardless of number of metabolic abnormalities possessed, patients with BMI 18.5 to 24.9 kg/m 2 had the highest mortality rates. In addition, within each BMI category, more metabolic abnormalities were associated with higher all-cause mortality rates.
All-cause mortality rates per 1,000 person-years were 55.5, 33.7, 28.3, and 33.8 in patients with BMI levels of 18.5 to 24.9, 25 to 29.9, 30 to 34.9, and ≥35 kg/m 2 , respectively ( Table 2 ). Compared to those with BMI levels of 18.5 to 24.9 kg/m 2 , after adjustment for age, race, and gender, patients with BMI levels of 25 to 29.9 or 30 to 34.9 kg/m 2 , but not those with BMI ≥35 kg/m 2 , had lower hazard ratios for all-cause mortality. Results were similar after further adjustment for smoking, history of myocardial infarction, statin use, chronic kidney disease, and LVEF. However, after adjustment for metabolic abnormalities and compared to those who had a BMI from 18.5 to 24.9 kg/m 2 , patients with BMI levels of 25 to 29.9, 30 to 34.9, and ≥35 had a lower hazard ratio for all-cause mortality. Results were consistent in models stratified by number of metabolic abnormalities present (p for interaction = 0.646).
| Characteristic ⁎ | Body Mass Index (kg/m 2 ) | |||
|---|---|---|---|---|
| 18.5–24.9 (n = 2,500) | 25.0–29.9 (n = 3,897) | 30.0–34.9 (n = 2091) | ≥35.0 (n = 1,185) | |
| Deaths | 306 | 301 | 132 | 85 |
| Follow-up time (person-years) | 5,587 | 8,921 | 4,703 | 2,512 |
| Mortality rate per 1,000 person-years | 55.5 | 33.7 | 28.3 | 33.8 |
| Overall population | ||||
| Overall models | ||||
| Model 1 † | 1.00 (reference) | 0.72 (0.61–0.84) | 0.66 (0.54–0.82) | 0.92 (0.72–1.19) |
| Model 2 ‡ | 1.00 (reference) | 0.74 (0.63–0.87) | 0.68 (0.55–0.83) | 0.95 (0.55–1.22) |
| Model 3 § | 1.00 (reference) | 0.68 (0.57–0.80) | 0.58 (0.47–0.72) | 0.75 (0.58–0.96) |
| Models stratified by number of metabolic abnormalities ⁎ | ||||
| 0 or 1 | 1.00 (reference) | 0.84 (0.53–1.34) | 0.90 (0.46–1.76) | 0.35 (0.05–2.56) |
| 2 | 1.00 (reference) | 0.58 (0.43–0.78) | 0.51 (0.34–0.76) | 0.79 (0.47–1.33) |
| 3 | 1.00 (reference) | 0.65 (0.49–0.86) | 0.62 (0.44–0.89) | 0.89 (0.60–1.33) |
| 4 or 5 | 1.00 (reference) | 0.80 (0.56–1.14) | 0.57 (0.37–0.87) | 0.61 (0.38–0.98) |
⁎ Adjusted for variables listed for model 1.
† Adjusts for age, race-ethnicity, and gender.
‡ Adjusts for age, race-ethnicity, gender, body mass index, current and former smoking, previous myocardial infarction, statin use, chronic kidney disease, and left ventricular ejection fraction.
§ Includes variables in model 1 and number of metabolic abnormalities present (metabolic abnormalities defined as plasma glucose ≥100 mg/dl or diagnosed diabetes mellitus, hypertension, serum triglycerides ≥150 mg/dl, high-density lipoprotein cholesterol <40 mg/dl, and C-reactive protein ≥2.0 mg/L).
Mortality rates were 25.1, 40.4, 43.6, and 57.0 deaths per 1,000 person-years in patients with 0 to 1 metabolic abnormality, or 2, 3, or 4 to 5 metabolic abnormalities, respectively ( Table 3 ). Compared to those with 0 to 1 metabolic abnormality, those with 2, 3, or 4 to 5 metabolic abnormalities each had statistically significantly increased hazard ratios for mortality. A strong graded association between a larger number of metabolic abnormalities and higher hazard ratios for all-cause mortality remained after further adjustment including adjustment for BMI categories and was consistent across BMI categories in stratified analyses (p for interaction = 0.151).


