The incidence, correlates, and prognostic implications of pulmonary hypertension (PH) are unclear in patients with severe aortic stenosis (AS). We studied 509 patients with severe AS evaluated for transcatheter aortic valve implantation (TAVI). Patients were divided into groups based on pulmonary artery systolic pressure (PASP): group I, 161 (31.6%) with PASP <40 mm Hg; group II, 175 (34.3%) with PASP 40 to 59 mm Hg; and group III, 173 (33.9%) with PASP ≥60 mm Hg. Group III patients were more symptomatic and had higher creatinine levels and higher left ventricular end-diastolic pressure. Transpulmonary gradient was >12 mm Hg in 17 patients (10.5%), 31 patients (17.7%), and 80 patients (46.2%) in groups I through III, respectively. In a median follow-up of 202 days (73 to 446) mortality rates were 35 (21.7%), 69 (39.3%), and 85 (49.1%) in groups I through III, respectively (p <0.001). Immediately after TAVI, in patients with PASP >40 mm Hg there was significant decrease in PASP (63.1 ± 16.2 to 48.8 ± 12.4 mm Hg, p <0.0001), which remained at 1 year (50.1 ± 13.1 mm Hg, p = 0.04). After surgical aortic valve replacement there was a significant immediate decrease in PASP (66.1 ± 16.3 to 44.7 ± 14.2 mm Hg, p <0.0001), which persisted at 3 to 12 months (44.8 ± 20.1 mm Hg, p <0.001). In patients who underwent balloon aortic valvuloplasty, PASP decreased immediately after the procedure (63.2 ± 14.8 to 51.8 ± 17.1 mm Hg, p <0.0001), yet at 3 to 12 months pressure returned to baseline levels (57.4 ± 17.0 mm Hg, p = 0.29). In conclusion, patients with severe AS have a high prevalence of PH, and in patients with severe AS increased PASP is associated with increased mortality. Surgical aortic valve replacement and TAVI are effective treatments for these patients and result in a significant PASP decrease.
Left heart disease, the most frequent cause of pulmonary hypertension (PH), results in most instances from transmission of increased left ventricular diastolic and/or left atrial pressure. Thus, PH can be expected in patients with severe aortic stenosis (AS). In addition to passive transmission of left heart pressure increases, some patients with longstanding increase of left atrial pressures develop reactive PH because of a secondary increase in pulmonary arteriolar tone. Prevalence of PH in patients with AS is unclear. Previous series have included relatively small numbers and have defined PH with inconsistent definitions. It is clear that presence of PH in patients with severe AS portends a poor prognosis and is associated with sudden cardiac death and more severe symptoms. Its presence preoperatively has been found to be associated with higher mortality after valve replacement and has been found to be an independent predictor for hospital mortality and postoperative major adverse cardiovascular and cerebrovascular events. Moreover, PH has been found to be an independent predictor for late mortality after transcatheter aortic valve implantation (TAVI). This study was undertaken to investigate the prevalence, mechanisms, and correlates of PH in patients with severe AS. We also sought to explore the reversibility of PH in patients after TAVI, surgical aortic valve replacement, or balloon aortic valvuloplasty (BAV).
Methods
This prospective cohort study was approved by the institutional review board of the MedStar Health Research Institute. We consecutively enrolled 509 patients from April 2007 through December 2009 who had symptomatic severe AS and who were considered for participation in a randomized TAVI trial (Placement of Aortic Transcatheter Valves [PARTNER]). All patients were screened and consented for the study. After careful review of inclusion/exclusion criteria and operable status, 118 (23.1%) were included in the PARTNER trial (69 patients with TAVI, 30 with BAV, and 19 surgical patients). The remaining 391 patients were excluded and deferred to other treatment methods (112 to medical treatment, 187 to BAV, and 92 to surgery) based on decisions made by a team of cardiologists and cardiac surgeons. All data were prospectively entered into a dedicated database. Patients with concomitant severe mitral regurgitation, mitral stenosis regardless of severity, previous mitral valve replacement or repair, or known PH from causes other than AS were excluded from this analysis.
Doppler tracings and 2-dimensional images were obtained from parasternal long- and short axis, apical 4-chamber, and subcostal 4-chamber views. Transthoracic echocardiograms were reviewed to assess the pericardium, valvular anatomy and function, and cardiac function. Tricuspid regurgitant flow was identified by color flow Doppler techniques. Continuous-wave Doppler measured maximum jet velocity. Right ventricular systolic pressure was estimated based on the modified Bernoulli equation and was considered equal to the pulmonary artery systolic pressure (PASP) in the absence of right ventricular outflow obstruction. PASP was calculated by adding transtricuspid pressure gradient to mean right atrial pressure estimated from inferior vena cava diameter and motion during respiration as follows: if the caliber of inferior vena cava was normal (1.5 to 2.5 cm), mean right atrial pressure was estimated to be 5 mm Hg if there was complete collapse of the inferior vena cava during inspiration or was estimated to be 10 mm Hg if the inferior vena cava collapse was <50%. If the inferior vena cava was dilated, mean right atrial pressure was estimated to be 15 mm Hg if the inferior vena cava collapsed by <50% with inspiration or was estimated to be 20 mm Hg if there was no visible evidence of inferior vena cava collapse.
Right heart catheterization was performed with a 7Fr Swan–Ganz catheter. We measured right atrial pressures (amplitude of a and v waves and mean pressure), right ventricular systolic and diastolic pressures, pulmonary artery pressures (systolic, diastolic, and mean), and pulmonary capillary wedge pressures (a and v waves and mean pressure). Cardiac output was determined by the thermodilution method. Left heart catheterization was carried out from the femoral artery. Aortic valve area was calculated with the Gorlin formula. Transpulmonary gradient was calculated as mean pulmonary artery pressure minus mean pulmonary capillary wedge pressure. Pulmonary vascular resistance was calculated by dividing transpulmonary gradient by cardiac output. For purposes of this analysis, the 509 patients with severe AS entered into the registry were divided into 3 groups based of level of PASP obtained in the invasive hemodynamic study: group I, 161 (31.6%) with PASP <40 mm Hg; group II, 175 (34.3%) with PASP 40 to 59 mm Hg; and group III, 173 (33.9%) with PASP ≥60 mm Hg.
Continuous variables are presented as mean ± SD and categorical variables as proportion and percentage. Days of follow-up are presented as medians (25th, 75th percentiles). Among the 3 study groups, differences in continuous variables were compared by analysis of variance. Categorical variables were compared using chi-square test or Fisher’s exact test as indicated. Paired tests were analyzed by paired Student’s t test. Significance was set at a p value <0.05. Effects of clinical electrocardiographic, echocardiographic, and hemodynamic variables on PASP were studied with multivariable logistic regression analysis to identify variables significantly correlated with PASP ≥60 mm Hg. All univariable correlates of PASP with p values ≤0.2 were then used in the multivariable logistic regression model. Cumulative survival curves were constructed using the Kaplan–Meier method, and significance was assessed using log-rank statistic.
Results
Patients’ baseline and laboratory parameters based on PASP are presented in Table 1 . Mean age of the entire patient group was >80 years. Group III had the highest PASP (≥60 mm Hg) and were more symptomatic (New York Heart Association class IV), had higher Society of Thoracic Surgeons and European System for Cardiac Operative Risk Evaluation scores, higher body mass indexes, and a greater prevalence of renal failure, diabetes, arrhythmia, and previous myocardial infarction. This group also had a lower hemoglobin level and higher serum creatinine, C-reactive protein, and B-type natruretic peptide levels. Echocardiographic data, invasive hemodynamic data, and treatment are presented in Table 2 . Group III (PASP ≥60 mm Hg) had a larger left atrium diameter, lower ejection fraction, lower aortic valve area, higher left ventricular end-diastolic pressure, pulmonary capillary wedge pressure, and pulmonary vascular resistance.
| Baseline Characteristic | Pulmonary Artery Pressure (mm Hg) | p Value | ||
|---|---|---|---|---|
| ≤40 | 40–59 | ≥60 | ||
| (n = 161) | (n = 175) | (n = 173) | ||
| Age (years) | 82.3 ± 7.3 | 82.4 ± 8.1 | 80.5 ± 8.9 | 0.06 |
| Men | 77 (47.8%) | 74 (42.5%) | 75 (43.6%) | 0.59 |
| Society of Thoracic Surgeons score | 9.8 ± 5.3 | 11.8 ± 5.3 | 12.8 ± 6.8 | <0.001 |
| Standard EuroSCORE | 11.4 ± 3.2 | 13.1 ± 3.1 | 13.9 ± 2.9 | <0.001 |
| Logistic EuroSCORE | 28.3 ± 20.75 | 40.0 ± 20.7 | 46.6 ± 21.3 | <0.001 |
| New York Heart Association class IV | 48 (29.8%) | 84 (48.1%) | 101 (58.4%) | <0.001 |
| Body mass index (kg/m 2 ) | 26.7 ± 5.9 | 26.7 ± 6.2 | 30.1 ± 16.7 | 0.01 |
| Diabetes mellitus | 47 (29.2%) | 53 (30.2%) | 72 (41.6%) | 0.03 |
| Systemic hypertension | 142 (88.2%) | 158 (90.2%) | 169 (97.6%) | 0.51 |
| Hyperlipidemia | 112 (69.5%) | 125 (71.4%) | 133 (76.8%) | 0.28 |
| Coronary artery disease | 104 (64.6%) | 104 (59.4%) | 115 (66.4%) | 0.40 |
| Smoker | 29 (18%) | 48 (27.4%) | 46 (26.6%) | 0.11 |
| Chronic obstructive pulmonary disease | 21 (13%) | 29 (16.5%) | 32 (18.5%) | 0.38 |
| Renal failure | 57 (35.4%) | 77 (44%) | 92 (53.2%) | 0.007 |
| Previous cerebral vascular accident | 30 (18.6%) | 27 (15.4%) | 37 (21.3%) | 0.37 |
| Arrhythmia | 40 (24.8%) | 68 (38.8%) | 66 (38.1%) | 0.01 |
| Peripheral vascular disease | 51 (31.6%) | 61 (34.8%) | 57 (32.9%) | 0.78 |
| Previous coronary artery bypass grafting | 51 (31.6%) | 54 (30.8%) | 56 (32.3%) | 0.94 |
| Previous myocardial infarction | 28 (17.3%) | 43 (24.5%) | 57 (32.9%) | 0.007 |
| Hematocrit (%) | 37.0 ± 4.4 | 35.1 ± 5.0 | 35.6 ± 4.9 | 0.002 |
| Hemoglobin level (mg/dl) | 12.2 ± 1.6 | 11.5 ± 1.8 | 11.5 ± 1.7 | <0.001 |
| Platelets (×10 6 /ml) | 202 ± 77 | 205 ± 76 | 207 ± 84 | 0.85 |
| White blood cell (×10 3 /ml) | 7,775 ± 5,800 | 7,710 ± 3,240 | 7,870 ± 2,950 | 0.94 |
| Creatinine (mg/day/L) | 1.25 ± 0.5 | 1.31 ± 0.6 | 1.70 ± 1.33 | <0.001 |
| GFR (mL/min) | 49.9 ± 26.6 | 48.4 ± 24.2 | 45.1 ± 27.8 | 0.13 |
| Sodium (mg/dl) | 138.6 ± 3.2 | 137.8 ± 3.6 | 137.5 ± 4.6 | 0.04 |
| Cardiac troponin I (ng/ml) | 0.08 ± 0.38 | 0.84 ± 6.8 | 0.32 ± 1.4 | 0.31 |
| Creatine kinase-MB (u/L) | 0.97 ± 1.1 | 1.56 ± 3.0 | 1.33 ± 1.95 | 0.10 |
| C-reactive protein (mg/dl) | 10.3 ± 16.6 | 14.98 ± 22.2 | 24.36 ± 39.8 | 0.02 |
| B-type natriuretic peptide (pg/ml) | 579.5 ± 636.1 | 1,336.4 ± 1,095.2 | 1,691.1 ± 1,387.4 | <0.001 |
| Pulmonary Artery Pressure (mm Hg) | p Value | |||
|---|---|---|---|---|
| ≤40 | 40–59 | ≥60 | ||
| (n = 161) | (n = 175) | (n = 173) | ||
| Echocardiographic data | ||||
| Left atrium diameter (cm) | 4.19 ± 0.69 | 4.55 ± 0.75 | 4.67 ± 0.65 | <0.001 |
| Septal thickness (mm) | 1.35 ± 0.22 | 1.35 ± 0.23 | 1.35 ± 0.21 | 0.98 |
| Ejection fraction (%) | 54.7 ± 15.2 | 49.7 ± 16.0 | 44.4 ± 18.7 | <0.001 |
| Moderate mitral regurgitation (%) | 12 (7.4) | 32 (18.2) | 37 (21.3) | <0.001 |
| Pulmonary artery systolic pressure (mm Hg) | 33.6 ± 5.4 | 49.3 ± 4.8 | 70.7 ± 11.8 | <0.001 |
| Aortic valve area (cm 2 ) | 0.74 ± 0.2 | 0.71 ± 0.16 | 0.70 ± 0.18 | 0.05 |
| Maximum velocity across aortic valve (m/s) | 4.06 ± 0.79 | 4.11 ± 0.72 | 4.07 ± 0.72 | 0.85 |
| Mean gradients across aortic valve (mm Hg) | 42.2 ± 17.5 | 43.3 ± 15.9 | 42.9 ± 15.0 | 0.85 |
| Peak gradients across aortic valve (mm Hg) | 69.0 ± 27.7 | 68.9 ± 25.3 | 69.1 ± 24.0 | 0.99 |
| Right heart hemodynamic parameters | ||||
| Right atrium pressure (mm Hg) | 6.5 ± 3.8 | 9.4 ± 4.5 | 13.6 ± 8.7 | <0.001 |
| Pulmonary artery systolic pressure (mm Hg) | 33.7 ± 5.4 | 49.3 ± 4.8 | 70.7 ± 11.8 | <0.001 |
| Pulmonary artery diastolic pressure systolic pressure (mm Hg) | 14.1 ± 4.4 | 20.2 ± 5.2 | 27.6 ± 7.7 | <0.001 |
| Mean pulmonary artery pressure (mm Hg) | 20.6 ± 4.4 | 29.6 ± 5.2 | 41.9 ± 7.4 | <0.001 |
| Pulmonary capillary wedge pressure (mm Hg) | 13.5 ± 4.4 | 20.5 ± 5.7 | 26.6 ± 7.7 | <0.001 |
| Left ventricular systolic pressure (mm Hg) | 184.6 ± 27.9 | 180.0 ± 34.5 | 188.5 ± 37.0 | 0.18 |
| Left ventricular end-diastolic pressure (mm Hg) | 17.8 ± 8.1 | 18.9 ± 5.8 | 22.8 ± 8.9 | <0.001 |
| Cardiac output (L/min) | 4.3 ± 1.3 | 4.4 ± 1.4 | 4.1 ± 1.2 | 0.12 |
| Cardiac index (L/min/m 2 ) | 2.4 ± 0.6 | 2.4 ± 0.6 | 2.2 ± 0.6 | <0.001 |
| Pulmonary vascular resistance (Wood units) | 1.8 ± 1.2 | 2.3 ± 1.3 | 4.1 ± 2.4 | <0.001 |
| Aortic valve area (cm 2 ) | 0.69 ± 0.27 | 0.63 ± 0.17 | 0.61 ± 0.23 | 0.007 |
| Mean gradients across aortic valve (mm Hg) | 45.1 ± 20.2 | 48.7 ± 19.0 | 49.3 ± 21.1 | 0.18 |
| Treatment | ||||
| Treatment method | <0.001 | |||
| Medical | 38 (23.6%) | 43 (24.5%) | 31 (17.9%) | 0.12 |
| Balloon aortic valvuloplasty | 50 (31%) | 75 (42.8%) | 92 (53.1%) | <0.001 |
| Surgical aortic valve replacement | 52 (32.3%) | 28 (16%) | 31 (17.9%) | <0.001 |
| Transcatheter aortic valve implantation | 21 (13%) | 29 (16.5%) | 19 (10.9%) | 0.13 |
Reactive PH appears to have played a role in the level of PH. Transpulmonary gradient exceeded 12 mm Hg in 17 patients (10.5%) in group I, 31 (17.7%) in group II, and 80 (46.2%) in group III. Cardiac output was significantly lower in those with the most severe PASP (group III) so pulmonary vascular resistance in the group with the most severe level was >2 times that in patients with the lowest level of PASP (group I). Pulmonary vascular resistance >3 Wood units was seen in 22 patients (13.6%) from group I, in 47 patients (26.8%) from group II, and in 103 patients (58.8%) from group III.
Suitable patients underwent operative aortic valve replacement, and those who met selection criteria for TAVI were entered into the randomized trial. The remaining patients underwent BAV or were followed on medical management ( Table 2 ). Level of PASP was taken into account as part of the general risk assessment during treatment selection. Those with the highest PASP (≥60 mm Hg) were less often selected for surgical aortic valve replacement and more frequently selected for BAV. Those with lowest pulmonary artery pressures were more often referred for surgical valve replacement.
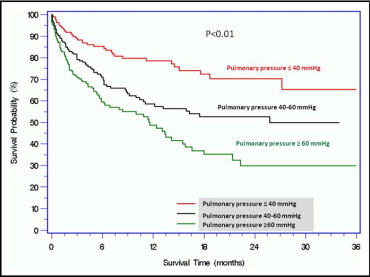
In a median (25th, 75th percentiles) interval follow-up of 202 days (73 to 446), mortality rate was progressively higher as pulmonary pressure increased. All-cause mortalities were 21.7% in group I (median follow-up 251 days), 39.3% in group II (median follow-up 216 days), and 49.1% in group III (median follow-up 152 days, p <0.001). Kaplan–Meier survival curves for the 3 groups are shown in Figure 1 . Correlates of PH are listed in Table 3 . Severity of cardiac disease and co-morbid conditions unsurprisingly played a role. Importantly, after multivariable adjustment, the strongest correlates of PH were severity of AS and evidence of left ventricular dysfunction: left atrium diameter (odds ratio [OR] 2.75, 95% confidence interval [CI] 1.4 to 5.2, p = 0.002), left ventricular end-diastolic pressure (OR 1.11, 95% CI 1.04 to 1.17, p = 0.001), pulmonary capillary wedge pressure (OR 1.23, 95% CI 1.14 to 1.32, p <0.001), and aortic valve area (OR 0.14, 95% CI 0.03 to 0.72, p = 0.01).