In patients with ST-segment elevation acute myocardial infarction (STEMI) treated with primary percutaneous coronary intervention (pPCI), abrupt reperfusion can induce myocardial injury and apoptotic cell death. Reperfusion-induced myocardial damage, however, cannot be easily evaluated in clinical practice because of the lack of specific biomarkers. Cytochrome c , a mitochondrial protein, is released on reperfusion into the cytosol, where it triggers the apoptotic process. It can reach the external fluid and circulating blood when cell rupture occurs. We measured the cytochrome c circulating levels in patients with STEMI undergoing pPCI, and correlated them with the clinical signs of myocardial necrosis and reperfusion. The plasma creatine kinase-MB mass and serum cytochrome c (enzyme-linked immunosorbent assay method) were serially measured in 55 patients with STEMI undergoing pPCI. The angiographic and electrocardiographic signs of myocardial reperfusion were also assessed. Cytochrome c transiently increased in all patients with STEMI, with a curve that paralleled that of creatine kinase-MB. A significant relation was found between the peak values of the 2 biomarkers (R = 0.35, p = 0.01) and between the areas under the 2 curves (R = 0.33, p = 0.02). The creatine kinase-MB peak value correlated significantly with the clinical features of infarct extension. In contrast, the cytochrome c peak value correlated inversely with the myocardial blush grade. Patients with clinical signs of myocardial reperfusion injury had a significantly greater cytochrome c peak value than patients without reperfusion injury (median 1.65 ng/ml, interquartile range 1.20 to 2.20, vs 1.1 ng/ml, interquartile range 0.65 to 1.55; p = 0.04). In conclusion, serum cytochrome c is detectable in the early phase of STEMI treated with pPCI and is associated with clinical signs of impaired myocardial reperfusion.
Although different mechanisms of cell death have been observed in the failing heart (e.g., apoptosis, oncosis, autophagy, and necrosis), multiple observations have pointed toward a specific and predominant role of apoptosis in cardiomyocyte loss induced by reperfusion. At the cellular level, reperfusion has been demonstrated to be a potent inducer of apoptosis through the activation of the mitochondrial apoptotic pathway. Re-energization, pH recovery, and reactive oxygen species production occurring during reperfusion in the presence of abnormal cytosolic calcium concentrations induces mitochondrial swelling and release of mitochondrial apoptotic factors, including cytochrome c , into the cytosol, where they activate the apoptotic cascade. Therefore, on reperfusion, cytochrome c is released into the cytosol of infarcted cardiomyocytes, and it can reach the external fluid and circulating blood when cell rupture occurs. Thus, cytochrome c might represent a potential peripheral biomarker of myocardial reperfusion-associated apoptosis and pave the way for new potential therapeutic approaches to prevent or minimize myocardial reperfusion injury. In the present study, we investigated the serum levels of cytochrome c in patients with ST-segment elevation acute myocardial infarction (STEMI) undergoing primary percutaneous coronary intervention (pPCI), a clinical setting in which prolonged ischemia and abrupt reperfusion are critical features, and cardioprotective treatments to counteract reperfusion-induced injury are warranted. The aim of the present study was to determine whether cytochrome c is detectable in the serum of patients with STEMI undergoing myocardial reperfusion, and whether any correlation exists between its possible increase and clinical variables reflecting infarct size and/or impaired myocardial reperfusion.
Methods
The present prospective single-center study was conducted at the Centro Cardiologico Monzino, University of Milan (Milan, Italy). All consecutive patients presenting with STEMI and deemed suitable for pPCI from January 1, 2009 to August 30, 2009 were considered eligible for enrollment. The inclusion criteria were symptoms suggesting acute myocardial ischemia lasting >30 minutes, the onset of symptoms <12 hours previously, and ST-segment elevation of >0.1 mV in ≥2 leads on the electrocardiogram. The exclusion criteria were rescue PCI, major adverse events at admission (including cardiac arrest, ventricular fibrillation, and cardiogenic shock), severe co-morbidities, and the lack of informed consent. Patients in whom ST-segment changes were not quantifiable because of left bundle branch block, pacing, or ventricular pre-excitation were also excluded.
The ethics committee of our institute approved the study, and all patients gave their written consent to use a part of their blood samples for scientific purposes.
In all patients, blood samples for plasma creatine kinase-MB isoenzyme (CK-MB) and serum cytochrome c measurements were obtained from the peripheral venous blood at hospital presentation, every 6 hours for the next 36 hours, and then once daily until normalization of the CK-MB value.
To correlate the cytochrome c presence and value with myocardial reperfusion, angiographic and electrocardiographic parameters, usually used as clinical markers of coronary patency and myocardial reperfusion, were evaluated in all patients.
The left ventricular ejection fraction was measured soon after pPCI (early left ventricular ejection fraction) and 4 to 5 days later (predischarge left ventricular ejection fraction) using 2-dimensional echocardiography (Simpson method).
Pharmacologic treatment before pPCI included the administration of aspirin (a loading dose of 500 mg), heparin (5,000 IU), and clopidogrel (a loading dose of 300 to 600 mg). During primary pPCI, standard guide catheters (6F), guide wires, and balloon catheters were used by way of the femoral approach. Coronary stenting was performed, using bare metal stents, in all patients. The patients also received the glycoprotein IIb/IIIa inhibitor abciximab, with the dose determined by their body weight, unless contraindicated. The medications used after pPCI included aspirin, clopidogrel, nitrates, β blockers, angiotensin-converting enzyme inhibitors, and lipid-lowering agents, according to the current guidelines. During hospitalization, the medications were changed as needed at the discretion of the cardiologist responsible for the patient.
Angiographic analysis included coronary Thrombolysis In Myocardial Infarction (TIMI) flow grading before and after pPCI and the final myocardial blush grade (MBG). The TIMI flow grades were assessed as previously described. The MBGs were assigned, as previously described. Angiographic assessment was performed by 2 independent angiographers (PR, AB) who were unaware of the cytochrome c levels and electrocardiographic data. The interobserver agreement was very good (Cohen’s κ >0.9 for all parameters). Disagreements between the 2 readers were solved by consensus reached with subsequent joint evaluation of the angiographic findings.
All electrocardiographic measurements were done by 2 independent cardiologists (GM and MM), who were unaware of the angiographic and cytochrome c data. A 12-lead electrocardiogram was recorded before and 30 to 60 minutes after pPCI. The total ST-segment elevation from leads exploring the infarct was calculated on the pre- and postintervention electrocardiogram. The sum of ST-segment elevation was measured 20 ms after the end of the QRS complex. The ST-segment changes were calculated as the initial sum of the ST-segment elevation minus the sum of ST-segment elevation on the second electrocardiogram, divided by the initial sum of ST-segment elevation, and expressed as a percentage.
Inadequate myocardial reperfusion after successful reopening of the epicardial infarct-related artery (no-reflow phenomenon) was considered when the postprocedural TIMI flow was <3 or in the case of a TIMI flow grade of 3 when the MBG was 0 or 1 or when the ST-segment resolution after the procedure was <70%.
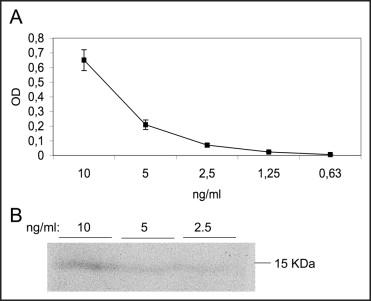
The CK-MB mass was measured using a 2-site immunoenzymatic (“sandwich”) chemiluminescent technique, with the UniCel DxI 800 (Beckman Coulter, Brea, California). Cytochrome c was detected in the serum using enzyme-linked immunosorbent assay and the Quantikine kit for human cytochrome c (R&D System Inc., Minneapolis, Minnesota). A linear response was revealed at 2 to 50 ng/ml. An example of the dose–response calibration curve obtained using purified human cytochrome c is reported in Figure 1 . The intra-assay variability of the assay gave a variation coefficient of 2.0% to 8.0% for the calibration curve within a concentration range of 1 to 50 ng/ml. The specificity of the enzyme-linked immunosorbent assay signal was confirmed by Western blot analysis of cytochrome c dilution ( Figure 1 ). The measurements of circulating cytochrome c were obtained by directly applying a 100-μl sample to the enzyme-linked immunosorbent assay plate without performing the cell lysis procedure. Next, the manufacturer’s instructions were followed.
Continuous variables are presented as the mean ± SD. Differences between patients with cytochrome c -positive and -negative values at hospital admission were assessed using the t test for independent samples. Variables not normally distributed are presented as the median and interquartile range and were compared using the Wilcoxon rank-sum test. Categorical data are presented as percentages and were compared using the chi-square test or Fisher’s exact test, as appropriate. The half-lives of the 2 biomarkers were compared within patients using the paired t test. To investigate the relations between the CK-MB and cytochrome c peak values and all major clinical variables, we computed Spearman’s correlation coefficients. In the case of dichotomous variables, we computed the point-biserial correlation coefficient, which should be interpreted as the usual Spearman correlation coefficient. The relations between the peak values of the 2 biomarkers, areas under the 2 curves, the point at which the 2 peaks were reached, and the half-life of the 2 biomarkers were assessed using Spearman’s correlation analysis. All tests were 2-tailed, and a p value of <0.05 was required for statistical significance. All calculations were computed using the Statistical Analysis Systems software package, version 9.13 (SAS Institute, Cary, North Carolina).
Results
A total of 55 patients were included in the present study, and in all of them, cytochrome c was detected during hospitalization. The baseline clinical and procedural characteristics of the study population are listed in Table 1 . At hospital presentation, cytochrome c was detectable in the blood of 34 patients (62%; median 1.15 ng/ml, interquartile range 0.76 to 1.58) and was not detectable in 21 patients. The demographic, clinical, and procedural characteristics of the 2 groups are listed in Table 1 .
| Variable | Cytochrome c | p Value ⁎ | ||
|---|---|---|---|---|
| All Patients (n = 55) | Positive (n = 34) | Negative (n = 21) | ||
| Age (years) | 65 ± 11 | 64 ± 9 | 67 ± 13 | 0.30 |
| Men | 82% | 82% | 81% | 0.89 |
| Body weight (kg) | 76 ± 10 | 78 ± 12 | 75 ± 9 | 0.32 |
| Diabetes mellitus | 14% | 15% | 14% | 1.00 † |
| Hypertension ‡ | 58% | 47% | 76% | 0.03 |
| Dyslipidemia § | 56% | 59% | 52% | 0.64 |
| Smokers | 47% | 44% | 52% | 0.55 |
| Previous myocardial infarction | 25% | 26% | 24% | 1.00 † |
| Previous coronary artery bypass graft | 9% | 9% | 10% | 1.00 † |
| Early left ventricular ejection fraction | 51 ± 12% | 52 ± 13% | 51 ± 10% | 0.76 |
| Anterior infarction | 47% | 50% | 43% | 0.60 |
| Interval to reperfusion (hours) | 2.5 (2.0–3.8) | 3.0 (2.0–4.4) | 2.0 (2.0–3.0) | 0.09 ¶ |
| Serum creatinine (mg/dl) | 1.1 (1.0–1.2) | 1.1 (0.9–1.2) | 1.1 (1.0–1.3) | 0.35 ¶ |
| Creatinine clearance (ml/min) | 76 ± 23 | 79 ± 22 | 70 ± 24 | 0.16 |
| Creatine kinase-MB at admission (ng/ml) | 5 (2.5–23.5) | 8 (0.1–112) | 4 (2–8) | 0.28 ¶ |
| Troponin I at admission (ng/ml) | 25 ± 46 | 21 ± 33 | 31 ± 62 | <0.001 |
| Number of diseased vessels | 0.67 † | |||
| 0 | 5% | 6% | 5% | |
| 1 | 45% | 41% | 52% | |
| 2 | 18% | 24% | 10% | |
| 3 | 31% | 29% | 33% | |
| Infarct-related coronary | 0.71 ⁎ | |||
| Left anterior descending | 49% | 53% | 43% | |
| Left circumflex | 24% | 24% | 24% | |
| Right | 25% | 21% | 33% | |
| Other | 2% | 3% | 0% | |
| Coronary stenting | 95% | 94% | 95% | 0.85 |
| Abciximab | 62% | 62% | 62% | 0.99 |
| Contrast volume (ml) | 265 ± 133 | 239 ± 111 | 309 ± 156 | 0.06 |
| Baseline Thrombolysis In Myocardial Infarction 0 flow | 60% | 47% | 81% | 0.013 |
| Final Thrombolysis In Myocardial Infarction 2–3 flow | 91% | 88% | 95% | 0.38 |
| Final myocardial blush grade | 1.92 ± 1.1 | 1.97 ± 1.1 | 1.86 ± 1.1 | 0.72 |
Stay updated, free articles. Join our Telegram channel

Full access? Get Clinical Tree


