Cineangiographic Imaging, Radiation Safety, and Contrast Agents
Cineangiographic Imaging, Radiation Safety, and Contrast Agents
Stephen Balter
Mauro Moscucci
Interventional cardiologists must have a sufficient working knowledge of radiation safety, the science of x-ray imaging, and the technology of fluoroscopic equipment. All of the major US cardiology societies (ACC, AHA, HRS, SCAI) have published relevant clinical competency statements, guidelines, and educational materials.1, 2, 3, 4, 5, 6, 7, 8, 9 This body of knowledge defines the minimal acceptable knowledge base for which interventional cardiologists and electrophysiologists are accountable. Radiation competence is included in the examination for a Certificate of Additional Qualification in Interventional Cardiology. This expectancy is reinforced both by institutional privileging standards and by regulatory requirements.
Patient safety is more than a theoretical concern because fluoroscopic radiation injuries ranging from inconsequential to devastating continue to occur.10, 11, 12, 13, 14, 15, 16, 17, 18, 19, 20, 21, 22 Necessary images need to be obtained while protecting both patients and staff from unnecessary radiation. It is essential to include radiation usage statistics and case reviews in the laboratory’s formal quality process. In simplest terms, radiation should be used and monitored in the same manner as contrast-agents or drugs.
This chapter includes brief reviews of basic x-ray physics, radiation biology, patient radiation management, staff radiation safety, and iodinated contrast agents. These materials are current as of the time of writing but will certainly evolve over time. Those seeking more detailed information can start with existing publications, recommendations, and textbooks1,6, 7, 8, 9,23, 24, 25, 26 and use these as a springboard to the evolving literature.
BASIC X-RAY PHYSICS
X-rays are a form of electromagnetic radiation similar to visible light and radio waves. The x-ray beam is often described as a stream of photons (i.e., discrete packets of electromagnetic radiation, each containing a defined amount of energy). Each x-ray photon contains thousands of times the energy of a photon of visible light. This explains why different and more potent biologic effects occur when an x-ray photon is absorbed by or scattered from living tissue.
X-rays are predominantly produced when high-energy electrons are decelerated by interaction with a metallic target (in our case tungsten). This is called bremsstrahlung (breaking radiation).The resulting x-ray beam contains a spectrum of photon energies ranging from approximately 20 KeV up to the maximum voltage applied to the x-ray tube. Characteristic x-rays are also produced when the incoming electrons interact with the orbital electrons of the target’s atoms. The x-ray spectrum emitted toward the patient is modified by filters placed between the x-ray tube and the patient. The shape of the x-ray spectrum strongly affects both image contrast and patient dose. Too “soft” a spectrum needlessly increases patient dose; too hard a spectrum decreases image contrast.
This chapter uses those radiation quantities and units needed to describe the use of x-rays in the interventional laboratory (Table 2.1). These derive from the SI system of measurement (Système international d’unités), their use in the publications of the International Commission on Radiological Units (ICRU),27 the International Commission on Radiological Protection (ICRP),28 the International Atomic Energy Agency (IAEA),29,30 and the US National Commission on Radiological Protection and Measurements (NCRP)7,31. Table 2.1 also includes key conversion factors between current SI units and related older units.
Table 2.1 Clinically Important Dosimetric Definitions
Quantity
Description
SI Unit
Related Units
ExposureKair
The radiation present at a point in space. It is currently described as air kerma (kinetic energy released in matter) in units of gray. At fluoroscopic energies, air kerma is the dose delivered to air. By itself, exposure gives no information regarding how much radiation energy is delivered to tissue or the biologic effects that that irradiation might have.
gray (Gy) In air
Roentgen (R) 100 R = 0.87 Gy (air)
DoseDmaterial
The local concentration of energy absorbed by a small volume of a specified material (e.g. air) or specified tissue (e.g. myocardium) from the x-ray beam.Tissue dose is usually stated in units of gray (1 Gy = 1 joule/kilogram) or milligray (mGy).The dose delivered to different portions of a patient from an initially uniform x-ray beam is always nonuniform because of x-ray beam size limits, x-ray absorption, and x-ray scatter. It is incorrect to describe the physical dose distribution in a patent or staff member using a single number. 1 Gy (specific substance) = 1 joule (absorbed)/kg (specific substance)
gray (Gy) In soft tissue or another specified material
RAD
100 RAD = 1 Gy
Peak Skin Dose PSD
The highest dose received by any portion of the patient’s skin from a procedure. Presently, there is no commercially available technology to map skin dose distribution while a procedure is in progress. However, real-time skin mapping is anticipated in the near future. Several film-based technologies are available to produce a skin dose map after the patient has been removed from the table.
gray (Gy) Includes backscatter from patient
Effective Dose (E)
A calculated quantity that was introduced by the ICRP for managing stochastic radiation risks experienced by large populations.This usage has also been adopted by the NCRP. The calculation includes a complex convolution of radiation type and organ sensitivity in a hypothetical standard person. Effective dose is not intended to characterize the radiation risk experienced by any individual. Its use for such purposes is specifically rejected by both the ICRP and NCRR Effective dose is a useful metric for generally comparing different types of procedures or different protocols. ED (Sv) = I [Dose to a volume of tissue (Gy)] X Radiosensitivity of that tissue
sievert (Sv)
100 REM = 1 Sv
Air Kerma Area Product PKA, KAP
A measure of the total x-ray energy in a beam. In simple terms, it is the product of the dose measured at a point in the center of the beam and the cross sectional area of the beam at that point. Following this definition, dose area product (DAP) is usually stated in units of Gy cm2. PKA has the same value anywhere between the x-ray tube and the patient’s entrance surface. DAP and anatomical information can be combined to estimate effective dose using conversion factors derived from Monte-Carlo simulations. PKA is the best dose metric for estimating patient stochastic risk and the amount of scatter in the procedure room.
The total air kerma accumulated at an internationally defined reference point during a procedure. For an isocentric fluoroscope, the reference point is located 15 cm from the isocenter along a line from the isocenter to the x-ray tube’s focal spot.This point approximates the skin location for a nonmoving beam. Ka,r is the best currently available dose metric for managing the possibility of skin injury.
This is not a useful dose metric because fluoroscopic time does not reflect patient size, beam orientation, or the use of cine.The use of fluoroscopic time as a dose metric or equipment that can only display fluoroscopic time for interventional procedures is strongly discouraged.
Clinical radiation dose measurements in the interventional fluoroscopic laboratory are used as practical indicators of patient risk. Clinical concerns include patient skin injury as well as patient and staff cancer risk. Available measurements furnish sufficient real-time information so that the operator can include radiation use in ongoing benefit-risk assessment as a procedure progresses.
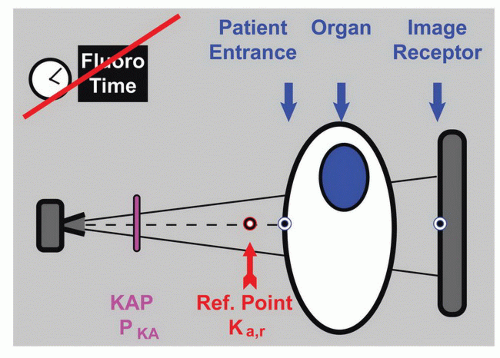
Radiation can be measured in many ways and at many locations (Figure 2.1). Of these, the image-receptor entrance point is best for assessing image noise and the patient entrance point is best for assessing the risk of skin injury. Imagereceptor measurements are available from many current fluoroscopes. Real-time patient-entrance measurements are not currently commercially available. The reference point air kerma (Ka,r) is an available reasonable surrogate for predicting skin damage. Cancer risk is related to the dose received by each of the organs in the body and its radiosensitivity. Organ dose is not directly measurable. However, kerma area product (PKA) can be used to estimate cancer risk. Fluoroscopy time, although available, provides an extremely imprecise indicator of either risk. Because of this limitation, potentially high radiation dose procedures should not be done using equipment that can only display fluoroscopic time.7
Figure 2.1 Important radiation measurement points. The best estimates of radiogenic risk can be made when the tissue dose distribution on the patient’s skin and the dose delivered to each internal organ are known. Present technology provides measurement and in-lab display of the total dose at a defined reference point (Ka,r as well as the total kerma area product (PKA) from the procedure). Ka,r and PKA are practical real-time measurements for assessing skin injury and late cancer risk respectively. Fluoroscopy time does not provide an accurate assessment of either. Although fluoro time is widely available, it has an uncertainty of at least a factor of 10 when used to estimate either Ka,r or PKA.
Measuring and tracking radiation during a fluoroscopic procedure provides critical safety information to the operator. Interventional fluoroscopes conforming to the International Electrotechnical Commissions 60601-2-43 standard32 incorporate mandatory instrumentation to monitor Ka,rPKA, and fluoro time. All fluoroscopes sold in the United States since 2006 must at a minimum incorporate displays of Ka,r and fluoro time.33 According to both standards, all available data must be displayed at the operator’s working position as well as on the fluoroscope’s control panel. The Joint Commission (JC) considers a skin dose of 15 Gy to be a reportable sentinel event.34 Facilities should be able to demonstrate their ability to detect such an occurrence during a JC survey.
IMAGE FORMATION
Image Contrast
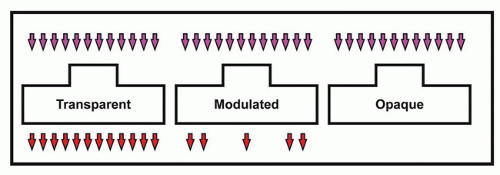
An x-ray beam that totally passes through a patient or is totally absorbed by the patient carries no clinical information (Figure 2.2). Images are formed when different structures in the body absorb different amounts of radiation from the beam. The x-ray beam leaving the patient is modulated by differential absorption. It is detected and converted into a useful image by an image receptor. A structure in the patient can only be seen if its detected signal is sufficiently different from the surrounding structures. The visibility of the primary signal is degraded by scattered radiation and obscured by image noise.
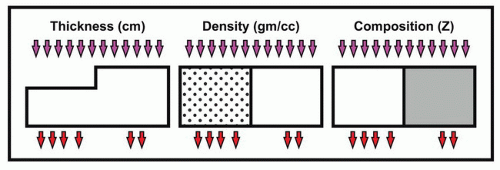
The primary signal is produced by differences in x-ray absorption attributable to differences in thickness, physical density (gm/cc), or atomic number (Z) between the target and its surrounds (Figure 2.3). Natural differences between structures are enhanced by the use of a contrast agent. These materials have markedly different x-ray absorption than the unenhanced target or its background. Contrast media is either mechanically delivered or biologically concentrated in the target. The contrast agents used in the catheterization laboratory (cath lab) usually contain iodine (atomic number 53). The K-shell absorption edge of iodine is 31 KeV It is a strong absorber of x-ray photons in the range from 31 to 70 KeV This property allows visualization of small vessels when the iodinated contrast agent displaces blood during angiography. The pharmacological effects of contrast agents are discussed later in this chapter.
Figure 2.2 Differential x-ray absorption is needed to form an image. Total transmission of the x-ray beam produces a uniform signal. Total attenuation produces a silhouette. Image formation requires absorption of a portion of the x-ray beam by the patient.
Figure 2.3 Factors influencing x-ray absorption and beam modulation. Tissue thickness, physical density, and atomic composition all contribute to x-ray attenuation. A difference in one or more of these factors creates the primary beam modulation needed to produce an x-ray image.
The word “contrast” has several overlapping meanings in the context of interventional fluoroscopy. Subject contrast describes the modulation of the incident x-ray spectrum by the patient’s tissues and injected contrast agents. Display contrast describes the intensity range in the modulated x-ray beam between black and white on the monitor. Radiographic contrast includes both of these factors. An observer needs appropriate radiographic contrast to see clinical structures. Increasing subject contrast by adjusting the x-ray factors often increases patient dose.
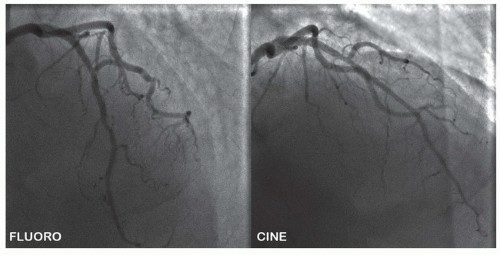
Figure 2.4 Image receptor dose per frame and system settings affect image appearance. The image on the left is a frame from a stored fluoroscopic run. The image on the right is a cine frame. These images were acquired a few seconds apart. The increased noise in the LIH results from less dose used in its production. The increased contrast seen in the cine image results from system programming to a lower kVp, different beam filtration, and different image processing parameters.
X-ray production is automatically controlled by most fluoroscopes by changing factors including the voltage applied across the x-ray tube and beam filtration. For long tissue paths (due to patient size and/or beam angulation), the x-ray spectrum is displaced above the photon energy range that produces optimum visibility of iodine or steel (e.g., stents or guidewires). This produces less beam modulation and is one of the reasons why the visibility of contrast media and devices vary from view to view and from patient to patient.
Image Noise
The radiographic image of a totally uniform object has random variations in brightness from point to point and over time. These random fluctuations are called image noise. Noise reduces the ability to detect low-contrast structures. Image noise includes an avoidable component attributable to the imaging system itself (structural noise) and a second component unavoidably attributable to the physics of the x-ray beam (quantum mottle). There is a minimum of structural noise in a well-constructed and well-maintained imaging system. Quantum mottle is caused by the statistical photon nature of the x-ray beam. Fewer detected x-ray photons results in a noisier image (Figure 2.4). A higher dose image such as a single cine frame is produced using about 10 times more x-ray photons than a corresponding low-dose single fluoroscopic frame. The desire for low-noise imaging must always be balanced against its cost of increased patient exposure. Cardiologists will substantially decrease patient (and their own) dose if they can perform procedures using noisier fluoroscopic and cine images. Increasing display contrast will increase the observer’s perception of noise.
Image Sharpness
The primary sharpness of an object in a fluoro image is affected by interactions between (a) the size of the x-ray tube’s focal spot; (b) the position of the object between the x-ray tube and the image receptor; (c) the object’s motion; (d) the spatial resolution properties of the image receptor. Visual sharpness is also influenced by several of the image-processing methods discussed in a later section.
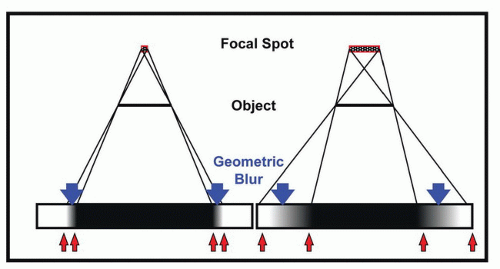
The nominal x-ray tube focal spot ranges from 0.3 × 0.3 mm to over 1.0 × 1.0 mm. Larger focal spots are needed for high-power imaging. The effect of focal spot size is determined by the location of the target relative to the gantry (geometric magnification) with greater loss of sharpness in the x-ray image from large focal spots at high geometric magnification. This is called geometric unsharpness or blur (Figure 2.5). Geometric magnification increases target sharpness if primary sharpness is limited by the image receptor. As discussed below, zooming an image intensifier increases its resolution and increases overall primary sharpness. However, the intrinsic resolution of most flat-panel detectors (FPDs) is not changed by zooming.
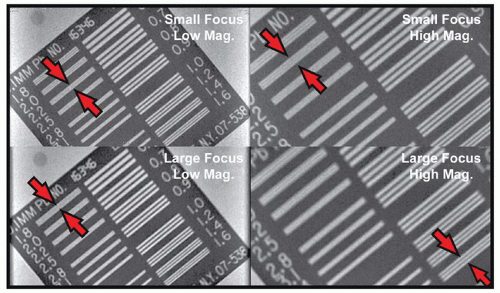
Large focal spots are commonly used in cine to handle the power needed to quickly produce a high-dose image. Figure 2.6 demonstrates the effects of focal spot size and magnification for a stationary test pattern. Coronary arteries are moving targets. Shorter x-ray pulses result in less movement blur than longer pulses. If a small focus is used to reduce geometric blur, the pulse width may be prolonged to avoid melting the x-ray target. This increases movement blur (Figure 2.7). Some fluoroscopes automatically switch the focal spot based on patient size and beam geometry. The resulting run-to-run changes in vessel sharpness might be clinically confusing if this is not known.
Figure 2.5 Geometric blur. The combination of finite focal spot size and the position of the object relative to the focal spot causes geometric blur. Increasing focal spot size (shown) and increasing magnification (not shown) increase the unsharpness at the edge of the object’s projected image.
Scattered Radiation
Scattered radiation is produced when the x-ray beam interacts with the patient or other objects and is redirected rather than absorbed completely. When scattered radiation reaches the image receptor, it reduces contrast by reducing primary beam modulation. Scattered radiation is the principal source of exposure of the patient’s body parts outside of the direct beam. It is also the primary source of exposure of laboratory staff. The amount of scatter is proportional to the intensity of the x-ray beam and the size of the x-ray field (i.e., proportional to PKA).
Figure 2.6 The influence of geometric blur on image sharpness. Using a small focal spot and low geometric magnification maximizes the visibility of the bars in this high-subject-contrast test pattern. The arrow pairs indicate the limiting resolution. The effects of increasing the focal spot size are seen in the lower left image, increasing geometric magnification in the upper right image, and increasing both in the lower right image.
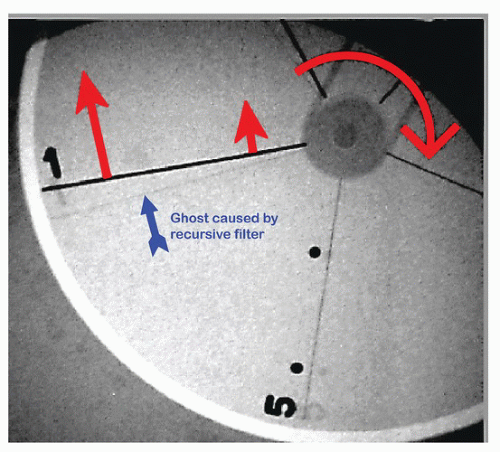
Figure 2.7 Motion blur. The test object is a rotating disk with imbedded wires of different diameters. The linear speed of motion increases with distance from the axis. The large arrow corresponds to a linear speed of 200 mm/s (e.g. RCA at systole). The increase in linear motion with distance along the wire results in increasing motion blur toward the periphery of the disk. The “ghost” images were produced by recursive filtering (discussed later in the chapter).
OPTIMIZING PATIENT EXPOSURE AND IMAGE QUALITY
Producing an x-ray image involves balancing many factors including image contrast (needed to detect an object), spatial and temporal sharpness (needed to characterize the object), image noise, and patient exposure. Improving performance in any of these areas usually degrades performance in one or more of the other areas. For example, fluoroscopic image noise can be reduced by either increasing the fluoroscopic dose rate or by integrating multiple fluoroscopic frames. All else being equal, an increased dose rate produces a corresponding increase in patient exposure. Integrating many frames will blur moving objects and thereby reduce their visibility. Increasing x-ray tube voltage to image through long tissue path lengths changes the x-ray spectrum and thus the visibility of iodine-filled blood vessels or guidewires. Decreasing the image receptor input dose rate reduces patient exposure but increases image noise.
Most modern fluoroscopes contain a large set of preprogrammed technique sets intended to provide an optimal balance between patient size, image quality, and patient exposure for a large number of different imaging tasks. Programming also includes image-processing and display parameters that further affect image appearance. Dozens to hundreds of these sets are initially installed when the fluoroscope is manufactured. They are often modified to meet local requirements during the installation process. In some cases, hospitals have the capability to make further persistent changes to these sets. Most fluoroscopes provide controls to modify sets for a single procedure or run. Selecting an inappropriate set, or inappropriately modifying a set, may substantially degrade image quality, increase patient dose, or both. Routinely used technique sets should be reviewed and approved by the laboratory director. The configuration of technique sets is a clinical decision that will profoundly affect all of the patients examined using that set.
THE CINEFLUOROGRAPHIC SYSTEM
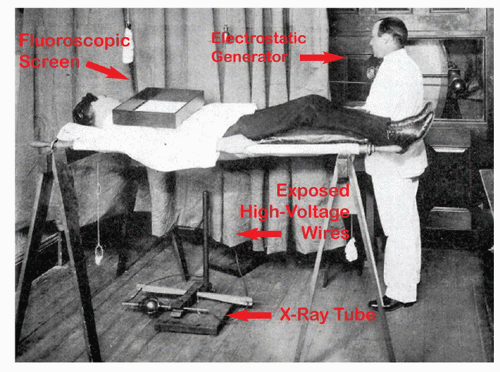
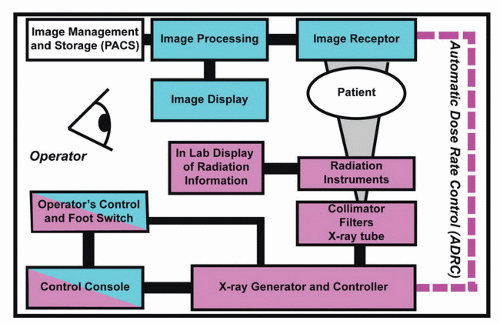
Chest fluoroscopy has evolved since its beginnings in the 19th century41 (Figure 2.8). The purpose of an x-ray cinefluorographic system is to produce fluoroscopic and fluorographic optimized images of relevant anatomy at minimum patient exposure.8,35 The technical means to do this include the production of a collimated x-ray beam of appropriate quality and intensity, projection of that beam through the patient at the required angle, detection of the modulated x-ray beam after it passes through the patient, processing and storing the resultant images, and last but not least, displaying these images to the operator. The principle components needed for these tasks are illustrated in Figure 2.9.
Fluoroscopically guided interventional procedures are clinically demanding and potentially dangerous. The International Electrotechnical Commission (IEC) maintains a safety standard with minimum requirements for interventional fluoroscopes. Major fluoroscopic procedures should only be performed on well-maintained equipment that is purchased as IEC-60601-2-43 compliant7,32 and maintained at that level of safety. Equipment quality assurance is discussed later in this chapter.
Radiation Production and Control Generators
The cinefluorographic x-ray generator delivers controlled amounts of electrical power to the x-ray tube.36 One circuit selects the appropriate x-ray tube filament and heats that filament to produce an electron beam at a current ranging between 1 and 1,000 milliamperes (mA). A second circuit supplies a voltage ranging from 50 to 125 kilovolts peak (kVp) to accelerate the electrons toward the anode of the x-ray tube. X-rays are usually produced as a series of pulses. This is accomplished by electrically switching the electron beam on and off to produce the pulses.
Figure 2.8 Chest fluoroscopy at Boston City Hospital c 1898. This photo41 was taken within 3 years of Roentgen’s first report on x-rays. The x-ray tube on the floor and the fluoroscopic screen on the patient were used to minimize patient dose. To obtain any image visibility, fluoroscopic rooms were always very dark when fluoroscopic screens were used. The x-ray tube is connected to the electrostatic generator by exposed high-voltage tubes.
X-ray generators use large amounts of power, particularly when producing cine. Interventional fluoroscopes are usually connected to hospital emergency power and to uninterruptable power supplies (UPS). Backup power may be limited. The interventionist needs to be aware of what time and operating mode restrictions are imposed when the system is operated on emergency power (the system may have a limited available fluoroscopic time until backup energy is exhausted; cine may not be available at all.). It is not advisable to perform nonemergency cases using backup power unless this has been cleared in advance by the hospital’s technical staff.
Figure 2.9 Block diagram of a medical fluoroscope. Fluoroscopic systems consist of components needed to produce x-rays, detect the modulated beam passing through the patient, process and display images to the operator, and store images for later use. The automatic dose rate control system (ADRC) stabilizes the image-receptor signal against changes in path length in the patient. The operator can profoundly influence both patient irradiation and image appearance by changing examination sets or irradiation mode.
X-Ray Tubes
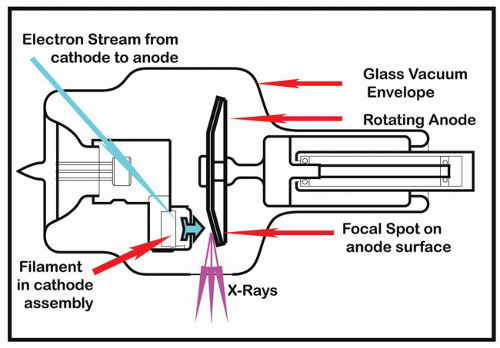
The x-ray tube is a device that converts electrical energy into x-rays. It consists of an evacuated glass or metal housing. Its key components are one or more tungsten filaments (housed in a focusing cup) and an anode disk (tungsten alloy, 100 to 200 mm in diameter), which rotates at more than 10,000 rpm (Figure 2.10 illustrates a medium power tube). Electrons are emitted from the selected filament by thermionic emission. The number of emitted electrons, and thereby the tube current (mA), is controlled by adjusting the filament temperature. These electrons are accelerated toward the anode by the electric field (50-125 kV) supplied by the generator. X-rays are produced when the electrons hit the anode.
Because of basic physical principles, less than 1% of the electrical energy applied to the tube is converted into x-rays. The remainder is deposited in the anode as heat. Too much heat delivered in too short a time will melt the focal track or the entire anode. Present tube designs include active anode cooling. Twenty years ago, tube overload often limited procedures and thereby patient dose. Today this is seldom the case. A tube heat warning occurring during a procedure is a secondary clinical indicator that substantial amounts of radiation may have been delivered to a patient.
For sharpest imaging, the point of impact of the electron beam on the anode should be as small as possible, so that x-ray emission appears to come from a single “point” focal spot. The actual size of the focal spot represents a balance between the requirements for sharp imaging and the need to avoid melting the target. X-ray tubes have two filaments and hence two focal spots. The smaller (typically 0.3-0.5 mm) is used for fluoroscopy. The larger focal spot (typically 0.8-1.0 mm) accommodates the higher power requirements of adult cine. The thermal capability of the target is increased by rotating the anode; this spreads the heating over a long focal track instead of concentrating it on a small point.
Figure 2.10 Medium power rotating anode x-ray tube. See text for discussion.
Spatial and Spectral Shaping of the X-Ray Beam
The x-ray beam contains a spectrum of photon energies. These range from the maximum determined by the peak voltage supplied by the generator (kVp) to a lower energy determined by the filters in the beam. Images are mainly formed by photons of intermediate energies. Higher energy photons strongly penetrate both tissue and iodine; this reduces contrast. Low-energy x-ray photons are easily absorbed by the patient’s tissues; they contribute to risk but not to image formation. Regulations require permanent placement of a minimum thickness of aluminum filter in the beam to absorb these nonproductive photons from the beam before they enter the patient.
Many modern fluoroscopes offer various thicknesses of copper or similar atomic-number element filters in addition to the mandatory aluminum filter. These are used in conjunction with high-powered x-ray tubes and specific generator programming to concentrate more of the x-ray beam just above the K absorption edge of iodine. In some systems, filter selection is determined by the selected operating mode. In other systems, the filter is dynamically selected by the system’s automatic dose-rate control, with thinner filters typically used for longer tissue paths.37 The appropriate use of spectral filtration increases the visibility of contrast media and guidewires while simultaneously reducing patient exposure. The availability and use of spectral shaping has been a major contributor to dose-rate reduction over the past two decades.
The extent of the x-ray beam is spatially limited so that at a maximum it is confined to the active field of view (FOV) seen by the operator. Although current regulations permit a slightly oversized field, most systems can be permanently adjusted to confine the maximum field within the FOV Setting systems to achieve a small unilluminated margin on all four sides is strongly recommended. Loss of beam alignment is easily seen if this is done.
The size of the x-ray beam can always be reduced by the use of the collimator control. Actively confining the beam to the area of immediate clinical interest as a procedure progresses reduces both patient and staff irradiation while simultaneously improving image contrast (by limiting scatter).
Many systems also have movable semitransparent copper shutters (also called wedge filters) that can be positioned over the lung fields up to the heart border in each projection. These improve the visibility of vessels and devices as well as overall image quality by reducing excessive image brightness in the lung fields.
Imaging Modes
Dedicated cardiac fluoroscopes have two principal modes of operation: Fluoroscopy (Fluoro) and Cinefluorographic Acquisition (Cine). Multipurpose units have an additional Digital Subtraction Acquisition (DSA) mode. One of the ways that these modes differ from each other is that a single cine frame delivers about as much dose to the patient as 10 fluoro frames; a single DSA frame delivers as much as 10 cine frames (100 fluoro frames). Figure 2.4 illustrates the differences in image appearance between fluoro and cine.
In the 1990s, systems had separate imaging channels for Fluoro, Cine, and DSA. As of this edition, most systems use the same digital imaging channel for all modes. System settings determine the irradiation and imaging parameters used for any particular run. Many systems now exploit this common imaging channel to provide retrospectively stored fluoroscopy. This “mode” allows the last 10-30 seconds of fluoroscopy to be stored as if it was a cine run. No additional radiation is needed for this purpose. Whenever possible, the use of retrospectively stored fluoro instead of cine (e.g., documenting balloon inflation during an angioplasty) can significantly reduce patient and staff exposure.
Current systems also provide digital gap-fill between individual fluoro and cine frames. Images presented to an observer above the critical flicker frequency appear continuous. Acquired images are therefore shown multiple times before being refreshed to avoid flicker. This facility is routinely provided by all digital image monitors (including desktop computers). Gap-fill is also applied when reviewing stored images (from PACS or a CD).
Fluoroscopy
Fluoroscopy provides a real-time x-ray image with adequate quality for observing motion and guiding device manipulations. The single fluoroscopic frame seen using Last Image Hold (LIH) (Figure 2.4) was produced using a low dose and therefore contains a great deal of noise (quantum mottle). Live fluoroscopy (or the replay of stored fluoroscopic runs) appears less noisy due to the integration of images over a few hundred milliseconds. The visibility of noise can be further reduced by the use of recursive filters in the image processor. However, physiological or digital averaging will blur the appearance of moving objects and may produce artifacts such as the doubling of the right coronary artery (RCA) at systole. The “ghost” wires seen in Figure 2.7 were produced by recursive filtering.
Current fluoroscopic systems have two or more operatorselectable fluoroscopic dose rates and often several operatorselectable frame rates. A higher dose rate provides less image noise at the expense of greater patient and operator exposure. In the United States, the regulatory maximum table-top fluoroscopic dose rate is an air kerma rate of 88 mGy/min when measured under FDA-specified conditions.33 Many systems have a low dose rate mode capped at 44 mGy/min. Some systems have a special fluoroscopic mode that can be used up to 176 mGy/min (such modes are required to produce an audible alert when they are active). The actual patient entrance dose rate varies from moment to moment. It is a function of the selected operating mode of the fluoroscope, system programming, tissue path length, focal spot to skin distance, and focal spot to image receptor distance. For most fluoroscopes, the maximum legal patient entrance air kerma rate can be at least twice that observed under FDA testing conditions.
At present, the most common US frame rate in adult coronary angiography is 15 frames per second (many European operators work at somewhat lower frame rates). Decreasing frame rate saves dose at the expense of visual smoothness of the transition between frames. The required dose rate scales against the square-root of the frame rate for equal visual perception of noise.38
Acquisition (Cine)
Cine requires images of sufficient quality for single-frame viewing. Higher x-ray input dose rates are therefore needed to reduce noise and optimize clinical visualization. Most systems are calibrated such that a single “normal dose” cine frame is generated at approximately 10 times the dose needed to generate a single fluoroscopic frame. It is therefore worthwhile to remember that a minute of cine is essentially equivalent to 10 minutes of fluoroscopy.
Many current systems also provide a choice of cine dose rates. Experience has shown that the cine image quality needed for critical diagnostic studies may be excessive for some diagnostic studies and for many interventional procedures. Low dose-rate cine should be used whenever it does not reduce the clinical value of the images. Routine use of low dose-rate cine will reduce overall patient and staff dose exposure by 10% to 25%.
Because each cine frame contains sufficient information to be read by itself, eye integration cannot be relied on to reduce dose. Therefore, the cine dose rate is directly proportional to the cine frame rate.
Digital Subtraction Angiography (DSA)
The DSA process begins with the acquisition of a series of images of the same anatomical area. Typically, contrast media is injected during this acquisition. The first image in the series is usually used as a mask. The mask is digitally subtracted from the remaining images in the series. The remainder shows the difference between the mask and the target image (usually a faint image of contrast plus artifacts due to motion). Display contrast is increased to improve visibility. Quantum noise is not removed by the subtraction process because it is random. Thus, all of the images in the original series must be acquired at high dose to reduce their noise content. As noted above the dose needed for a single DSA frame is approximately 10 times higher than that needed for a cine frame. Because of the high dose per frame, DSA images should be acquired at the lowest clinically usable frame rate and for the shortest possible time.
Automatic Dose Rate Control (ADRC)
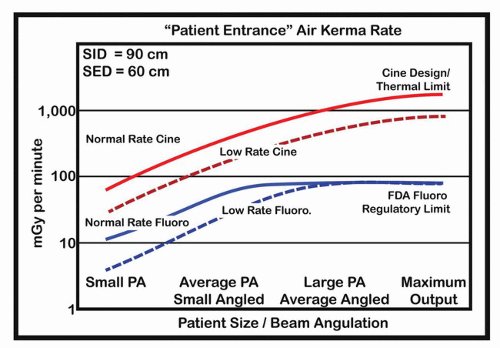
The x-ray beam is attenuated as it passes through tissue. The degree of attenuation varies with the beam’s path length in tissue (patient size and beam angulation), the nature of the tissue, and x-ray generation factors. Attenuation affects the radiation dose at the image receptor. The radiation level at the image receptor is also geometrically influenced by the source to image receptor distance. Fluoroscopic systems use ADRC to monitor the dose at the image receptor and automatically adjust x-ray production to produce the requisite receptor level. The normal function of this circuit has a profound influence on patient skin dose. X-ray intensity is increased if the detector measures too dim a signal and decreased if it measures too bright a signal. This means that the patient’s entrance port skin dose increases substantially for heavy patients and when compound projection angles are used. Increasing the tissue path length from 10 to 40 cm will increase patient’s skin dose rate by more than a factor of 10 for fluoroscopy and more than a factor of 100 for cine (Figure 2.11).
ADRC’s primary goal is to maintain the programmed image receptor dose rate irrespective of patient size. Competing goals include optimizing the visibility of iodinated contrast as well as minimizing patient irradiation. The wide variety of ADRC algorithms available to the user on most modern systems provide different trade-offs between these goals.
The ADRC can control the tube voltage (kV), tube current (mA), pulse width (expressed in milliseconds), and beam filtration.37 It may also influence the image processor. An improper setting can lead to suboptimum images. Different makes and models of fluoroscopes will often have different ADRC strategies. In addition, most machines offer different ADRC modes of operation. Thus, system response might be very different when the same fluoroscope is in coronary or electrophysiology (EP) mode. As a second example, when the system is set to cine coronary arteries, the ADRC remains functional throughout the entire cine run. When the same system is set to left ventricular (LV) lock, the ADRC establishes a level early in the run and then maintains that level during the contrast injection phase of the ventriculogram. Quantitative calculations can be distorted if the quantitative coronary angiography (QCA) algorithm is not aware of the details of the ADRC control strategy.
Figure 2.11 Automatic dose rate control (ADRC). Illustration of the range of patient entrance air kerma rates a function of path length in the patient. Angled beams in small patients can have a path length exceeding the PA dimension of average or large patients. This example is of a system with two fluoroscopic and two cine dose rate modes. Fluoroscopy is limited by FDA and state regulations. Maximum cine rates are limited by engineering design considerations. In this example, the two fluoro modes reach the limit for different size patients. The two cine modes always differ by a factor of two.
In most fluoroscopes, responding to increased tissue path length requires an increase in the kVp. This moves the x-ray spectrum away from the region of maximum iodine absorption. The primary x-ray contrast is further reduced because the same opaque vessel produces less modulation against a long tissue path than in a short path. In addition, more scattered radiation is generated in long-path situations. Some of this scatter reaches the image receptor and further degrades the visibility of vessels and devices by reducing both net beam modulation and the signal-to-noise ratio of the entire image.
CLINICAL PROGRAMS AND PROGRAMMING
Most if not all interventional fluoroscopes are configured to perform a specific type of procedure (e.g., coronary angiography; EP mapping) by selecting a preprogrammed examination set. A multipurpose laboratory offers many dozens of such sets. Each set transforms the fluoroscope into a highly specialized imaging tool by configuring its x-ray acquisition and image display properties. An incorrect selection can result in excessive radiation use, substandard images, and other inconveniences. For example, using the low dose and frame rate EP configuration for performing PCI will seldom be successful. Conversely using the angiographic settings for EP mapping will produce very high quality images at the cost of unnecessary irradiation of patients and staff.
Users have the ability to modify some parts of the configuration (e.g., frame rate or dose rate) while the procedure is in progress. Using these controls can be advantageous if it does not distract from patient care.
IMAGE DETECTION, PROCESSING, AND RECORDING
The x-ray image formed by the interaction of the x-ray beam and the patient must be detected and transformed into a usable format.39,40 The fluoroscopic screen was the original x-ray detector used by Roentgen. It was the only fluoroscopic detector available from the discovery of x-rays in 189541 until the development of the x-ray image intensifier in the 1950s. The image intensifier was the enabling technology for coronary angiography because it provided enough light to expose cine film.42,43 In the last 10 years, the image intensifier itself has been substantially replaced by solid-state detectors44 (commonly called flat-panel detectors (FPDs)).
IMAGE INTENSIFIER
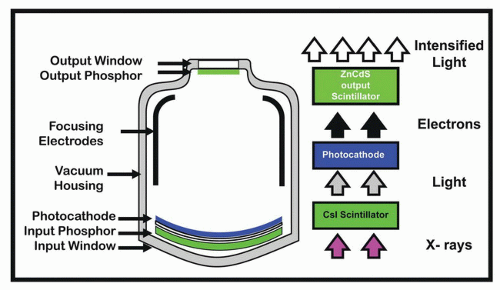
The structure of a single-mode image intensifier is shown in Figure 2.12. The modulated x-ray beam emerging from the patient enters the image intensifier and is detected and converted to visible light by a cesium iodide (CsI) fluorescent layer. This visible light image is converted into an electron image by a photocathode. Focusing electrodes in the tube accelerate and minify the electrons onto a small output screen. The output screen converts the electron image back into a smaller and brighter visible light image The combination of acceleration of the electrons and minifying of the output image relative to the input image size produces enough brightness gain to be viewed by the light-adapted eye, expose cine film, or to activate a video camera.
Image intensifiers offer several magnification modes. When a specific magnification is selected, the electronics focuses a larger or smaller portion of the input screen onto the fixed-size output screen. The minifying gain of the tube (ratio of selected input screen area to fixed output screen area) decreases as the tube is zoomed. Therefore, smaller FOVs require higher input dose rates than do larger FOVs. Vascular image intensifiers remain available with FOVs exceeding 40 cm. These devices require substantially higher dose rates than cardiac image intensifiers when they are used at the typical 17 cm cardiac FOV In addition, the larger bulk of vascular tubes limits beam angulation. Moving the image intensifier away from the patient to obtain the necessary angles further increases patient dose rate.
Figure 2.12 X-ray image intensifier. See text for discussion.
The resolution of an image intensifier tube is limited by the characteristics of its output screen. In most cases, decreasing FOV (increasing zoom) increases the spatial resolution of the image intensifier tube. The downside is the additional radiation needed for small FOVs. Patient dose can be minimized by working at the largest FOV consistent with seeing clinically relevant structures. Visibility can sometimes be improved in heavy patients by increasing the FOV and collimating the beam to the region of interest. This maneuver relies on the greater gain of the larger FOV and scatter reduction due to collimation.
Image intensifiers degrade over time. Routine service adjustments can compensate for these losses for about 5 to 10 years. Eventually the end of the adjustment range is reached and additional radiation is needed to supply adequate brightness.
No film-based cine systems are currently being produced and few older systems remain in service.9 Interested readers are referred to the older literature8,40,45, 46, 47 for descriptions of cine cameras, analog video, and the associated optics. Almost all current image-intensifier systems use a digital CCD video camera to handle both fluoroscopy and cine. An optical diaphragm provides compensation for image intensifier degradation. More importantly, adjusting the diaphragm’s aperture provides constant brightness to the CCD while allowing different dose rates for fluoro and cine.
FLAT-PANEL X-RAY DETECTORS
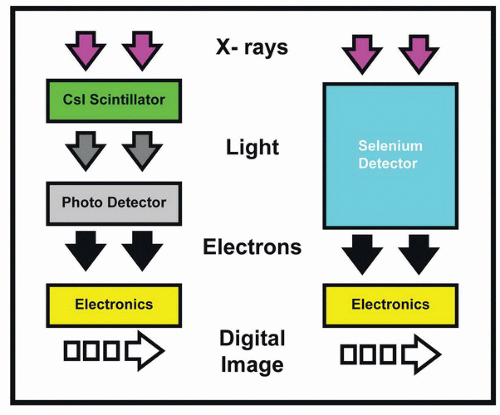
Over the past decade, the image intensifier and its video camera have been replace by integrated image receptors (FPDs). Most of these use a CsI x-ray detector that is similar in performance to the CsI found in image intensifiers. Some systems use a selenium layer to directly convert x-rays into an electron signal. Both designs generate a digital image with fewer stages than those needed for an image intensifier-video chain. Figure 2.13 schematically illustrates the structure of both FPDs.
The x-ray detection capabilities (dose efficiency) of flatpanel systems are similar to those of the latest generation of image intensifiers. The FPD by itself will not appreciably affect patient dose. However, flat-panel systems are usually furnished as part of a new fluoroscopic system. In newer systems, better dose-management algorithms, spectral shaping, and reduced frame rates for both fluoro and cine have combined to substantially reduce the overall dose required to perform a procedure.
The imaging behavior of a flat-panel system differs from an image-intensifier system in two important respects: the optical diaphragm between the image intensifier and the video camera delivers the same light level to the camera for both fluoro and cine. Thus, the camera noise is the same for both modes. Because there is no diaphragm inside the flat panel, the electronics must use a greater degree of amplification during fluoro relative to cine. Flat panels require a somewhat higher fluoroscopic entrance dose rate to overcome the additional electronic noise resulting from the additional amplification. However, because of control programming differences, fluoroscopic patient entrance dose rates are not really affected by image receptor type.
Figure 2.13 Indirect and direct flat-panel image receptors. The indirect (left) detector uses a Csl scintillator, virtually identical to that in an image intensifier, to convert the x-ray signal into light. A photodetector converts the light into an electron signal. This signal is then digitized. The direct detector (right) uses a selenium layer to directly convert the x-ray signal into an electrical charge distribution. This signal is then digitized.
The output of an image intensifier is the same size irrespective of the magnification mode. Thus, the (uncollimated) image always fills the entire digital matrix produced by the CCD camera. Each pixel represents a larger or smaller area of the input screen depending on the current magnification mode. However, the intrinsic spatial resolution of the II-CCD chain is often limited by the output screen. Thus, spatial resolution usually increases with increasing magnification because each area on the output screen represents a smaller area of the patient at higher magnification.
Most FPDs have a fixed total matrix size. In these systems, fewer pixels are used to capture the image in magnification mode. The resulting image is secondarily processed and magnified to fill the entire viewing monitor. In such systems, spatial resolution is independent of magnification mode. Some large-format FPDs have a large number of small pixels. For most magnification modes, four of these pixels are digitally averaged. Intrinsic resolution is independent of magnification in this domain. The pixels are unbundled for large magnifications (small FOVs). This increases intrinsic spatial resolution at the expense of increased dose and noise. Even when the limiting resolution is constant, digitally magnified images shown on the monitor may provide better detail coupling to the observer’s eye and can improve clinically usable resolution.
IMAGE PROCESSING AND DISPLAY
Digital images are always highly processed before they are displayed.48 Processing techniques include gray-scale transformations (changes overall contrast level and the relative contrast of objects of different brightness), edge enhancement (improves the visibility of small high-contrast structures such as stents at the expense of increasing the visibility of noise), smoothing (reduces the effect of noise in a single frame at the expense of edge sharpness), and temporal averaging. This last function provides a time-weighted average of several image frames. This reduces noise by averaging while maintaining the sharpness of nonmoving structures. The selections of the types of image processing used in a study are among the parameters included in the preprogrammed examination set. Most fluoroscopes provide user controls (typically on the x-ray control console) that allow the interventionalist to modify some of the parameters.
Only gold members can continue reading. Log In or Register to continue