Despite the efficacy of oral anticoagulants for stroke prevention in atrial fibrillation (AF), evidence suggests that many patients with AF who should be treated with vitamin K antagonists (VKAs) are treated with antiplatelet therapy or remain untreated. The aims of this study were to determine the proportion of patients with AF in each treatment category in clinical practice and to ascertain whether treatment is appropriate for stroke risk. An extensive search of the biomedical research published since 1994 was performed. Studies delineating the treatment of patients with AF were captured. Seventy-eight studies pertaining to the treatment of patients with AF were identified; 56 studies, containing data from 1980 to 2007, met the inclusion criteria. Over time, the use of VKA therapy for stroke prevention increased, while the proportion of untreated patients decreased; antiplatelet use remained static. Looking at the more recent data, (collected from 2000 onward), the proportion of patients receiving no therapy ranged from 4% to 48% (median 18%), antiplatelet therapy from 10% to 56% (median 30%), and VKA therapy from 9% to 86% (median 52%). Although most studies showed a decrease in the proportion of antiplatelet-treated and untreated patients with increasing stroke risk (12 of 14 studies), many patients at moderate or high risk for stroke were not treated according to guidelines. In conclusion, this review shows that up to 56% of patients with AF are treated with antiplatelet therapy, and up to 48% receive no therapy regardless of stroke risk level. This may reflect the inconvenience associated with VKA use, inadequate assessment of stroke risk, or poor adherence to treatment guidelines.
The population of patients with atrial fibrillation (AF) treated with antiplatelet therapy or with no therapy has not been well described and may represent patients who are not appropriately treated. The aim of this review of published reports was to estimate the proportion of the AF patient population in clinical settings who do not receive oral anticoagulants but rather are treated with either antiplatelet therapy or no therapy. Second, we aimed to ascertain whether therapy is appropriate for the patient’s stroke risk level.
Methods
Studies pertaining to the treatment of patients with AF using antiplatelet therapy, oral anticoagulants, or nothing were captured. An extensive search of recent biomedical research was performed using PubMed and was limited to those studies published since 1994 and to human subjects. Data reported within these studies spanned the period from 1980 to 2007. Combinations of the following search terms were used: “practices,” “treatment,” “atrial fibrillation,” “antithrombotics,” “antiplatelets,” “oral anticoagulants,” “warfarin,” and “vitamin K antagonist” (VKA). Studies were included if they focused on AF patient populations and if they delineated the proportions of those patients treated with no therapy, antiplatelet therapy, or oral anticoagulants. Studies were excluded if there was no delineation of patients by treatment or if data for 1 of the treatment criteria were missing (except when the missing data were the untreated group and a percentage or number of patients was reported for treatment with antithrombotic agents overall, in addition to VKAs and antiplatelet therapy, in which case the remaining proportion of patients was calculated from that treated overall and considered as receiving no therapy). Additionally, if the entire population had co-morbidities (e.g., previous stroke or heart failure), the study was excluded, because these populations are not representative of AF populations as a whole, and the proportions treated may be different. Clinical trials were excluded because they contained no data from “real-life” clinical settings. English-language reports were primarily reviewed, along with promising reports in other languages, as practical. The reference lists of retrieved reports were screened to identify additional sources of information, as were titles and abstracts returned as “related articles” from PubMed. All regions of the world were explored.
To provide a comparative overview of the selected studies, the following data were systematically extracted; patient population, study setting, mean age of population, year of study, country of study, relevant risk criteria, and treatment levels with oral anticoagulants, antiplatelet agents, or nothing. If treatment data were delineated by year of study, the proportion of patients treated was extracted for each year reported. When studies were carried out over >1 year but no breakdown over time was given, the year of study was taken to be the middle of the study period. Data were also sorted by country of study. Those countries with sufficient data (≥5 studies spanning ≥5 years of treatment data) were selected to examine the effect of country of study on treatment. Because the recommended treatment for AF is dependent on the risk for stroke of the patient, risk stratification information was also extracted when possible.
Results (medians and ranges) are presented as the percentage of patients with AF treated with oral anticoagulant therapy, antiplatelet therapy, or no therapy from the whole AF population, and by low, moderate, or high risk categorization for stroke on the basis of the risk scheme used in the particular study. Where an overall percentage or number of patients was reported for the treatment with antithrombotic agents, the remaining proportion of patients was calculated as receiving no therapy. When studies reported patients treated with VKA and antiplatelet agents simultaneously, these patients were counted as warfarin recipients. The associations between type of therapy and mean age of population, year of study, and country of study were all examined using regression analysis, and R 2 scores are reported. In addition, the association between stroke risk and type of therapy was analyzed using the chi-square test.
Results
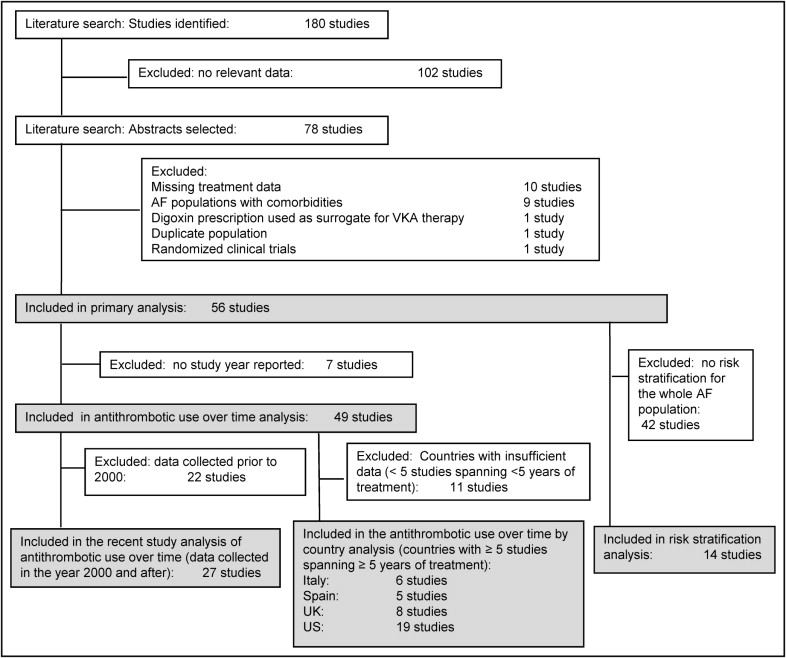
From a total of 180 studies containing treatment information for patients with AF, 78 studies were identified pertaining to patients with AF treated with VKA therapy, antiplatelet therapy, or nothing (see PRISMA [Preferred Reporting Items for Systematic Reviews and Meta-Analyses] diagram, Figure 1 ). Ten studies were excluded because data for 1 of the treatment criteria were missing. Nine studies were excluded because of AF populations with co-morbidities (e.g., AF with heart failure, AF with previous stroke). One randomized clinical trial was excluded, 1 study was excluded because of a duplicate population, and 1 study was excluded because it used digoxin prescription as a surrogate for VKA treatment. Fifty-six studies were included in the primary analysis. In addition, 49 studies were included in the analysis of antithrombotic use over time, of which 27 containing data collected in 2000 or afterward were analyzed for recent trends in antithrombotic use. Also from these 49 studies, 38 had sufficient data by country (for Italy, Spain, the United Kingdom, and the United States) to allow antithrombotic use to be examined over time for those countries. Further, of the original 56 studies used in the primary analysis, 14 that reported antithrombotic treatment delineated by patient stroke risk were evaluated.
Details of the 56 studies included in the primary analysis studies are listed in Table 1 . Overall, the proportion of patients treated with antiplatelet therapy in the AF population ranged from 10% to 59% (median 24%). Similarly, the proportion of untreated patients with AF ranged from 4% to 69% (median 23%), and the proportion given oral anticoagulants, of which all were VKA therapy, ranged from 9% to 86% (median 42%). Given the heterogeneity of the populations studied, the wide range in values is not unexpected. An examination of the effect of mean age of the population revealed no trend in therapy use with increasing age, but most of the populations captured in this study were elderly. Of the 56 studies included in the analysis, 42 studies reported the mean ages of their populations. All but 1 of the study populations reported mean ages >65 years, and the median mean age across studies was 73 years. An analysis of study setting (hospital vs general practice or inpatient vs outpatient) also revealed no differences in the proportion of patients treated with each therapy.
| Publication | Study | Population | AF Population (%) | |||||
|---|---|---|---|---|---|---|---|---|
| Time Frame | Design | Setting | Number of Patients | Age (years), Mean ± SD ‡ | No Therapy | Antiplatelet Therapy ⁎ | VKA Therapy | |
| Abdel-Latif et al (2005) | NR | Retrospective | Long-term care facilities | 117 | 85 ± 8 | 21% | 33% | 46% |
| Ageno et al (2001) | 1999 | Prospective | Hospitalized patients | 3,121 | 78.9 | 49% | 30% | 21% |
| Anderson et al (2005) | 1999–2001 | Cross-sectional | Hospital, community health care | 425 | 71 ± 12 | 11% | 20% | 69% |
| Bhagat and Tisocki (1999) | 1999 | Cross-sectional | Single hospital | 150 | 51 ± 12 | 69% | 10% | 21% |
| Bo et al (2007) | 2000, 2004 | Hospital | 701 | NR | 18% † | 26% | 56% | |
| Bordin et al (2003) | 2001 | Prospective | Cardiovascular center | 229 | 73 ± 5 | 21% | 45% | 35% |
| Boulanger et al (2006) | 1998–2003 | Retrospective | Physician practices | 13,709 | 67 ± 9 | 23% | 12% | 65% |
| Bradley et al (2000) | 1994–1996 | Retrospective | Hospital | 998 | NR | 29% † | 24% | 47% |
| Brass et al (1997) | 1994 | Retrospective | Medicare patients | 488 | NR | 43% | 23% | 34% |
| Brotons et al (1998) | 1996 | observational | Primary HC | 465 | NR | 49% | 36% | 16% |
| Burton et al (2006) | 1996–1999 | Retrospective | GP | 601 | NR | 26% | 25% | 49% |
| Cameron et al (2008) | 2007 | Prospective | District general hospital | 507 | 76 ± 10 | 11% | 38% | 51% |
| Coll-Vinent et al (2007) | 2004, 2005 | NR | Hospital; GP | 293 | 74 ± 12 | 14% | 28% | 58% |
| de Lusignan et al (2005) | 2004 | Cross-sectional | GP | 944 | NR | 31% † | 31% | 39% |
| DeWilde et al (2006) | 1994–2003 | NR | GP | 12,267 | NR | 19% | 33% | 49% |
| Fang et al (2004) | 1993–2002 | Retrospective | Office-based practice | 1,355 | NR | 54% † | 10% | 36% |
| Ferro et al (2007) | 2001–2005 | Prospective | Medical clinic | 255 | 73 | 13% | 25% | 62% |
| Filippi et al (2000) | NR | Retrospective | GP | 41,050 | 73 ± 10 | 19% | 48% | 33% |
| Friberg et al (2006) | 1995–2002 | Prospective | Hospital | 2,796 | 74 ± 13 | 18% | 44% | 38% |
| Friberg et al (2010) | 2002 | NR | Hospital, primary care center | 1,981 | 76 ± 11 | 22% | 49% | 30% |
| Gage et al (2000) | 1993–1996 | Retrospective | Hospitals | 463 | 80 | 45% | 21% | 34% |
| Gage et al (2006) | NR | NR | Medicare patients | 3,791 | 80 | 40% | 17% | 42% |
| Gaughan et al (2000) | 1998–1999 | Retrospective | Community hospital, anticoagulation clinic | 465 | NR | 25% † | 20% | 55% |
| Glazer et al (2007) | 2001–2002 | Case-control | HMO | 572 | 69 ± 11 | 28% | 18% | 54% |
| Gordian and Mustin (1998) | 1996 | Retrospective | Hospitals | 182 | 78 | 25% † | 23% | 52% |
| Goto et al (2008) | 2003–2004 | Prospective | Outpatients | 63,598 | 73 ± 9 | 5% | 40% | 55% |
| Gottlieb and Salem-Schatz (1994) | 1990 | Retrospective | HC | 238 | 69 | 24% † | 11% | 66% |
| Gurwitz et al (1997) | 1993–1995 | NR | Long-term care | 413 | 83 | 43% | 25% | 32% |
| Hylek et al (2006) | 2001–2003 | Prospective | Hospital | 426 | 80 | 11% | 38% | 51% |
| Inoue et al (2006) | 1999 | Prospective | NR | 509 | 67 ± 10 | 16% | 32% | 52% |
| Laguna et al (2004) | 2000 | NR | Emergency department | 66,146 | 75 ± 12 | 48% † | 21% | 31% |
| Leizorovicz et al (2007) | 2002 | Prospective | Private GPs, cardiologists | 5,893 | 76 ± 10 | 5% | 19% | 77% |
| Lin et al (2008) | 2003–2004 | Descriptive | Hospitals and clinics | 39,541 | 70 ± 12 | 27% | 52% | 21% |
| Martin-Acicoya et al (2004) | 2002 | Cross-sectional | Primary care center | 28,447 | 77 | 6% | 23% | 71% |
| McBride et al (2007) | 2003–2004 | Prospective | Physician practices | 361 | 71 ± 9 | 12% | 10% | 78% |
| McBride et al (2009) | 2003–2004 | Prospective | Physician practices | 311 | 71 ± 9 | 4% | 11% | 86% |
| McCormick et al (2001) | 1997–1998 | Retrospective | Long-term care facilities | 429 | 87 | 32% | 26% | 42% |
| McNulty et al (2000) | NR | Retrospective | Hospitals | 370 | 75 ± 11 | 29% | 33% | 38% |
| Meiltz et al (2008) | 2005 | Prospective | Cardiology practice | 622 | 69.8 ± 11.8 | 4% | 16% | 80% |
| Miyasaka et al (2005) | 1980–2000 | Prospective | Mayo Clinic | 4,117 | 73 ± 14 | 42% † | 40% | 18% |
| Monte et al (2006) | 2002 | Prospective | Local health authorities | 1,812 | 78.8 ± 7.5 | 45% | 22% | 34% |
| Murdoch et al (2005) | 1999–2001 | Cross-sectional | GP | 1,008 | 73.4 | 10% | 25% | 65% |
| Murphy et al (2007) | 2001–2003 | NR | Primary care practices | 3,135 | NR | 22% † | 48% | 30% |
| Nieuwlaat et al (2008) | 2003–2004 | Prospective | Hospitals | 5,333 | 66.7 | 11% | 31% | 64% |
| Parkash et al (2007) | 1999–2001 | Cross-sectional | Ambulatory settings | 425 | 70.6 ± 11.1 | 11% | 20% | 69% |
| Perez et al (1999) | NR | Cross-sectional | District general hospital | 344 | 68.4 | 45% | 27% | 29% |
| Sam et al (2004) | 1981–1994 | Retrospective | Community-based | 393 | 75.8 | 59% | 21% | 20% |
| Sanchez et al (1999) | 1998 | Retrospective | Hospitals | 205 | 75.9 | 24% | 46% | 30% |
| Sun et al (2009) | 2000–2002 | Retrospective | Tertiary care centers | 3,425 | 69.5 ± 11.8 | 35% | 56% | 9% |
| Thomassen et al (2001) | 1995–1998 | Retrospective | Hospital | 362 | 68.4 | 12% | 20% | 68% |
| Tomita et al (2000) | 1995 | Prospective | Cardiovascular clinics | 2,667 | 67 ± 11 | 43% | 44% | 13% |
| Waldo et al (2005) | 2002 | Retrospective | Hospitals | 945 | 71.5 ± 13.5 | 22% | 25% | 54% |
| Wandell et al (1999) | 1992–1993 | NR | Community HC | 135 | 75.2 ± 9.3 | 29% † | 42% | 29% |
| 1997–1998 | 144 | 74.7± 9.8 | ||||||
| White et al (1999) | 1993–1995 | Prospective | 4 communities | 172 | NR | 33% | 29% | 39% |
| White et al (2004) | NR | Retrospective | GP | 2,684 | NR | 36% | 31% | 33% |
| Zuo et al (2007) | NR | NR | General hospitals, community HC | 583 | NR | 19% | 59% | 22% |
⁎ Antiplatelet therapy encompasses patients taking aspirin and other antiplatelet therapies (no VKAs).
† Value for no therapy calculated from proportion of overall antithrombotic use within the population.
To examine the effect of time on the use of antithrombotic agents, the association between study year and the proportion of patients prescribed VKA therapy, antiplatelet therapy, or no therapy was analyzed for 49 of the 56 studies ( Figure 2 ). Seven studies reported only the year of publication and were therefore excluded. Although the variation among studies is large and the R 2 values are low, trends could be seen. The proportion of patients treated with VKA therapy increased from about 10% of patients with AF in 1982 to just over 60% in 2007 (R 2 for trend = 0.286), while the proportion of patients treated with no therapy decreased from just under 70% to about 10% (R 2 = 0.498). Antiplatelet use did not change dramatically, increasing from about 20% to about 30% over the 25 years covered by the captured studies (R 2 = 0.031).
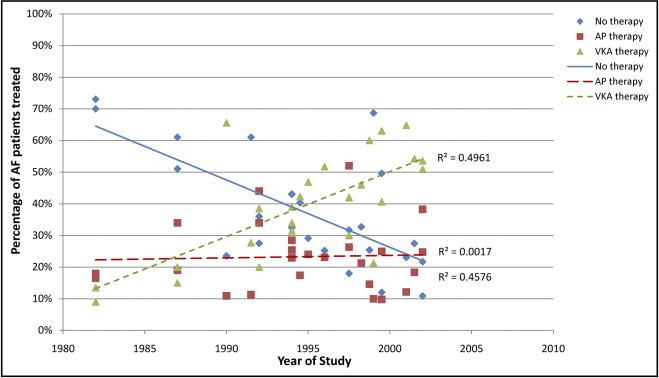
Because the proportion of untreated patients with AF has lessened over time, analysis of the more recent treatment practices was performed by limiting the captured data set to only those studies carried out in 2000 and afterward (27 studies). The proportion of patients receiving no therapy ranged from 4% to 48% (median 18%), antiplatelet therapy from 10% to 56% (median 30%), and VKA therapy from 9% to 86% (median 52%).
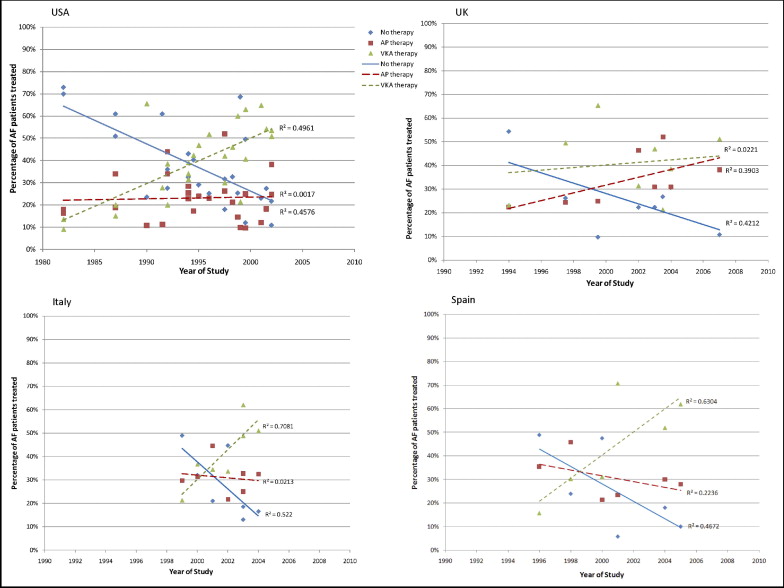
The effect of the country in which the study took place was also examined. Sufficient data existed for 4 countries (Italy, 6 studies covering 1999 to 2004; Spain, 5 studies covering 1996 to 2005; the United Kingdom, 8 studies covering 1994 to 2007; and the United States, 19 studies covering 1982 to 2002; Figure 3 ). Overall, the trends in the treatment of patients with AF over time were the same for all 4 countries, with the proportion of patients treated with VKAs increasing over time while the proportion of untreated patients decreased. The change in the proportion of patients treated with antiplatelet therapy over time differed among countries. In Italy, Spain, and the United States, the proportions of patients treated with AF remained relatively constant, while in the United Kingdom, the use of antiplatelet medications for treating patients with AF increased from about 20% in 1994 to about 45% in 2007 (R 2 for trend = 0.390).
Fourteen studies contained stroke risk stratification information for the whole AF population ( Table 2 ). The percentage of patients in each risk category varied from study to study, with 2% to 60% designated as low risk (median 9%), 7% to 62% as moderate risk (median 30%), and 7% and 89% as high risk (median 62%). The numbers of patients with AF with no therapy, antiplatelet therapy, or VKA therapy were stratified according to stroke risk. It should be noted that among the individual studies, the overall proportion of patients receiving no therapy, antiplatelet therapy, or VKA therapy varied considerably from study to study, ranging from 4% to 45%, from 12% to 52%, and from 21% to 80%, respectively. For patients with AF designated as low risk (those who should be treated with no therapy or antiplatelet therapy according to guidelines), 5% to 62% (median 34%) received no therapy, 11% to 50% (median 29%) received antiplatelet therapy, and 13% to 61% (median 37%) received VKA therapy ( Table 2 ). From 4% to 47% (median 24%) of patients designated as moderate risk for stroke received no therapy, while 11% to 49% (median 31%) received antiplatelet therapy, and 17% to 82% (median 45%) received VKA therapy. A smaller proportion of patients with AF at high risk for stroke received no therapy (1% to 27%, median 13%), while 7% to 64% (median 30%) received antiplatelet therapy, depending on the study ( Figure 4 ). The percentage of high-risk patients correctly receiving VKA therapy ranged from 21% to 92% (median 58%). Although the variation among studies is very large, a significant association between stroke risk level and therapy prescribed was found in 12 of the 14 studies examined ( Table 2 ).
| Publication | Study | Population | Stroke Risk | Patients With AF (%) | Chi-Square | p Value | |||||||
|---|---|---|---|---|---|---|---|---|---|---|---|---|---|
| Time Frame | Design | Setting | Number of Patients | Age (years), Mean ± SD ⁎ | Criteria | Level (%) | No Therapy | Antiplatelet Therapy | VKA Therapy | ||||
| Bo (2007) | 2000–2004 | NR | Hospital | 701 | NR | Van Walraven et al (2002) | L | 5% | 10 | 10 | 3 | 43.2 | <0.0001 |
| M | 49% | 55 | 61 | 109 | |||||||||
| H | 46% | 19 | 46 | 146 | |||||||||
| Boulanger (2006) | 1998–2003 | Retrospective | Physician practices | 13,709 | NR | CHADS 2 | L | 60% | 2137 | 1,077 | 4,957 | 184.1 | <0.0001 |
| M | 34% | 898 | 517 | 3,219 | |||||||||
| H | 7% | 120 | 75 | 710 | |||||||||
| de Lusignan (2005) | 2004 | Cross-sectional | GP | 941 | NR | Study specific | L | 10% | 57 | 13 | 25 | 70.0 | <0.0001 |
| M | 30% | 82 | 86 | 118 | |||||||||
| H/VH | 60% | 146 | 192 | 222 | |||||||||
| Dewilde (2006) | 1994–2003 | NR | GP | 12,267 | NR | PRODIGY | L | 8% | 504 | 132 | 393 | 895.4 | <0.0001 |
| M | 29% | 786 | 1,076 | 1545 | |||||||||
| H | 64% | 985 | 2,804 | 4,042 | |||||||||
| Ferro (2007) | 2001–2005 | Prospective | Medical clinic | 255 | NR | Lip et al (2002) | L | 8% | 5 | 8 | 7 | 8.9 | =0.0636 |
| M | 8% | 4 | 7 | 10 | |||||||||
| H | 84% | 25 | 50 | 139 | |||||||||
| Filippi (2000) | NR | Retrospective | GP | 41,050 | 73.0 | Lip (1999) | L | 4% | 15 | 7 | 9 | 62.2 | <0.0001 |
| M | 32% | 64 | 75 | 29 | |||||||||
| H | 63% | 54 | 265 | 93 | |||||||||
| Glazer (2007) | 2001–2002 | Case-control | HMO | 581 | NR | Seventh ACCP guidelines (2004) | L | 16% | 33 | 20 | 42 | 13.0 | =0.0112 |
| M | 7% | 18 | 7 | 17 | |||||||||
| H | 76% | 107 | 75 | 262 | |||||||||
| Goto (2008) | 2003–2004 | Prospective | Outpatients | 63,589 | 72.8 | CHADS 2 | L | 3% | 9 | 96 | 87 | 54.9 | <0.0001 |
| M | 15% | 51 | 499 | 460 | |||||||||
| H | 82% | 286 | 2140 | 3,186 | |||||||||
| Inoue (2006) | September 1999 | Prospective | University hospitals | 509 | 66.6 ± 10.3 | CHADS 2 | L | 30% | 36 | 51 | 64 | 18.2 | =0.0011 |
| M | 51% | 40 | 86 | 134 | |||||||||
| H | 19% | 7 | 26 | 65 | |||||||||
| Lin (2008) | 2003–2004 | Descriptive | Hospitals and clinics | 39,541 | 70.1 | ACC/AHA/ESC (2001) | L | 3% | 524 | 543 | 286 | 351.9 | <0.0001 |
| M | 8% | 1,189 | 1331 | 626 | |||||||||
| H | 89% | 8,855 | 18,710 | 7,477 | |||||||||
| McNulty (2000) | NR | Retrospective | Hospitals | 370 | NR | Lip et al (1996) | L | 2% | 2 | 2 | 2 | 2.1 | =0.7177 |
| M | 22% | 26 | 26 | 31 | |||||||||
| H | 83% | 79 | 94 | 133 | |||||||||
| Meiltz (2008) | January 2005 – December 2005 | Prospective | Cardiology practices | 622 | NR | CHADS 2 | L | 26% | 16 | 53 | 95 | 76.9 | <0.0001 |
| M | 30% | 7 | 27 | 151 | |||||||||
| H | 44% | 3 | 18 | 252 | |||||||||
| Nieuwlaat (2006) | 2003–2004 | NR | Hospitals | 2,076 | NR | CHADS 2 | L | 14% | 73 | 86 | 173 | 85.1 | <0.0001 |
| M | 29% | 70 | 209 | 418 | |||||||||
| H | 57% | 77 | 426 | 849 | |||||||||
| Perez (1999) | NR | Cross-sectional | Medical clinics | 344 | NR | Study specific | L | 14% | 29 | 5 | 13 | 22.2 | =0.0002 |
| M | 62% | 101 | 62 | 50 | |||||||||
| H | 24% | 23 | 25 | 36 | |||||||||
Stay updated, free articles. Join our Telegram channel

Full access? Get Clinical Tree


