Worsening renal function (RF) and improved RF during the treatment of decompensated heart failure have traditionally been thought of as hemodynamically distinct events. We hypothesized that if the pulmonary artery catheter-derived measures are relevant in the evaluation of cardiorenal interactions, the comparison of patients with improved versus worsening RF should highlight any important hemodynamic differences. All subjects in the Evaluation Study of Congestive Heart Failure and Pulmonary Artery Catheterization Effectiveness trial limited data set with admission and discharge creatinine values available were included (n = 401). No differences were found in the baseline, final, or change in pulmonary artery catheter-derived hemodynamic variables, inotrope and intravenous vasodilator use, or survival between patients with improved versus worsening RF (p = NS for all). Both groups were equally likely to be in the bottom quartile of cardiac index (p = 0.32), have a 25% improvement in cardiac index (p = 0.97), or have any worsening in cardiac index (p = 0.90). When patients with any significant change in renal function (positive or negative) were compared to those with stable renal function, strong associations between variables such as a reduced cardiac index (odds ratio 2.2, p = 0.02), increased intravenous inotrope and vasodilator use (odds ratio 2.9, p <0.001), and worsened all-cause mortality (hazard ratio 1.8, p = 0.01) became apparent. In contrast to traditionally held views, the patients with improved RF and those with worsening RF had similar hemodynamic parameters and outcomes. Combining these groups identified a hemodynamically compromised population with significantly worse survival than patients with stable renal function. In conclusion, the changes in renal function, regardless of the direction, likely identify a population with an advanced disease state and a poor prognosis.
Worsening renal function (RF) complicates approximately one third of acute decompensated heart failure admissions and has been associated with an increased length of stay and readmission rate and decreased short- and long-term survival. Traditional teaching has held that the hemodynamic profile associated with worsening RF is that of decreased cardiac output and intravascular volume depletion, concepts that have not been borne out in recent publications. Likely arising from similar logic, improved RF has been suggested to result from a treatment-induced increase in “forward flow” to the kidney. Because the current data regarding the profile of patients developing worsening RF has largely been inconsistent with previously proposed mechanisms, we hypothesized that this might also be true of improved RF. Our first aim was to directly compare patients with improved RF with those with worsening RF. Because the hemodynamic changes offered to explain worsening RF and improved RF have largely been discordant, we believed this would optimize the probability of documenting any important hemodynamic differences. Additionally, a requisite for an improvement in RF during the treatment of decompensated heart failure is reversible renal dysfunction at baseline. Unless this renal dysfunction was present at birth, by definition this indicates that worsening RF had occurred before admission. Resultantly, we hypothesized that the outcomes of patients with improved RF and worsening RF may be similar and our second aim was to investigate if any change in RF, either improved or worsened, may be the prognostically more relevant variable to investigate.
Methods
The Evaluation Study of Congestive Heart Failure and Pulmonary Artery Catheterization Effectiveness (ESCAPE) Trial was a National Heart, Lung and Blood Institute (NHLBI)-sponsored, randomized, multicenter trial of therapy guided by pulmonary artery catheter (PAC) versus clinical assessment in hospitalized patients with acute decompensated heart failure. The methods and results have been previously published. In brief, 433 patients were enrolled at 26 sites from January 2000 to November 2003. The inclusion criteria included an ejection fraction of ≤30%, systolic blood pressure of ≤125 mm Hg, treatment in the preceding month with >160 mg of furosemide (or equivalent), and at least one sign and one symptom of congestion. The exclusion criteria included an admission creatinine level of ≥3.5 mg/dl, use of dopamine or dobutamine of ≥3 μg/kg/min, or any use of milrinone before randomization. The patients were randomized to therapy guided by the clinical assessment alone versus PAC and clinical assessment. The treatment goals were resolution of the signs and symptoms of congestion. In patients randomized to the PAC arm, the additional goals of treatment were a pulmonary capillary wedge pressure of ≤15 mm Hg and a right atrial pressure of ≤8 mm Hg. Routine use of inotropes was “explicitly” discouraged, but diuretics and vasodilating agents were recommended. The ESCAPE trial was conducted and supported by the NHLBI in collaboration with the ESCAPE study investigators. The present report was prepared using a limited-access data set obtained from the NHLBI and does not necessarily reflect the opinions or views of the ESCAPE investigators or the NHLBI.
A relative change in the glomerular filtration rate (GFR) was used rather than an absolute change in the serum creatinine to account for the nonlinear relation between creatinine and RF. A significant change in RF, regardless of direction, was defined as a ≥20% change in the GFR, and patients meeting this criterion were categorized as having dynamic RF. Patients not meeting this criterion were classified as having stable RF. The GFR was estimated using the 4-variable Modification of Diet in Renal Disease study equation. The in-hospital loop diuretic dose represents the maximum total intravenous loop diuretic dose received in any 1 day of the study period.
The values are reported as the mean ± SD for continuous variables and percentiles for categorical variables, unless otherwise noted. The independent Student t test or Mann-Whitney U test was used to compare the mean values of the independent continuous variables. The Pearson chi-square test was used to evaluate the categorical variables. A trend analysis of ordinal variables was done using a linear-by-linear association. The Wilcoxon signed rank test was used to compare the GFR over time within the worsening RF or improved RF groups. To highlight the similarity or dissimilarity between patients with improved and worsening RF, these groups were compared directly for the primary analysis. Contingent on satisfying our hypothesis that the groups would be similar hemodynamically, the improved and worsening RF groups were combined and compared to the patients with no change in RF. Cox proportional hazard modeling was used to evaluate the univariate hazard ratio (HR) of the predictors of mortality and rehospitalization. Patients who were alive or had not been rehospitalized at 180 days were censored. Cox proportional modeling was used to test the independence of renal variables in their association with mortality. The candidate variables for multivariate Cox proportional modeling were obtained by entry of all univariate baseline predictors of mortality with p <0.2 and ≤5% missing values. Using backwards elimination, starting with the variable with the largest p value, the variables altering the HR by >10% were retained in the final model. Statistical analysis was performed with the Statistical Package for Social Sciences, version 17.0 (SPSS, Chicago, Illinois), with significance defined as 2-tailed p <0.05.
Results
Of the 433 patients enrolled in the ESCAPE trial, 401 had admission and discharge serum creatinine values available, and these subjects were included in the subsequent analysis. The baseline characteristics of the trial population have been previously reported. Additionally, Nohria et al have described the lack of association between PAC-derived hemodynamic variables and the development of worsening RF in this population. Worsening RF occurred in 21.2% (n = 85) and improved RF occurred in 16.2% (n = 65) of the population.
Overall, the baseline demographics, co-morbidities, symptom severity, physical examination, and medication use were similar between patients with improved and worsening RF. Notable exceptions were a greater admission systolic blood pressure, an increased prevalence of hypertension, and a greater incidence of suspected ascites in patients with worsening RF ( Table 1 ).
| Characteristic | Worsening RF (n = 85) | Improved RF (n = 65) | p Value | Stable RF (n = 251) | Dynamic RF (n = 150) | p Value |
|---|---|---|---|---|---|---|
| Age (years) | 55 ± 13 | 58 ± 15 | 0.109 | 56 ± 14 | 56 ± 14 | 0.946 |
| Men | 73% | 85% | 0.087 | 72% | 78% | 0.192 |
| White race | 51% | 60% | 0.251 | 63% | 55% | 0.12 |
| Ischemic etiology of heart failure | 55% | 47% | 0.342 | 47% | 51% | 0.447 |
| Hypertension | 50% | 31% | 0.022 ⁎ | 50% | 42% | 0.108 |
| Diabetes mellitus | 39% | 25% | 0.067 | 32% | 33% | 0.799 |
| Myocardial infarction | 48% | 42% | 0.511 | 43% | 45% | 0.663 |
| Coronary bypass grafting | 33% | 25% | 0.272 | 30% | 30% | 0.908 |
| Gout | 17% | 22% | 0.423 | 18% | 19% | 0.883 |
| Dyspnea at rest | 53% | 59% | 0.5 | 60% | 55% | 0.36 |
| Fatigue at rest | 67% | 72% | 0.49 | 64% | 69% | 0.254 |
| Orthopnea | 87% | 82% | 0.352 | 86% | 85% | 0.714 |
| New York Heart Association class (mean) | 3.9 ± 0.3 | 3.9 ± 0.3 | 0.855 | 3.8 ± 0.4 | 3.9 ± 0.3 | 0.18 |
| Six-minute walk (ft.) | 417 ± 418 | 428 ± 381 | 0.569 | 416 ± 429 | 422 ± 401 | 0.572 |
| Maximal oxygen consumption (ml/kg/min) | 9.7 ± 1.9 | 10.9 ± 5.0 | 0.831 | 9.9 ± 3.2 | 10.3 ± 3.7 | 0.655 |
| Ejection fraction (%) | 18.3 ± 6.0 | 18.2 ± 6.3 | 0.94 | 20.1 ± 6.6 | 18.3 ± 6.1 | 0.008 ⁎ |
| Systolic blood pressure (mm Hg) | 110 ± 18 | 101 ± 16 | 0.001 ⁎ | 106 ± 15 | 106 ± 18 | 0.775 |
| Heart rate (beats/min) | 84 ± 16 | 80 ± 16 | 0.111 | 81 ± 14 | 82 ± 16 | 0.569 |
| Respiration rate (breaths/min) | 21 ± 4 | 20 ± 4 | 0.862 | 21 ± 4 | 20 ± 4 | 0.722 |
| Jugular venous pressure >12 cm | 25% | 21% | 0.509 | 19% | 23% | 0.294 |
| Rales >1/3 lung fields | 18% | 11% | 0.241 | 14% | 15% | 0.726 |
| Ascites of moderate or greater | 29% | 14% | 0.036 ⁎ | 18% | 22% | 0.241 |
| Severe edema | 17% | 11% | 0.322 | 10% | 14% | 0.258 |
| Cool extremities | 14% | 22% | 0.229 | 16% | 18% | 0.684 |
| Medications (baseline) | ||||||
| Angiotensin-converting enzyme inhibitor/angiotensin receptor blocker | 89% | 89% | 0.972 | 90% | 89% | 0.721 |
| β Blocker | 54% | 67% | 0.107 | 64% | 60% | 0.423 |
| Loop diuretic (mg) † | 200 (120, 400) | 160 (120, 320) | 0.16 | 200 (100, 320) | 190 (120, 320) | 0.334 |
| Spironolactone | 38% | 32% | 0.664 | 33% | 34% | 0.726 |
| Thiazide diuretic | 16% | 12% | 0.438 | 11% | 14% | 0.33 |
| Medications (in-hospital) | ||||||
| Angiotensin-converting enzyme inhibitor/Angiotensin receptor blocker | 93% | 88% | 0.27 | 93% | 91% | 0.345 |
| Loop diuretic (mg) † | 280 (160, 450) | 190 (120, 400) | 0.056 | 200 (100, 340) | 240 (140, 425) | 0.039 ⁎ |
| Thiazide diuretic | 46% | 27% | 0.017 ⁎ | 24% | 38% | 0.003 ⁎ |
| Inotropes | 45% | 55% | 0.221 | 38% | 49% | 0.028 ⁎ |
| Vasodilators | 37% | 43% | 0.486 | 22% | 39% | >0.001 ⁎ |
| Inotropes or vasodilators | 71% | 78% | 0.3 | 50% | 74% | >0.001 ⁎ |
| Laboratory findings | ||||||
| Hemoglobin (g/dl) | 12.5 ± 1.8 | 12.6 ± 1.9 | 0.565 | 12.6 ± 1.8 | 12.5 ± 1.8 | 0.748 |
| Serum sodium (mEq/L) | 137 ± 5 | 135 ± 6 | 0.002 ⁎ | 137 ± 4 | 136 ± 5 | 0.189 |
| Serum creatinine (mg/dl) | 1.27 ± 0.51 | 2.08 ± 0.83 | >0.001 ⁎ | 1.44 ± 0.49 | 1.62 ± 0.78 | 0.126 |
| Glomerular filtration rate (ml/min) | 69.5 ± 29.5 | 39.9 ± 17.2 | >0.001 ⁎ | 57.2 ± 23.0 | 56.7 ± 28.9 | 0.837 |
| B-type natriuretic peptide (pg/ml) | 1076 ± 1301 | 1309 ± 1953 | 0.48 | 906 ± 1144 | 1174 ± 1605 | 0.209 |
| Norepinephrine (pg/ml) | 547 ± 366 | 977 ± 579 | >0.001 ⁎ | 660 ± 535 | 721 ± 508 | 0.175 |
† Loop diuretic dose reported as median (interquartile range). Baseline loop dose represents daily oral dose before hospitalization. In-hospital loop dose represents maximum intravenous loop diuretic dose received on any day of study.
No PAC-derived variables demonstrated any significant discriminative ability between the improved and worsening RF groups ( Table 2 ). In contrast to the postulated association between cardiac index and changes in RF, the baseline, final, and admission to final change in cardiac index was not different between the patients with improved versus worsening RF ( Table 2 ). Both groups were equally likely to be in the bottom quartile of cardiac index (p = 0.32), to have a 25% improvement in cardiac index (p = 0.97), or to have any worsening in cardiac index during hospitalization (p = 0.90). Similarly, the baseline, final, and change in right atrial pressure and pulmonary capillary wedge pressure did not differentiate patients with improved or worsening RF ( Table 2 ).
| Characteristic | Worsening RF | Improved RF | p Value | Stable RF | Dynamic RF | p Value |
|---|---|---|---|---|---|---|
| Hemodynamics (baseline) | n = 41 | n = 42 | n = 99 | n = 83 | ||
| Right atrial pressure (mm Hg) | 13.2 ± 6.3 | 12.7 ± 7.4 | 0.612 | 13.4 ± 10.4 | 12.9 ± 6.8 | 0.664 |
| Pulmonary artery systolic pressure (mm Hg) | 57.4 ± 13.8 | 55.1 ± 12.7 | 0.447 | 54.4 ± 15.7 | 56.2 ± 13.2 | 0.407 |
| Pulmonary capillary wedge pressure (mm Hg) | 26.3 ± 7.1 | 25.4 ± 10.2 | 0.717 | 23.7 ± 9.8 | 25.9 ± 8.8 | 0.219 |
| Cardiac index (L/min/m 2 ) | 1.82 ± 0.63 | 1.91 ± 0.55 | 0.249 | 2.08 ± 0.60 | 1.86 ± 0.59 | 0.019 ⁎ |
| Systemic vascular resistance (dyne-s/cm5) | 1,554 ± 1,064 | 1,490 ± 679 | 0.97 | 1,464 ± 802 | 1,522 ± 885 | 0.974 |
| Hemodynamics (pulmonary artery catheter removal) | n = 37 | n = 37 | n = 89 | n = 72 | ||
| Right atrial pressure (mm Hg) | 10.5 ± 5.4 | 9.0 ± 5.3 | 0.216 | 8.6 ± 5.5 | 9.7 ± 5.4 | 0.137 |
| Pulmonary artery systolic pressure (mm Hg) | 49.0 ± 12.3 | 46.4 ± 11.8 | 0.381 | 44.6 ± 13.0 | 47.8 ± 12.1 | 0.113 |
| Pulmonary capillary wedge pressure (mm Hg) | 18.5 ± 6.5 | 16.4 ± 7.5 | 0.323 | 17.0 ± 8.2 | 17.4 ± 7.0 | 0.844 |
| Cardiac index (L/min/m 2 ) | 2.26 ± 0.71 | 2.27 ± 0.53 | 0.915 | 2.41 ± 0.65 | 2.26 ± 0.62 | 0.07 |
| Systemic vascular resistance (dyne-s/cm5) | 1,091 ± 466 | 1,156 ± 488 | 0.746 | 1,119 ± 491 | 1,126 ± 475 | 0.82 |
| Hemodynamics (change) | n = 36 | n = 35 | n = 85 | n = 68 | ||
| Right atrial pressure (mm Hg) | −2.8 ± 7.4 | −3.9 ± 7.5 | 0.712 | −4.8 ± 10.5 | −3.4 ± 7.4 | 0.547 |
| Pulmonary artery systolic pressure (mm Hg) | −9.6 ± 13.5 | −9.0 ± 11.9 | 0.851 | −9.7 ± 12.4 | −9.3 ± 12.7 | 0.338 |
| Pulmonary capillary wedge pressure (mm Hg) | −8.3 ± 7.1 | −7.5 ± 10.0 | 0.729 | −6.9 ± 9.3 | −7.9 ± 8.6 | 0.526 |
| Cardiac index (L/min/m 2 ) | 0.46 ± 0.69 | 0.47 ± 0.59 | 0.909 | 0.36 ± 0.70 | 0.46 ± 0.63 | 0.092 |
| Systemic vascular resistance (dyne-s/cm 5 ) | −484 ± 1,121 | −384 ± 549 | 0.641 | −336 ± 757 | −431 ± 858 | 0.372 |
Overall, the treatment characteristics of the patients with improved and worsening RF were similar. No differences were seen in the baseline or in-hospital medications, with the exception of a greater use of thiazide diuretics in the group with worsening RF ( Table 1 ). The loop diuretic dosage, intravenous vasodilator use, and inotrope use were similar between the 2 groups ( Table 1 ).
As might be expected by the nature of the dichotomy, the renal variables differed substantially between the 2 groups. The mean admission GFR was significantly lower in the group developing improved RF (39.9 ± 17.2 vs 69.5 ± 29.5 ml/min, p <0.001). However, by the time of discharge, the GFR was greater in the improved RF group than in the worsening RF group (57.1 ± 22.2 ml/min vs 45.7 ± 22.4 ml/min, p = 0.002). In patients with 6-month creatinine values available, the group with improved RF had had a significant decrease in GFR from discharge to 6 months (59.2 ± 24.6 vs 47.5 ± 20.9 ml/min, p <0.001); however, the GFR remained significantly greater than the admission value (40.8 ± 18.8 vs 47.5 ± 20.9 ml/min, p <0.001). From discharge to 6 months, the GFR in the worsening RF group improved somewhat (47.7 ± 22.7 vs 60.2 ± 29.6 ml/min, p <0.001), but it did not recover fully to baseline levels (73.0 ± 29.6 vs 60.2 ± 29.6 ml/min, p <0.001).
Patients with improved RF had significantly greater admission norepinephrine levels ( Table 1 ) and were much more likely to have values in the highest quartile at admission than the patients with worsening RF (odds ratio 6.3, p <0.001). The serum sodium level was also lower in the group with improved RF ( Table 1 ). The differences in sodium (p = 0.99) and norepinephrine (p = 0.38) were no longer significantly different at discharge.
Overall, the short- and long-term outcomes of these groups were also similar with no differences in the length of stay (p = 0.87) or rehospitalization rate (p = 0.47) between patients with improved and worsening RF. Additionally, mortality was similar in the group developing improved RF compared to those with worsening RF (HR 1.1, p = 0.85). One notable difference was the significantly greater weight loss (5.4 ± 5.2 vs 2.7 ± 5.0 kg, p = 0.002) and greater rate of weight loss (0.75 ± 0.78 vs 0.34 ± 0.68 kg/day, p = 0.002) in the worsening RF compared to the improved RF group.
Patients with worsening RF had no significant differences in the baseline, final, or change in hemodynamic parameters compared to the patients without worsening RF (p = NS for all, data not shown). The group with improved RF shared the same lack of associations compared to the patients without improved RF (p = NS for all, data not shown). As such, an analysis of all patients with a 20% change in GFR (dynamic RF), regardless of improvement or deterioration, was undertaken to explore the hypothesis that the susceptibility to changes in RF, rather than the actual direction of change, might be the more relevant clinical variable.
Compared to patients with stable RF (stable RF), patients with dynamic RF had a significantly lower baseline ejection fraction and cardiac index ( Tables 1 and 2 ). Additionally, they were more likely to be in the bottom quartile of cardiac index (odds ratio 2.2, p = 0.021) or have a 25% improvement in cardiac index from admission to PAC removal (odds ratio 3.3, p = 0.001). Other hemodynamic variables were similar ( Table 2 ). Differences in treatment characteristics included a significantly greater use of intravenous vasodilators and inotropes in patients with dynamic RF ( Table 1 ). Moreover, the dose of loop diuretics was greater, and adjunctive thiazide diuretics were more commonly used ( Table 1 ). The length of stay was significantly longer in the group with dynamic RF (9.8 vs 8.0 days, p <0.001).
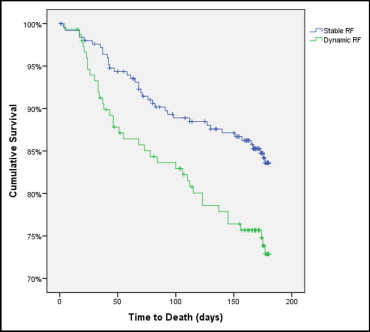
The univariate associations between improved RF and mortality (HR 1.6, p = 0.11) and between worsening RF and mortality (HR 1.5, p = 0.14) were not statistically significant. However, a comparison of patients with improved or worsening RF to the group with stable RF demonstrated significant associations with mortality (improved RF, HR 1.9, p = 0.032; worsening RF, HR 1.7, p = 0.043). Similarly, the group with dynamic RF had a substantially increased mortality rate compared to those with stable RF (HR 1.8, p = 0.01; Figure 1 ).