Thoracic aortic aneurysms (TAs) occur in reproducible patterns, but etiologic factors determining the anatomic distribution of these aneurysms are not well understood. This study sought to gain insight into etiologic differences and clinical outcomes associated with repetitive anatomic distributions of TAs. From 3,247 patients registered in an institutional Thoracic Aortic Center database from July 1992 to August 2013, we identified 844 patients with full aortic dimensional imaging by computerized axial tomography or magnetic resonance imaging scan (mean age 62.8 ± 14 years, 37% women, median follow-up 40 months) with TA diameter >4.0 cm and without evidence of previous aortic dissection. Patient demographic and imaging data were analyzed in 3 groups: isolated ascending thoracic aortic aneurysms (AAs; n = 628), isolated descending TAs (DTAs; n = 130), and combined AA and DTA (mixed thoracic aortic aneurysm, MTA; n = 86). Patients with DTA had more hypertension (82% vs 59%, p <0.001) and a higher burden of atherosclerosis (88% vs 9%, p <0.001) than AA. Conversely, patients with isolated AA were younger (59.5 ± 13.5 vs 71.0 ± 11.8 years, p <0.001) and contained almost every case of overt, genetically triggered TA. Patients with isolated DTA were demographically indistinguishable from patients with MTA. In follow-up, patients with DTA/MTA experienced more aortic events (aortic dissection/rupture) and had higher mortality than patients with isolated AA. In multivariate analysis, aneurysm size (odds ratio 1.1, 95% CI 1.07 to 1.16, p <0.001) and the presence of atherosclerosis (odds ratio 5.7, 95% CI 2.02 to 16.15, p <0.001) independently predicted adverse aortic events. We find that DTA with or without associated AA appears to be a disease more highly associated with atherosclerosis, hypertension, and advanced age. In contrast, isolated AA appears to be a clinically distinct entity with a greater burden of genetically triggered disease.
Aneurysms of the aorta occur in repetitive anatomic patterns. Divergent etiologies between anatomic categories of aortic aneurysm have been suggested based on comparison between thoracic aortic aneurysms (TAs) and abdominal aortic aneurysms (AAAs). Over the last century, the ratio of TAs to AAAs in population-based studies has decreased, suggesting separable risk factors. Since these initial studies, the divergence of etiologic factors has been more convincingly demonstrated. For example, using a cohort of 341 patients referred for aneurysm surgery, Ito et al elegantly demonstrated a clear enrichment of dyslipidemia, atherosclerosis, and coronary artery disease in patients with AAA versus a combinatorial group of TA. In contrast, differences between aneurysms within the thorax have received less attention. Although expert opinion has held that ascending thoracic aortic aneurysms (AAs) and descending thoracic aortic aneurysms (DTAs) likely have different origins, there has been scant experimental evidence to support these conclusions. This study aims to evaluate the differences in patient characteristics and outcomes among 3 groups of patients: those with isolated AAs, those with isolated DTAs, and those with both AA and DTA or mixed thoracic aortic aneurysms (MTA).
Methods
Patients treated in the Thoracic Aortic Center at Massachusetts General Hospital are prospectively registered in our institutional database, which records baseline patient characteristics, aortic interventions, and follow-up outcomes. We identified 3,247 adult patients (age ≥17 years) with TA who were diagnosed from July 1992 to August 2013. We searched for computed tomography (CT) or magnetic resonance imaging (MRI) of the aorta. Aortic diameters were measured at ascending, arch, descending thoracic, and thoracoabdominal segments of the aorta. Diameters were recorded for analyses if ≥40 mm. Patients were excluded if they had no thoracic aortic segment with a diameter of ≥40 mm or if there was evidence of preexisting aortic dissection, aortic repair, intramural hematoma, or aortitis.
Patient groups were assigned by the location of maximal aortic dimension. The ascending thoracic aorta was defined as the segment between the aortic valve and the right brachiocephalic artery (i.e., both the aortic root and tubular portion of the ascending aorta). The descending aorta was defined as the segment between the ostium of the left subclavian artery and the diaphragm. The AA group was defined as those with an ascending aortic diameter ≥40 mm but no other segment ≥40 mm. The DTA group was defined as those with a descending aortic diameter ≥40 mm but no other segment ≥40 mm. The MTA group was defined as those with both ascending and descending aortic diameters of ≥40 mm. Isolated aneurysm of the aortic arch was excluded from analysis.
Aortic aneurysms secondary to overtly identifiable genetic influence including bicuspid aortic valve (BAV) associated TA and transforming growth factor beta (TGFβ) vasculopathies, such as Marfan syndrome (MFS) or Loeys-Dietz syndrome, were identified by examination of the medical records. The primary end point was defined as a composite of adverse aortic events that include acute aortic dissection, rupture, and sudden death not explained by causes other than aortic diseases. Kaplan–Meier estimate of potential follow-up (median follow-up) of the cohort (40 months) was determined as previously described. Patients who underwent elective aortic surgery before the aortic events or who died of causes other than aortic disease were regarded as censored at the time of such events. Abdominal aortic aneurysm (AAA) was defined as an infrarenal aortic diameter of ≥40 mm. Aortas were examined for mural atheroma (significant luminal irregularity) or mural calcification. Patients were designated as having aortic atherosclerosis if significant luminal irregularity or calcifications were identified in the aortic wall on these studies.
R statistical software, version 3.1.2, was used for statistical analyses. Categorical variables are presented as frequencies and percentages, and continuous variables are expressed as mean ± SD. Demographic variables were analyzed with the Student t test or analysis of variance, as appropriate. Kaplan–Meier curves were plotted to display conditional probability of adverse aortic events and log-rank tests were used to compare between-group differences in the rates. To determine independent risk factors of adverse aortic events, the Cox proportional hazards models were used. Variables with a p value of ≤0.20 in univariate analyses were candidates for the multivariate Cox models, which involved a stepwise backward elimination technique and only variables with a p value of <0.10 were used in the final model. All reported p values were 2-sided, and a value of p <0.05 was considered statistically significant.
Results
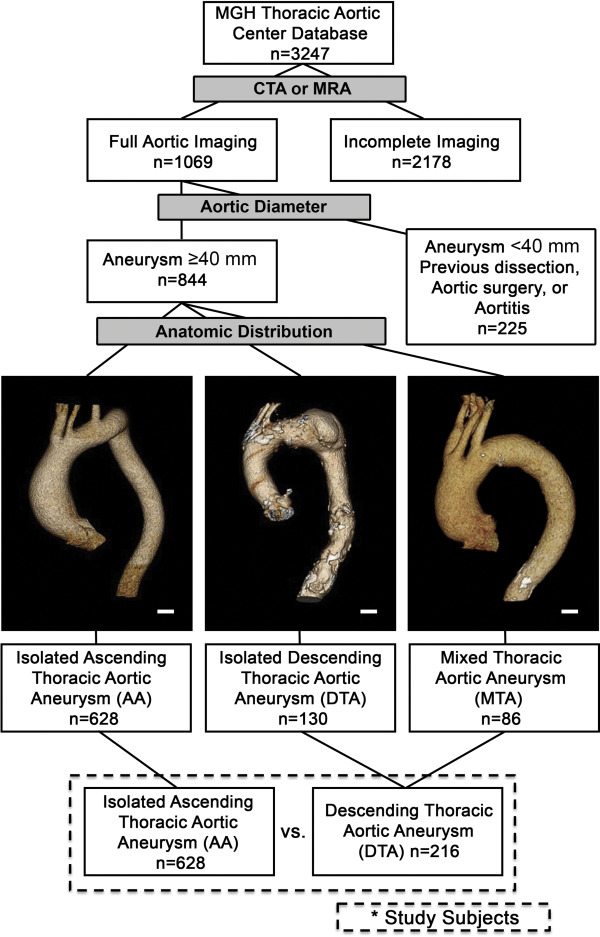
The study strategy is illustrated in Figure 1 . Full aortic imaging was available on 844 patients with no evidence of aortic dissection, intramural hematoma, or aortitis. The total study group was divided based on the pattern of aneurysm location. Table 1 displays baseline demographics and clinical characteristics for all patients. Interestingly, patients with MTA were almost indistinguishable from DTA, whereas patients with AA showed distinct differences from DTA and MTA in almost all examined categories. Compared with DTA, patients with AA were younger, less likely to be women, and less likely to have diabetes mellitus, hypertension, and a history of smoking. These differences were reflected in significantly higher rates of antihypertensive medication use in the DTA group ( Supplementary Table 1 ). A history of previous coronary artery bypass grafting (CABG) was less common in the AA group than in the DTA or MTA groups. TGFβ vasculopathies and BAVs were markedly enriched in the AA group versus either the DTA or MTA groups. It has been hypothesized that patients with genetically triggered aortic disease may be identified earlier than those with sporadic disease based on either anthropomorphic manifestations (e.g., as seen in MFS) or physical examination findings such as a heart murmur (e.g., as with BAV). To determine if the observed demographic differences in patient groups were attributable to the influence of overtly identifiable genetically triggered disease and early referral, we reanalyzed the groups excluding the diagnosis of BAV and TGFβ vasculopathies. Interestingly, differences in age, as well as in rates of diabetes mellitus, hypertension, and CABG remained statistically significant after censor of these diagnoses ( Table 2 ). Because the demographics of patients with MTA and DTA were essentially indistinguishable, these groups were combined for further analysis into a single DTA/MTA group ( Figure 1 ).
| Variable | AA n=628 | DTA n=130 | MTA n=86 | AA vs. DTA P value | DTA vs. MTA P value | AA vs. MTA P value |
|---|---|---|---|---|---|---|
| Age (years ± SD) | 60.3 ± 13.4 | 72.0 ± 11.1 | 74.0 ± 9.1 | <0.001 | 0.2 | <0.001 |
| Body Mass Index ∗ (kg/m 2 ± SD) | 28.0 ± 5.5 | 25.5 ± 5.4 | 26.8 ± 7.3 | <0.001 | 0.2 | 0.2 |
| Body Surface Area ∗ (m 2 ± SD) | 2.0 ± 0.3 | 1.8 ± 0.2 | 1.9 ± 0.2 | <0.001 | <0.001 | <0.001 |
| Female | 188 (30%) | 79 (61%) | 43 (50%) | <0.001 | 0.1 | <0.001 |
| Bicuspid Aortic Valve | 192 (31%) | 0 | 5 (1%) | <0.001 | <0.05 | <0.001 |
| TGFβ vasculopathies | 22 (4%) | 0 | 0 | <0.05 | N/A | 0.2 |
| Hypertension | 371 (59%) | 106 (82%) | 69 (80%) | <0.001 | 0.8 | <0.001 |
| Diabetes Mellitus | 32 (5%) | 16 (12%) | 11 (13%) | <0.001 | 0.8 | <0.001 |
| Smoking history | 279 (44%) | 92 (71%) | 67 (78%) | <0.001 | 0.1 | <0.001 |
| Coronary Artery Bypass Grafting | 62 (10%) | 19 (15%) | 19 (22%) | 0.1 | <0.001 | <0.001 |
| Abdominal Aortic Aneurysm | 5 (1%) | 87 (67%) | 44 (51%) | <0.001 | <0.001 | <0.001 |
| Aortic Arch Diameter (mm) | 31 ± 5.0 | 29 ± 5.0 | 34 ± 5.1 | <0.003 | <0.001 | <0.001 |
| Aortic Arch Diameter >40mm | 5% | 2% | 9% | 0.3 | 0.1 | 0.3 |
∗ Note that data available on the following subsets of patients AA, n = 491; DTA, n = 87; MTA, n = 41.
| Variable | AA n=416 | DTA n=130 | MTA n=81 | AA vs. DTA P value | DTA vs. MTA P value | AA vs. MTA P value |
|---|---|---|---|---|---|---|
| Age (years ± SD) | 64.0 ± 12.6 | 72.1 ± 11.1 | 74.3 ± 8.0 | <0.001 | 0.1 | <0.001 |
| Body Surface Area ∗ (m 2 ± SD) | 2.0 ± 0.3 | 1.8 ± 0.2 | 1.9 ± 0.2 | <0.001 | <0.05 | 0.1 |
| Female | 137 (33%) | 79 (61%) | 42 (52%) | <0.001 | 0.2 | <0.001 |
| Hypertension | 267 (64%) | 106 (82%) | 65 (80%) | <0.001 | 0.8 | <0.001 |
| Diabetes Mellitus | 23 (6%) | 16 (12%) | 11 (14%) | <0.05 | 0.7 | <0.05 |
| Smoking History | 196 (47%) | 92 (71%) | 64 (79%) | <0.001 | 0.1 | <0.001 |
| Coronary Artery Bypass Grafting | 38 (9%) | 19 (15%) | 17 (21%) | 0.1 | 0.2 | <0.05 |
| Abdominal Aortic Aneurysm | 4 (1%) | 87 (67%) | 42 (52%) | <0.001 | <0.05 | <0.001 |
∗ Note that data available on the following subsets of patients AA, n = 311; DTA, n = 60; MTA, n = 35.
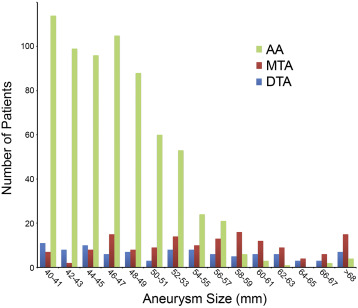
We next examined the aneurysm characteristics on CT and MRI to determine whether distinctions could be made between groups ( Table 3 ). There was a dramatically higher prevalence of atheroma and aortic calcium in the DTA/MTA group compared with the AA group. In general, maximal aortic diameters were larger in patients with DTA/MTA than AA ( Table 3 and Figure 2 ). To determine if the imaging and demographic differences we have observed were more closely related to aneurysm size instead of anatomic location, we analyzed variables in tertiles according to aneurysm diameter. The observed demographic differences ( Table 1 ) were found to persist regardless of aneurysm size tertile ( Supplementary Table 2 ).
| Variable | AA (n=628) | DTA (n=216) | P value |
|---|---|---|---|
| Mean of each patient’s maximum thoracic aortic diameter (mm ± SD) | 47±5 | 55±9 | <0.001 |
| Atheroma | 58 (9%) | 190 (88%) | <0.001 |
| Calcium | 50 (8%) | 173 (80%) | <0.001 |
Given that those with TAs are at risk of aortic dissection, aortic rupture, aortic repair, and death, we analyzed study groups with respect to occurrence of these adverse events ( Tables 4 and 5 ). Aortic repair occurred more than twice as often in those with DTA/MTA than those with AA ( Figure 3 ), with more than half the patients with DTA/MTA having undergone aortic repair within 5 years ( Figure 3 ). All-cause mortality was also significant greater in the DTA/MTA group compared with the AA group ( Figure 3 ).
| Surgical Procedure | AA (n=168) | DTA (n=138) |
|---|---|---|
| Ascending Aortic Graft | 115 (69%) | 10 (7%) |
| Arch Replacement | 41 (24%) | 7 (5%) |
| Thoracoabdominal Aortic Aneurysm Surgery | 1 ∗ (1%) | 63 (46%) |
| Thoracic Endovascular Aortic Aneurysm Repair | 2 (1%) | 57 (41%) |
| Valve Sparing Root Repair | 18 (11%) | 0 |
| Composite Valve Repair | 58 (35%) | 6 (4%) |
∗ A descending thoracic aneurysm developed in this patient after index scan.
| Variable | AA (n=628) | DTA (n=216) |
|---|---|---|
| Aortic Dissection or Rupture in Ascending Aorta | 7 (1%) | 0 |
| Aortic Dissection or Rupture in Descending Aorta | 0 | 17 (8%) |
| Fatal | 5 (1%) | 7 (3%) |
| Surgical Treatment of Aortic Event | 4 (1%) | 11 (5%) |
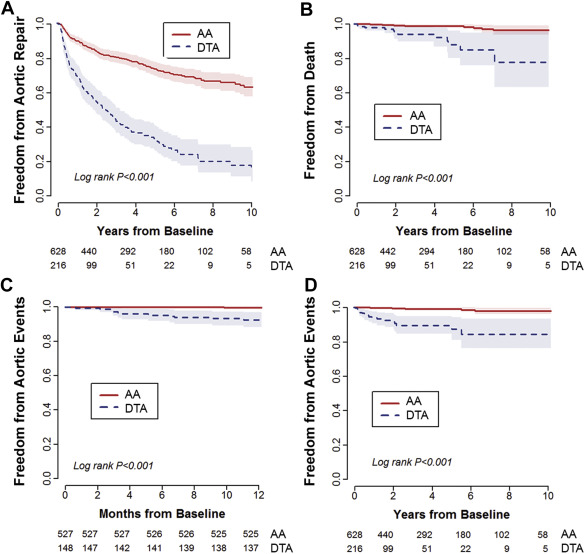
Overall adverse aortic event rates were similarly significantly higher in the DTA/MTA versus the AA groups ( Table 5 ), with the Kaplan–Meier curves separating as early as 1 year of follow-up ( Figure 3 ). Of acute aortic syndromes, those in the AA group suffered exclusively type A aortic dissection, whereas those in the DTA group suffered exclusively type B aortic dissection. Interestingly, patients with MTA suffered only type B aortic dissection. Table 6 summarizes the univariate and multivariate risk factor analyses of adverse aortic events based on aneurysm distribution. On multivariate analyses, maximal aortic diameter (hazard ratio [HR] 1.12) and atherosclerosis (atheroma ± aortic calcium; HR 5.7) emerged as significant independent predictors of aortic events. Freedom from aortic events versus these risk factors is depicted in Figure 4 .


