The coexistence of mitral regurgitation (MR) in patients with severe aortic stenosis (AS) is not infrequent and has been associated with adverse outcome. The aims of this study were to evaluate the change in MR severity and to identify the correlates of MR improvement in patients with severe AS and moderate to severe MR who underwent balloon aortic valvuloplasty (BAV). Patients with severe AS and at least moderate MR who underwent their first BAV procedures (n = 74) were divided into 2 groups: patients with improved- (n = 34 [46%]) and those without improved (n = 40 [54%]) MR after BAV on transthoracic echocardiography. The population had a mean age of 84 years and was more frequently female (63.5%), with a high risk profile (mean Society of Thoracic Surgeons score 15%, mean European System for Cardiac Operative Risk Evaluation score 57%). Baseline characteristics were balanced between the 2 groups. Patients with improved MR after BAV had smaller left atrial dimensions (45 ± 7 vs 49 ± 7 mm, p = 0.01) and lower peak aortic velocities (3.7 ± 0.6 vs 4.0 ± 0.8 m/s, p = 0.05) and mean transaortic valve gradients (33.2 ± 12.1 vs 40.6 ± 17.4 mm Hg, p = 0.05) at baseline. Left atrial dimension [odds ratio (OR) 3.37, p = 0.006], left ventricular end-diastolic dimension (OR 2.7, p = 0.04), and mean transaortic valve gradient (OR 1.04, p = 0.05), but not left ventricular systolic function or functional MR, were correlated with MR improvement by logistic regression analysis. In conclusion, nearly half of the patients with severe AS and coexistent MR showed improvement in the magnitude of MR after BAV. Larger left atrial and left ventricular end-diastolic dimensions and higher transaortic valve gradients were associated with lack of MR improvement.
Mitral regurgitation (MR) is frequently present in patients with aortic stenosis (AS), with an incidence up to 66%. The cause of MR in patients with severe AS is more commonly secondary to the AS (functional) than to intrinsic pathology of the mitral valve apparatus (organic). The coexistence of significant MR has been associated with adverse outcomes in patients with severe AS. In such patients, a double-valve operation might be required; however, this operation nearly doubles mortality compared to isolated surgical aortic valve replacement (SAVR). Improvement in MR after isolated SAVR has been reported in up to 40% to 80%, depending on the clinical series. The use of balloon aortic valvuloplasty (BAV) has significantly increased in the United States after the introduction of transcatheter aortic valve replacement (TAVR) technology. The changes in MR degree in patients with severe AS who undergo BAV and their predictors have not been previously described. The aims of this study were to evaluate by 2-dimensional echocardiography the changes in MR severity and to identify the correlates of MR improvement in patients with severe AS and coexistent moderate to severe MR who underwent BAV.
Methods
Patients who underwent BAV from January 2007 to December 2010 were initially considered (n = 428). Patients presenting with cardiogenic shock were excluded. From this initial cohort, patients with at least moderate MR and available transthoracic echocardiograms at baseline and early after BAV (<30 days after the procedure) were considered for this analysis (n = 74). All patients had severe, symptomatic AS confirmed by transthoracic echocardiography and hemodynamic evaluation. Patients were referred for BAV for palliation of heart failure symptoms as a bridge for TAVR, SAVR, or noncardiac surgery. Improvement in the degree of MR was defined as a reduction of ≥1 grade from the baseline to the follow-up echocardiographic study. The population was divided into 2 groups for comparison purposes: patients with improved MR degree after BAV and patients in whom MR degree did not improve after BAV. The Society of Thoracic Surgeons score and the logistic European System for Cardiac Operative Risk Evaluation score were calculated for all patients. In-hospital clinical events were determined from the review of medical records. All patients gave written consent for the BAV procedure, and the study was conducted under local institutional review board approval.
Diagnostic right-sided and left-sided cardiac catheterization was performed on all patients. Right-sided cardiac catheterization was performed using a 7Fr Swan-Ganz catheter. Cardiac output was determined by the thermodilution method. The procedure was performed under conscious sedation, and heparin was administrated in all patients (10 to 70 U/kg) after 9Fr to 13Fr sheath insertion in the femoral artery. BAV was performed according to standard techniques using the retrograde femoral approach. Equalization of pressures was documented before entering the left ventricle. The gradient was confirmed with pullback gradient measurements. Peak and mean gradients were measured, and aortic valve area was calculated using Gorlin’s formula. The balloon was sized 3 to 5 mm less than the minimal diameter of the sinotubular junction assessed by aortography in the left anterior oblique view with a marked pigtail. To stabilize the balloon position across the valve, the heart was paced at a high rate (180 to 200 beats/min) until blood pressure decreased to <50 mm Hg before inflation. Pacing was continued until the balloon was fully deflated. Additional BAV inflations were performed in patients in whom the mean gradients did not decrease significantly (>30%), and larger balloons were used in selected patients in whom the initial balloon size failed to significantly decrease gradients.
Transthoracic echocardiography was performed by 2 experienced echocardiographers using commercially available ultrasound systems. Baseline echocardiographic studies were performed on the same day as the procedure and after BAV, within a 30-day window, for follow-up. All patients underwent comprehensive examinations that included M-mode echocardiography, 2-dimensional echocardiography, and conventional and color Doppler before and after BAV, with patients in stable hemodynamic conditions. Using the parasternal long-axis view, left ventricular end-diastolic, left ventricular end-systolic, and left atrial dimensions were obtained. The left ventricular ejection fraction was estimated using the biplane Simpson’s method. AS severity was determined by aortic jet velocities and aortic valve area, which was calculated by the continuity equation (aortic valve area = left ventricular outflow tract area [left ventricular outflow tract velocity-time integral/valve velocity-time integral]). Following American Society of Echocardiography recommendations, integrating qualitative and quantitative assessment, valve insufficiency was graded as none (0), mild (I), moderate (II), or severe (III). Additionally, the category of moderate mitral insufficiency was subclassified into moderate and moderate to severe, following the recommendations of the American Society of Echocardiography. Improvement in the degree of valve insufficiency was defined as a decrease of ≥1 grade from the baseline to the follow-up echocardiogram. The mechanism of MR was classified as organic or functional. MR was defined as organic in the presence of structural or leaflet pathology (e.g., prolapse, ruptured chordae tendineae, calcification of the leaflet, rheumatic involvement). MR was defined as functional in the absence of primary preexisting leaflet or chordae pathology. Because of the common presence of calcified mitral annuli in the elderly population with AS, patients with significant degrees of extension of calcium into or onto the leaflets in whom this was believed to prevent normal coaptation were classified as having organic MR. Patients in whom the degree of leaflet calcium was “minor” (limited to the basal third of the posterior leaflet and not interfering with leaflet mobility and coaptation) were classified as having functional MR.
Continuous variables are presented as mean ± SD and categorical variables as percentages. Differences between continuous variables were assessed using Student’s t test. Categorical variables were compared using chi-square or Fisher’s exact tests as indicated. Significance was set at p <0.05. Logistic regression analysis was used to examine the association of the relevant echocardiographic variables with MR improvement after BAV.
Results
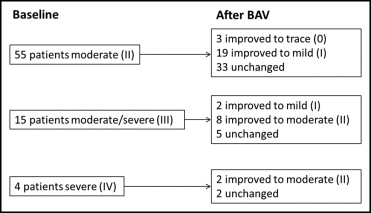
Among the 74 patients with severe AS and at least moderate MR, 34 (46%) had improved MR degree after BAV, and 40 (54%) did not have improved magnitude of MR after BAV ( Figure 1 ) . Baseline clinical and laboratory characteristics are listed in Table 1 . The population had a mean age of 84 years and was more frequently female (63.5%), with a high prevalence of co-morbidities as reflected by a mean Society of Thoracic Surgeons score of 15% and a mean logistic European System for Cardiac Operative Risk Evaluation score of 57%. Patients with improved degrees of MR after BAV were similar to those who did not show changes in the magnitude of MR after BAV in terms of baseline clinical characteristics and laboratory features, except for the prevalence of type 2 diabetes, which was significantly higher in patients with improved MR after BAV compared to those who did not improve (61.8% vs 27.5%, p = 0.006).
| Variable | MR Response to BAV | p Value | |
|---|---|---|---|
| Improved | Unchanged | ||
| (n = 34) | (n = 40) | ||
| Age (years) | 84.4 ± 6.7 | 83.9 ± 6.6 | 0.74 |
| Women | 20 (58.8%) | 27 (67.5%) | 0.59 |
| Society of Thoracic Surgeons score (%) | 14.7 ± 6.7 | 15.6 ± 6.9 | 0.57 |
| Logistic European System for Cardiac Operative Risk Evaluation score (%) | 54.1 ± 17.4 | 59.6 ± 18.6 | 0.22 |
| New York Heart Association class | |||
| IV | 20 (58.9%) | 28 (70.0%) | 0.45 |
| II and III | 14 (41.2%) | 12 (30.0%) | NA |
| Body mass index (kg/cm 2 ) | 24.6 ± 4.5 | 25.3 ± 9.4 | 0.36 |
| Type 2 diabetes mellitus | 21 (61.8%) | 11 (27.5) | 0.006 |
| Systemic hypertension ⁎ | 29 (85.3) | 38 (95.0%) | 0.31 |
| Hyperlipidemia | 27 (79.4%) | 32 (80.0%) | 0.99 |
| Chronic obstructive pulmonary disease | 11 (32.4%) | 8 (20.0%) | 0.35 |
| Chronic renal insufficiency | 18 (52.9%) | 21 (52.5%) | 0.84 |
| Previous cerebrovascular accident or transient ischemic attack | 7 (20.6%) | 8 (20.0%) | 0.82 |
| Atrial fibrillation | 21 (61.8%) | 17 (42.5%) | 0.16 |
| Peripheral vascular disease | 11 (32.4%) | 16 (40.0%) | 0.73 |
| Coronary artery disease | 21 (61.8%) | 26 (65.0%) | 0.99 |
| Previous coronary artery bypass grafting | 9 (26.5%) | 19 (47.5%) | 0.39 |
| Previous percutaneous coronary intervention | 5 (14.7%) | 8 (20.0%) | 0.78 |
| Previous myocardial infarction | 13 (38.2%) | 11 (27.5%) | 0.46 |
| Laboratory values | |||
| Hematocrit (%) | 34.9 ± 4.8 | 34.9 ± 5.1 | 0.95 |
| Hemoglobin (mg%) | 11.4 ± 1.6 | 11.2 ± 1.9 | 0.76 |
| Creatinine (mg/dl) | 1.9 ± 1.7 | 1.5 ± 0.8 | 0.20 |
| Troponin I (ng/ml) | 0.2 ± 0.2 | 0.2 ± 0.4 | 0.73 |
| N-terminal pro–brain natriuretic peptide (pg/ml) | 2,046.3 ± 1,151.2 | 1,887.8 ± 1,521.4 | 0.73 |
⁎ History of hypertension diagnosed and/or treated with medication or currently being treated with diet and/or medication by a physician.
Procedural characteristics are listed in Table 2 . Patients with improved MR after BAV had similar procedural characteristics to those who did not improve. Adjuvant percutaneous coronary intervention was performed in 16% of the overall population. The number of balloon dilatations, the sizes of the balloons used, and anticoagulation were similar between the 2 groups.
| Variable | MR Response to BAV | p Value | |
|---|---|---|---|
| Improved | Unchanged | ||
| (n = 34) | (n = 40) | ||
| BAV alone | 27 (79.4%) | 35 (87.5%) | 0.53 |
| Adjuvant percutaneous coronary intervention | 7 (20.6%) | 5 (12.5%) | NA |
| Contrast amount (cm 3 ) | 38.8 ± 40.7 | 53.9 ± 50.9 | 0.27 |
| Sheath size (Fr) | 11.5 ± 1.4 | 11.3 ± 1.4 | 0.56 |
| Balloon size (mm) | 23.2 ± 1.9 | 22.6 ± 1.8 | 0.18 |
| Number of dilatations | 1.7 ± 0.9 | 1.7 ± 0.9 | 0.89 |
| Heparin dose (U) | 2,927 ± 1569 | 2,684 ± 1348 | 0.50 |
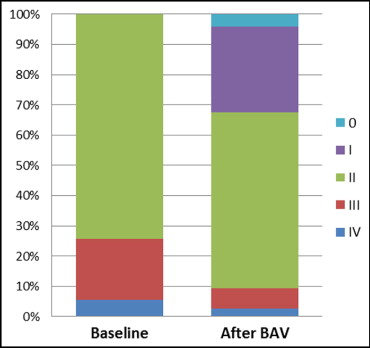
Figures 1 and 2 show the rate of MR magnitude before and after BAV, respectively, assessed by echocardiography. Echocardiographic follow-up was obtained a mean of 5.1 ± 6.4 days after BAV. The rate of severe and moderate to severe MR decreased from 26% to 9%, the rate of moderate MR decreased from 74% to 58%, and 32% of patients improved to mild or trace MR after BAV (p <0.001). Echocardiographic and invasive hemodynamic data values before and after BAV are listed in Table 3 . The baseline mitral, tricuspid and aortic regurgitation, right ventricular dysfunction, left ventricular ejection fraction, and systolic pulmonary pressure were similar between the 2 groups. Patients with improved MR compared to those without had similar rates of functional MR (55.9% vs 45%, p = 0.48), significantly smaller left atrial dimensions (45 ± 7 vs 49 ± 7 mm, p = 0.01), lower peak aortic velocities (3.7 ± 0.6 vs 4.0 ± 0.8 m/s, p = 0.05), and lower mean and peak transaortic valve gradients (33.2 ± 12.1 vs 40.6 ± 17.4 mm Hg, p = 0.05, and 53.7 ± 18.3 vs 66.5 ± 29.8 mm Hg, p = 0.03, respectively) at baseline. In addition, baseline left ventricular end-diastolic and left ventricular end-systolic trended to be larger in patients without improved degrees of MR after BAV compared to those with improvement, but these differences did not reach statistical significance. All significant baseline echocardiographic differences remained in the 2 groups after BAV. Nevertheless, no differences were noted between the groups in terms of the variation magnitude of all these parameters. The aortic valve area increased at a mean of 23 ± 19% (25.1 ± 19.6% in patients with improved MR vs 21.9 ± 18.1% in those without improved MR, p = 0.46), the peak and mean transaortic valve gradients decreased at a mean of 14.2 ± 16.1 mm Hg (15.0 ± 12.8 mm Hg in patients with improved MR vs 13.5 ± 18.6 mm Hg in those without changes after BAV, p = 0.71), and 8.7 ± 10.5 mm Hg (10.0 ± 8.8 mm Hg in patients with improved MR vs 7.6 ± 11.8 mm Hg in those without improvement, p = 0.37), respectively. In addition, the observed increase in the mean left ventricular ejection fraction (2 ± 24%) and mean decrease in systolic pulmonary pressure (5.5 ± 13.7 mm Hg) were similar between the 2 groups (p = 0.34 and p = 0.46, respectively). Interestingly, the rate of postprocedural moderate to severe aortic regurgitation trended to be numerically higher in patients without improved MR degrees as opposed to those who improved (22.5% [8 moderate, 1 severe] vs 8.8% [3 moderate], p = 0.11).