Adapted from the 2011 ACCF/AHA Focused Update of the Guidelines for the Management of Patients with Peripheral Arterial Disease (Rooke TW, et al. 2011 ACCF/AHA focused update of the guideline for the management of patients with peripheral artery disease (updating the 2005 guideline): A report of the American College of Cardiology Foundation/American Heart Association Task Force on Practice Guidelines: Developed in collaboration with the Society for Cardiovascular Angiography and Interventions, Society of Interventional Radiology, Society for Vascular Medicine, and Society for Vascular Surgery. Catheter Cardiovasc Interv 2012;79(4):501–531.)
Patient Preparation, Technique, and Protocol
The patient should be resting supine for 5 to 10 minutes prior to commencing the examination. The ABI is obtained by comparing the blood pressure (BP) in the lower extremities (ankles) with the BP in the upper extremities (brachial arteries). In healthy individuals, pulse wave reflection and peripheral BP augmentation cause the ankle systolic BP to be 10 to 15 mm Hg higher, on average, than the brachial artery systolic pressure. Therefore, the normal ABI is greater than 1.00. Lower ABIs indicate the presence of lower extremity atherosclerotic plaques causing a drop in lower extremity pressures, and thus the ABI varies inversely with PAD severity.
The first step in the examination is to sequentially obtain the systolic BP from both brachial arteries using a stethoscope and calibrated sphygmomanometer. If the brachial BPs differ by more than 10 mm Hg, bilateral brachial BPs should be obtained simultaneously by two examiners. If the brachial BP difference persists on simultaneous measurements, this may indicate the presence of subclavian or axillary artery occlusive disease and should be reported. The higher of the two brachial BPs should be used as the denominator for the ABI calculations.
Following documentation of the brachial BP, the examiners should turn their attention to recording of the ankle systolic BPs (Fig. 26.1). For optimal lower extremity pressure measurement, BP cuffs should be appropriately sized for the patient’s lower calf (immediately above the ankles); the width of the cuff should be at least 20% greater than the diameter of the limb. A 5- to 10-MHz handheld Doppler should be used, and a clear arterial pulse signal should be heard. The cuff is then inflated to at least 20 mm Hg above the point where the Doppler sounds disappear and then slowly deflated until the Doppler sounds reappear. The BP at which the Doppler signal of the arterial pulse reappears is the systolic BP for that vessel. For each leg, systolic BPs should be documented for both the dorsalis pedis and posterior tibial arteries, and the higher BP of the two pedal arteries should be used in the numerator for ABI calculation. For example, in a patient with a right brachial systolic BP of 100 mm Hg, a left brachial systolic BP of 90 mm Hg, a right dorsalis pedis systolic BP of 70 mm Hg, and a right posterior tibial systolic BP of 80 mm Hg, the right lower extremity ABI is calculated as 80 mm Hg/100 mm Hg = 0.80. ABI values should be reported to the second decimal.
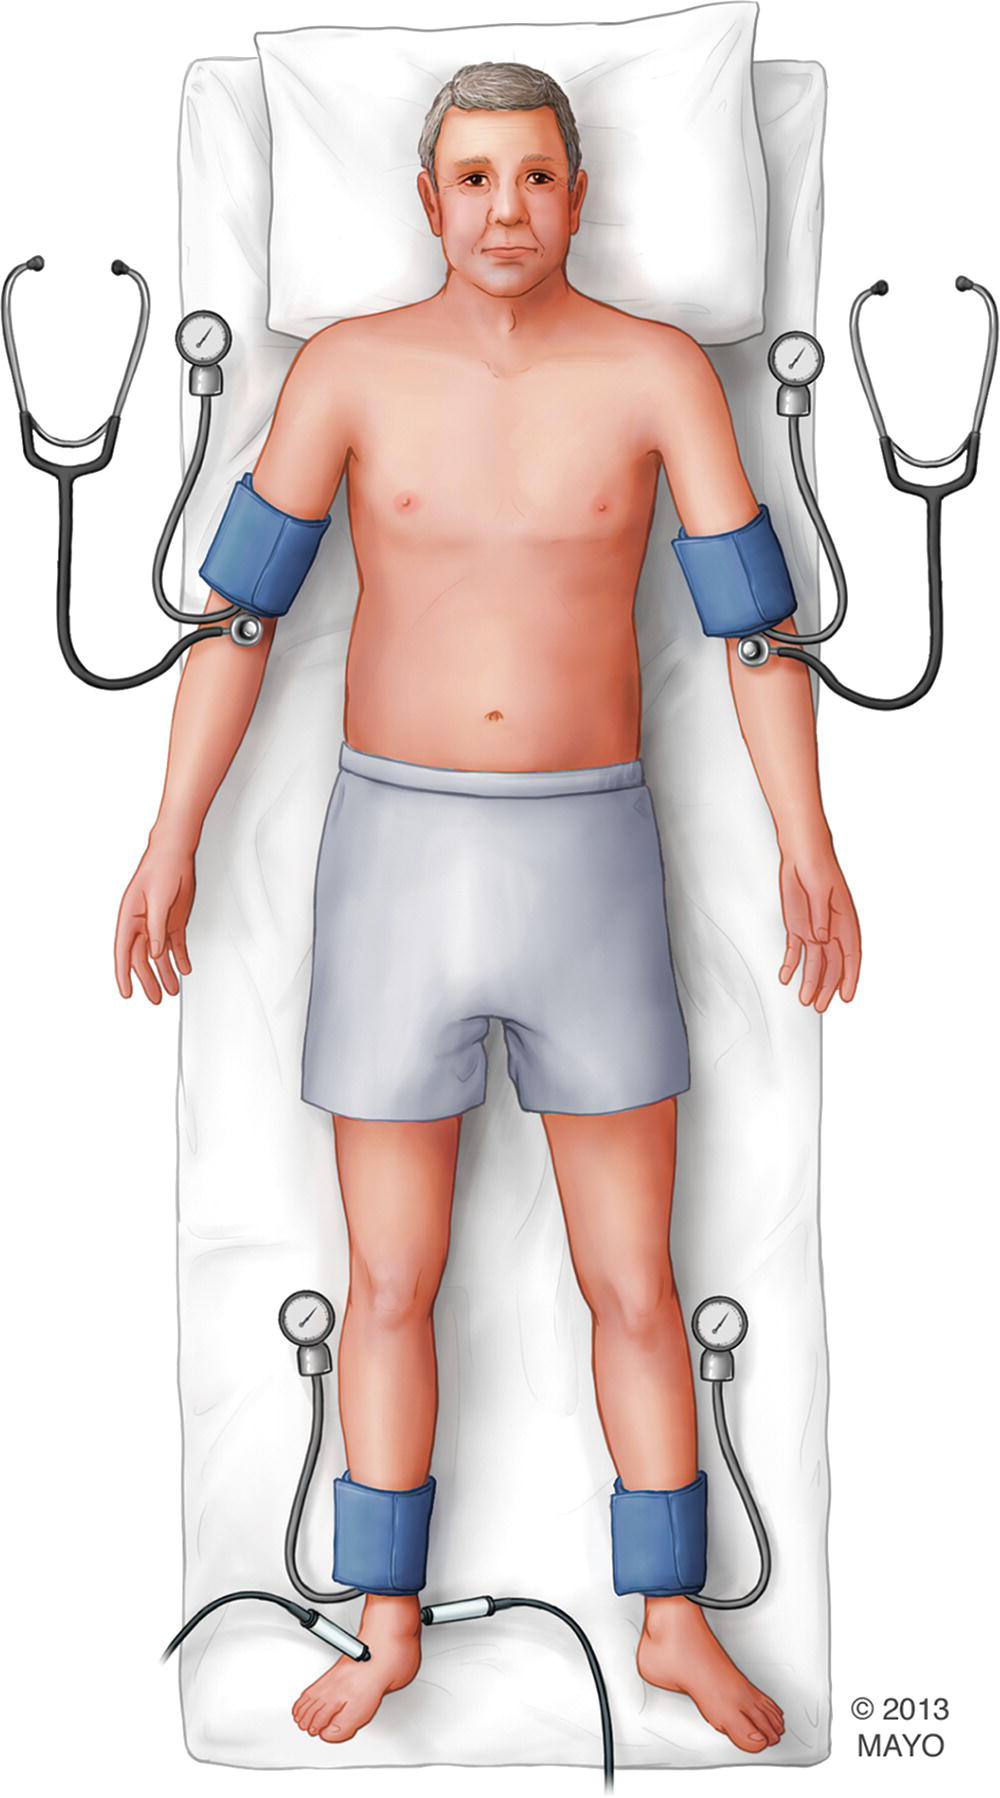
FIGURE 26.1. Calculation of the ABI. While the patient lies supine, a brachial BP is obtained sequentially in the right and left upper extremities. The higher of the two brachial BPs should be used for ankle-brachial index (ABI) calculation. With cuffs applied to the ankles, a 5- to 10-MHz handheld Doppler is used to measure systolic BP at the dorsalis pedis (DP) and posterior tibial (PT) arteries in both lower extremities. For each leg, the higher of the DP and PT pressures is used for ABI calculation.
Postexercise Ankle-Brachial Index
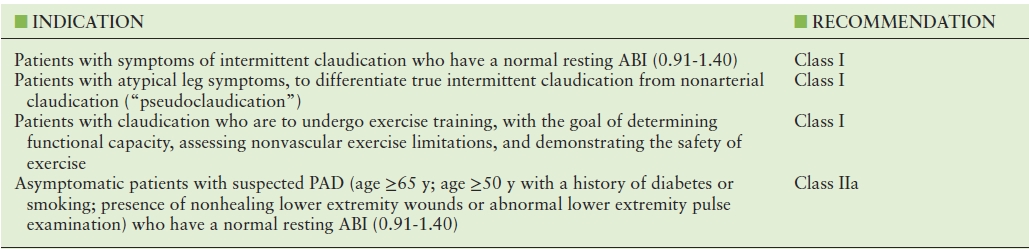
In a subset of patients with PAD, the resting ABI may be normal. In other patients who have atypical leg symptoms, differentiation of true claudication from pseudoclaudication is warranted. In these cases, measurement of ABI postexercise is helpful. Indications for postexercise ABI are outlined in Table 26.2. From a risk assessment standpoint, obtaining a postexercise ABI is recommended in asymptomatic patients with suspected PAD (see Table 26.1) who have a normal or borderline normal resting ABI (0.91 to 1.40). The resting ABI may fail to document PAD in some patients with mild to moderate disease. In such cases, obtaining postexercise ABIs increases the sensitivity of the test.
TABLE 26.2 Indications for Measuring the Postexercise Ankle-Brachial Index
Adapted from the 2011 ACCF/AHA Focused Update of the Guidelines for the Management of Patients with Peripheral Arterial Disease (Rooke TW, et al. 2011 ACCF/AHA focused update of the guideline for the management of patients with peripheral artery disease (updating the 2005 guideline): A report of the American College of Cardiology Foundation/American Heart Association Task Force on Practice Guidelines: Developed in collaboration with the Society for Cardiovascular Angiography and Interventions, Society of Interventional Radiology, Society for Vascular Medicine, and Society for Vascular Surgery. Catheter Cardiovasc Interv 2012;79(4):501–531.)
Assessment of postexercise ABIs should follow the measurement of resting baseline ABIs. Exercise is performed using a motorized treadmill, and protocols used are less strenuous than are those implemented for assessment of coronary artery disease. Different exercise protocols have been reported.11,12 In the Mayo Clinic vascular laboratory, patients walk on a treadmill at a steady speed of 2 mph at a 10% grade for 5 minutes or until development of limiting symptoms, whichever comes first. If patients cannot walk at 2 mph, alternative protocols using steady lower speeds (1 or 1.5 mph) are used. Patients should be instructed to walk until maximally tolerated symptoms. Additional information that can be obtained from the exercise test includes: total walking time and distance, time and distance walked before development of leg symptoms (initial claudication distance), laterality of symptoms and muscle groups involved, and presence of nonclaudicatory symptoms such as angina, dyspnea, palpitations, joint pain, or generalized fatigue. Concomitant electrocardiogram (ECG) monitoring allows identification of cardiac arrhythmias or myocardial ischemia. If significant arrhythmias or marked signs of myocardial ischemia (i.e., ST-segment depression >2 mm in ≥2 contiguous leads) occur, the test should be interrupted regardless of leg symptoms.
If measurement of postexercise ABI is indicated but patients are unable to walk on the treadmill (e.g., due to balance problems), up to 50 standing plantar flexions can be performed instead,13 and the ABI should be repeated immediately following exercise as described above.
Reporting, Normal Values, and Abnormal Findings
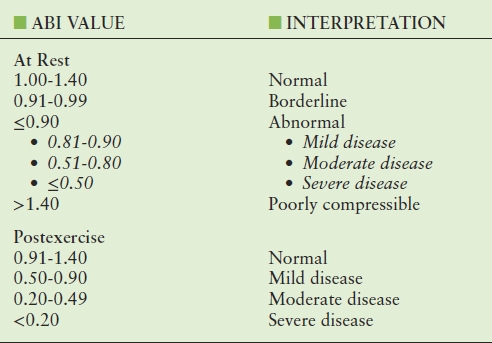
ABIs should be reported according to the recommendations from the 2011 ACCF/AHA Focused Update of the Guidelines for the Management of Patients with Peripheral Arterial Disease,10 as outlined in Table 26.3. A special comment should be made about patients with ABI values >1.40. In patients with stiff, calcified leg arteries that cannot be compressed by the ankle BP cuff (such as seen in the elderly, diabetics, or those with chronic renal insufficiency), pedal systolic BPs will be very high (>240 mm Hg), causing the ABI to exceed 1.40. In such patients with poorly compressible arteries, the risk of death is high, even higher than that observed among patients with documented PAD (ABI ≤ 0.90) (Fig. 26.2).14
TABLE 26.3 Interpretation of the Ankle-Brachial Index
ABI, ankle-brachial index.
Adapted from the 2011 ACCF/AHA Focused Update of the Guideline for the Management of Patients with Peripheral Arterial Disease (Rooke TW, et al. 2011 ACCF/AHA focused update of the guideline for the management of patients with peripheral artery disease (updating the 2005 guideline): A report of the American College of Cardiology Foundation/American Heart Association Task Force on Practice Guidelines: Developed in collaboration with the Society for Cardiovascular Angiography and Interventions, Society of Interventional Radiology, Society for Vascular Medicine, and Society for Vascular Surgery. Catheter Cardiovasc Interv 2012;79(4):501–531.)
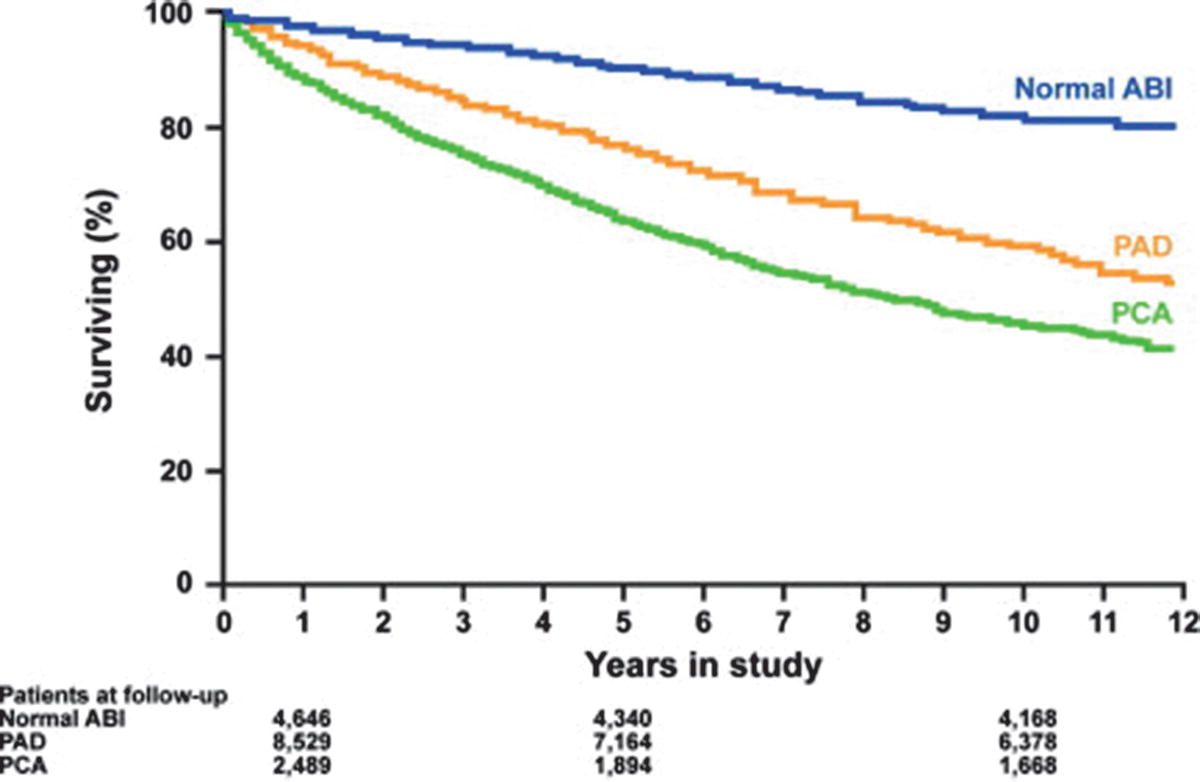
FIGURE 26.2. Risk of mortality based on the ankle-brachial index (ABI) in patients referred for noninvasive lower extremity evaluation. Among patients referred for lower extremity evaluation, those with peripheral arterial disease (PAD; ABI < 0.9) had a higher risk of mortality than those with a normal ABI. In addition, patients with poorly compressible arteries (PCA; ABI > 1.40) had the highest risk of mortality.
(Adapted with permission from Arain FA, et al. Survival in patients with poorly compressible leg arteries. J Am Coll Cardiol 2012;59(4):400–417.)
In addition, gender and race differences in ABI have been previously demonstrated and should be recognized, especially when reporting “borderline abnormal” ABI values. The ABI is lower in African Americans than in non-Hispanic white individuals15–17 and in women than in men.17 Applying a single cut-off value for normality in large population studies may lead to overestimation of the prevalence of PAD in women and in African-Americans.
CAROTID INTIMA-MEDIA THICKNESS
Historically, arterial disease has been evaluated by the presence of atherosclerotic plaques and luminal narrowing. However, such an approach only allows identification of patients with established disease in whom lifestyle and pharmacologic measures are less likely to prevent development of CV events. The mechanisms leading to thickening of the arterial wall are not fully understood, but increased CIMT is thought to represent arterial aging and may be related to intimal or medial hypertrophy or a combination of both, as an adaptive response to changes in flow, wall tension, or lumen diameter.18 Since atherosclerosis is a complex process that begins in the arterial wall, the process leading to intimal thickening is thought to be similar, although not identical, to that underlying atherosclerosis.19 This is the basis for the assessment of CIMT, which is an ultrasound-based, sensitive, well-validated, and reproducible technique that can be used for the purpose of CV risk assessment and stratification.
Greater CIMT is associated with CV risk factors20 and has been shown to be independently associated with a higher risk of adverse CV events. In the Atherosclerosis Risk in Communities (ARIC) study, patients with extreme CIMT values (>1 mm) had a much higher (unadjusted) risk of stroke (hazard ratios of 8.5 in women and 3.6 in men)21 and MI (hazard ratios of 5.1 in women and 1.9 in men)22 after 6 to 9 years when compared to those with CIMT <0.6 mm. Similar associations of CIMT with MI and stroke were also observed in the Cardiovascular Health Study23 and in the Rotterdam Study.24 Based on these findings, CIMT can be performed to refine risk stratification in asymptomatic patients with intermediate risk of CV events.25 Indications for measuring CIMT are outlined in Table 26.4. Of note, assessment of CIMT is not of value in patients with established atherosclerotic disease or if the results would not be expected to change clinical management. In addition, there is great interest in assessing CIMT for measuring atherosclerosis progression or regression, but at this time, serial studies of CIMT to monitor disease in clinical practice are not recommended.
TABLE 26.4 Indications for Measuring Carotid Intima-Media Thickness
aRecommendation by the ACCF/AHA guideline for assessment of cardiovascular risk in asymptomatic adults (Greenland, P, et al. 2010 ACCF/AHA guideline for assessment of cardiovascular risk in asymptomatic adults: a report of the American College of Cardiology Foundation/American Heart Association Task Force on Practice Guidelines. Circulation 2010;122(25):e584–e636.)
bRecommendation by the Consensus Statement from the American Society of Echocardiography Carotid Intima-Media Thickness Task Force (Stein JH, et al. Use of carotid ultrasound to identify subclinical vascular disease and evaluate cardiovascular disease risk: a consensus statement from the American Society of Echocardiography Carotid Intima-Media Thickness Task Force. Am Soc Echocardiogr 2008;21(2):93–111; quiz 189–190.)
Patient Preparation, Technique, and Protocol
The patient should be lying supine on the examination table with the head slightly tilted toward the opposite side of the carotid artery being examined, while the sonographer is positioned at the head as shown in Figure 26.3. The study should be performed at a standard depth of 4 cm (or higher for patients with thicker necks) using a state-of-the-art ultrasound machine that possesses a linear array transducer with a minimal fundamental frequency of 7 MHz and capable of storing digital images. B-mode imaging is used, and zoom functions should be avoided in order to optimize image resolution.26

FIGURE 26.3. Proper scanning position for CIMT assessment. Patients lie supine on the examination table with their heads slightly tilted toward the opposite side of the carotid artery being examined while the sonographer is positioned at the head of the bed.
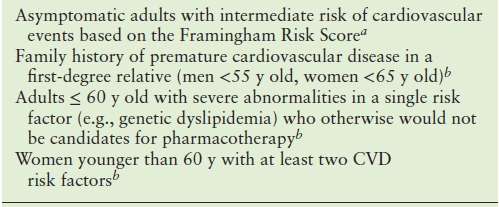
The first step in the examination is to screen the carotid arteries for the presence of atherosclerotic plaques, defined as areas of wall thickening measuring at least 1.5 mm, or ≥50% thicker than the surrounding walls.26 The sonographer should then image in the longitudinal plane that visualizes the common carotid artery (CCA) and carotid bulb bifurcating into internal and external carotid arteries, which is considered standard for CIMT assessment (Fig. 26.4). Transducer tilt and pressure as well as image focus and gain should be optimized so that “double lines” are seen in the near and far walls of the CCA (Fig. 26.5). This region should be imaged at three angles (anterior, posterior, and lateral) as indicated in Figure 26.6. A cine loop and three optimized R-wave gated still images of the longitudinal CCA should be obtained from each of these three imaging angles.
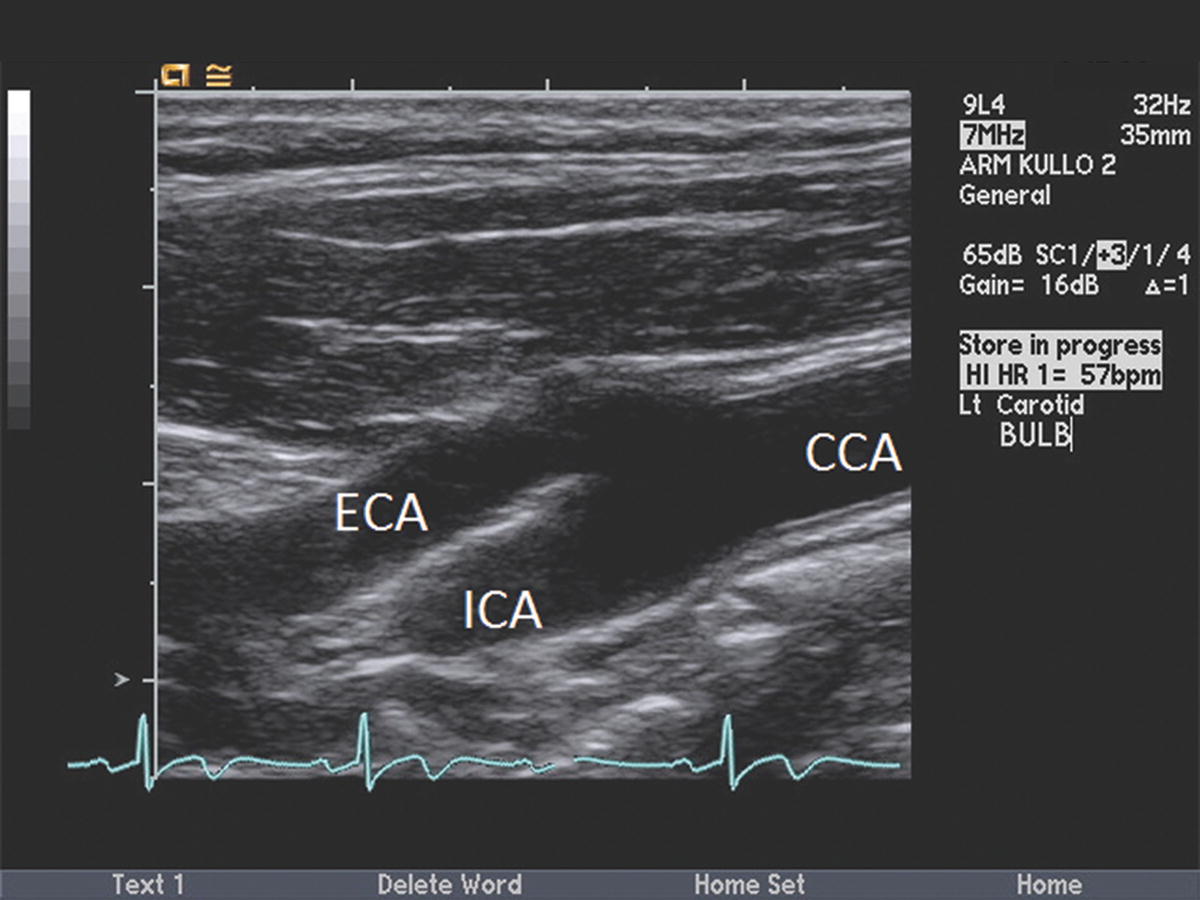
FIGURE 26.4. “Standard” longitudinal plane for CIMT assessment. Sonographers should identify the longitudinal plane that visualizes the common carotid artery (CCA) and carotid bulb bifurcating into internal (ICA) and external (ECA) carotid arteries.
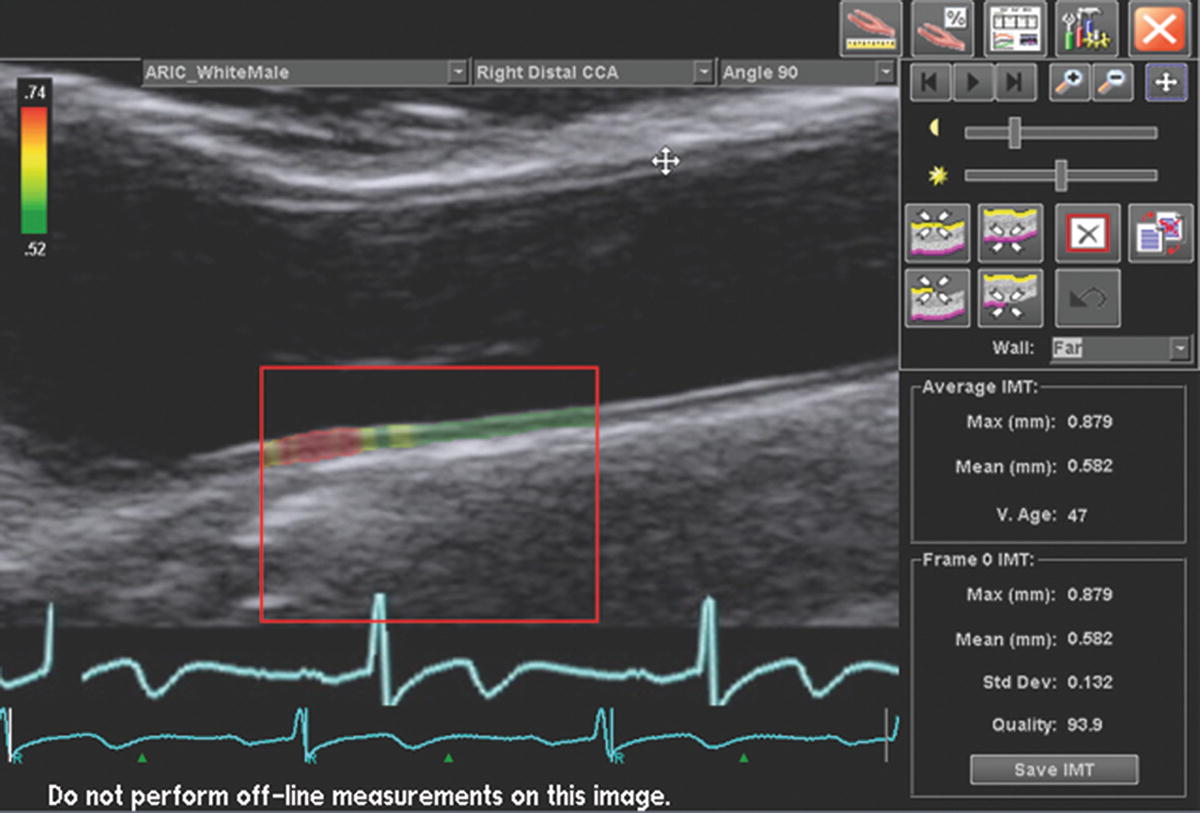
FIGURE 26.5. Carotid intima-media thickness measurement. Images should be optimized so that “double lines” are seen in the near and far walls of the CCA. Border detection software is preferred to achieve accurate measurements of CIMT.
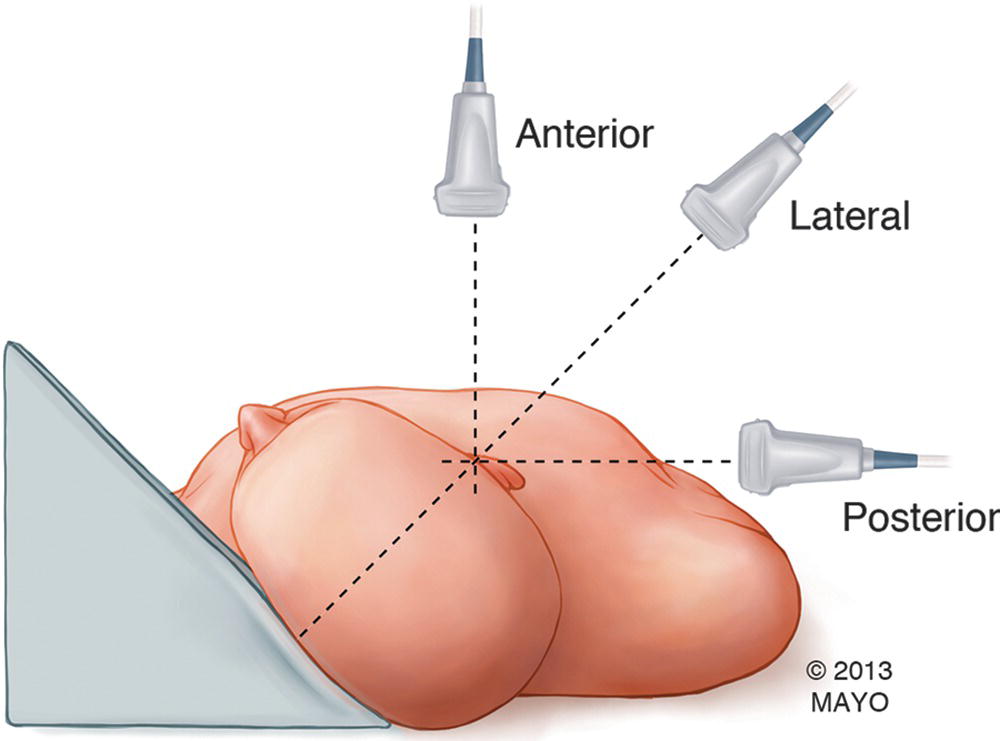
FIGURE 26.6. Angles for imaging the CCA for CIMT assessment. Each carotid artery should be imaged at three angles: anterior, posterior, and lateral.
The intima-media portion of the vessel wall starts at the luminal edge of the artery and ends at the boundary between the media and the adventitia. The image that most clearly depicts the interface between blood and the intima-media portion of the vessel wall (“double line”) should be chosen for analysis, and CIMT should be measured in the far wall of the distal 1 cm of the CCA using a leading edge-to-leading edge technique (Fig. 26.5). Three separate measurements of CIMT should be obtained (one from each imaging angle) and averaged to obtain a final value for each CCA. Although CIMT can be measured manually, use of semi-automated border detection software can improve reproducibility and reduce error and reading time.27
Reporting, Normal Values, and Abnormal Findings
A template for reporting CIMT studies has been recommended by the Consensus Statement from the American Society of Echocardiography Carotid Intima-Media Thickness Task Force28 and is depicted in Table 26.5. The report should include patient information, indication, standard statements, description of plaques and acoustic shadowing (if present), mean CIMT for each carotid artery, interpretation of the patient’s CV risk based on the CIMT values, and relevant incidental findings.
TABLE 26.5 Reporting of Carotid Intima-Media Thickness Studies for Cardiovascular Risk Assessment
Adapted from the Consensus Statement from the American Society of Echocardiography.
Carotid Intima-Media Thickness Task Force Endorsed by the Society for Vascular Medicine (Stein JH, et al. Use of carotid ultrasound to identify subclinical vascular disease and evaluate cardiovascular disease risk: a consensus statement from the American Society of Echocardiography Carotid Intima-Media Thickness Task Force. Am Soc Echocardiogr 2008;21(2):93–111; quiz 189–190.)
CIMT increases with age, even in the absence of atherosclerosis, and by age 90, CIMT is usually threefold greater than at age 20.29 In addition, CIMT varies based on race as well as between men and women. Thus, CIMT results need to be interpreted within the context of age, gender, and race. The age-specific CIMT percentiles recommended by the Consensus Statement from the American Society of Echocardiography Carotid Intima-Media Thickness Task Force are listed in Table 26.6.28 The CIMT values presented here were derived from the Multi-Ethnic Study of Atherosclerosis (MESA), but values obtained from other cohort studies can also be found in the Consensus Statement.
TABLE 26.6 Common Carotid Artery CIMT Values (in mm) According to Age, Sex, Race, and Percentiles
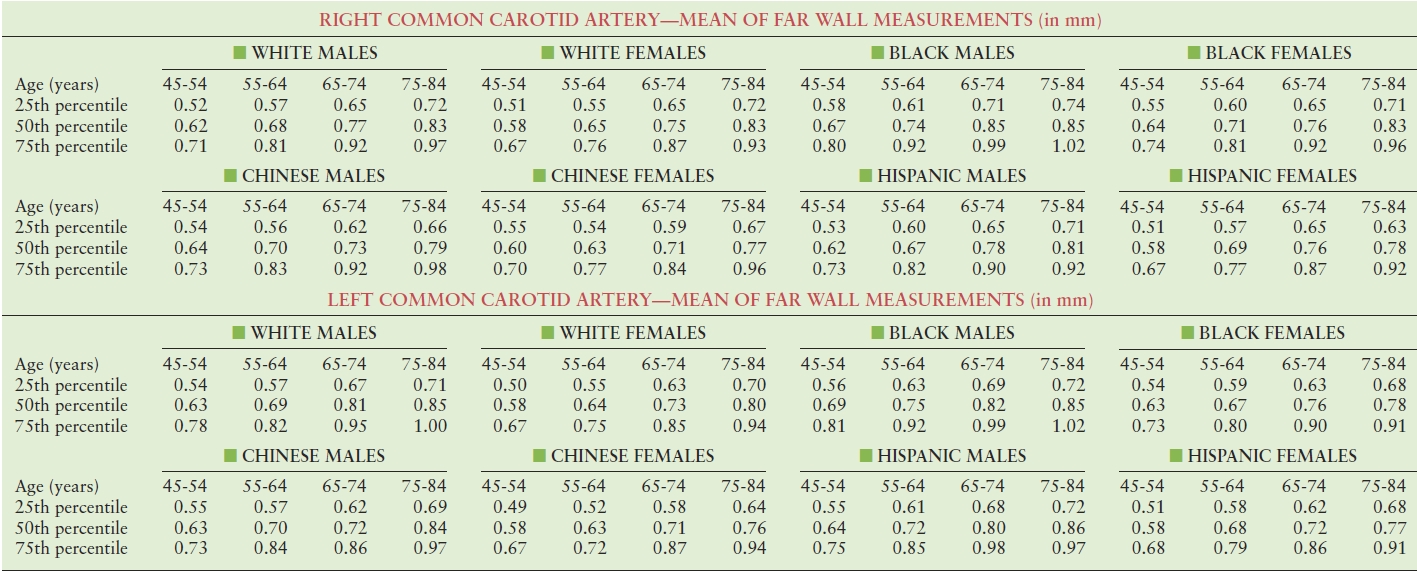
Values obtained from the Consensus Statement from the American Society of Echocardiography Carotid Intima-Media Thickness Task Force Endorsed by the Society for Vascular Medicine (Stein JH, et al. Use of carotid ultrasound to identify subclinical vascular disease and evaluate cardiovascular disease risk: a consensus statement from the American Society of Echocardiography Carotid Intima-Media Thickness Task Force. Am Soc Echocardiogr 2008;21(2):93–111; quiz 189–190.)
Each patient’s CIMT values should be interpreted and reported in terms of CV risk: CIMT values ≤25th percentile represent low CV risk, values between the 25th and 75th percentiles are indicative of average CV risk, and CIMT values ≥75th percentile are associated with high CV risk.
Limitations
Reliable measurement of CIMT requires extensive training and expertise. Technical issues such as body habitus or acoustic shadowing may preclude optimal visualization of the intima-media layer and lead to inaccurate CIMT measurements. There are also multiple protocols for CIMT assessment with different levels of complexity, different measurement sites and angles, and different methods of reporting. Strictly speaking, CIMT values can only be compared if they are obtained using the exact same protocol. The use of a semiautomated edge detection software/algorithm may potentially overestimate CIMT if the computer selects the wrong pixels for measurement. On the other hand, manual measurement of CIMT is subject to greater interobserver variability.30
ASSESSMENT OF ARTERIAL STIFFNESS
The aorta is an elastic reservoir that interacts directly with the heart and the end organs, and as such, its role in the human body extends beyond delivery of blood to the peripheral tissues. In individuals with compliant aortas, ventricular-arterial coupling is optimized, thereby maximizing ejection of blood from the left ventricle, while minimizing swings in BP. In addition, by buffering the ample pulsatile load generated by the left ventricle, the elastic aorta protects end organs from the deleterious effects of high pulsatility.31 The arterial flow pulse is composed not only of forward waves but also reflected pressure waves. With each cardiac cycle, a forward pressure wave is generated by the interaction of the left ventricle with the aorta and is propagated in the arterial wall along the arterial tree. At areas of impedance mismatch (such as branching points and arterioles), part of the pressure wave is reflected back toward the heart. In the setting of preserved aortic elasticity, the velocity of pulse transmission along the compliant arterial wall is low, and the timing and amplitude of reflected waves occur in such a way as to allow mild augmentation of the diastolic pressure at the level of the aortic root, thereby enhancing coronary artery perfusion. Thus, an elastic aorta maximizes the efficiency of the cardiovascular system and protects the end organs from excess pulsatility.
With aging, there is progressive stiffening of the aorta32 due to fatigue and fragmentation of elastic fibers and increased collagen deposition in the arterial wall. Aortic stiffening is further exacerbated in the presence of CV risk factors, especially hypertension, diabetes, and renal insufficiency.33 As the aorta stiffens, afterload (particularly pulsatile load) increases, leading to an imbalance in ventricular-arterial coupling.34 One consequence of this is an increased risk of heart failure, particularly heart failure with preserved ejection fraction.35,36 In addition, a stiffer aorta leads to greater variations in pressure during cardiac ejection, increasing pulse pressure and promoting the delivery of highly pulsatile energy to the end organs. This can be particularly deleterious in organs with high blood flow and low impedance, such as the brain and the kidneys. As such, increased arterial stiffness has been shown to be associated with target-organ damage.30,37,38
For these reasons, in the last decade, increasing attention has been given to the function and elastic properties of the aorta. Greater arterial stiffness is a predictor of adverse CV events,39,40 total and CV mortality,41,42 and is also associated with the incidence of heart failure,43 atrial fibrillation,44 cerebral small vessel disease,45 and cognitive decline.46,47 Furthermore, measuring arterial stiffness is useful in helping to more accurately classify CV risk.48,49 The European Societies of Cardiology and Hypertension currently recommend measuring arterial stiffness in all hypertensives, where the technique is available, in order to better assess risk of CV diseases and end-organ damage.50
Arterial stiffness can be measured in the peripheral and central (aorta) arteries, but since the aorta is the most compliant artery in the human body, its assessment is the most robust for risk assessment purposes. The carotid-femoral pulse wave velocity (cfPWV), also called aortic pulse wave velocity, can be measured by several techniques, but arterial tonometry is considered the gold standard for noninvasive measurement of aortic stiffness.51 This measurement requires relatively little technical expertise, is reproducible, and has the largest amount of evidence for predicting CV events.41 This parameter assesses the velocity of transmission of the pressure wave along the aortic wall, based on the principle that pulse wave velocity (PWV) varies directly with the stiffness of the arterial wall:

Stay updated, free articles. Join our Telegram channel

Full access? Get Clinical Tree


