Cardiac Investigations
Exercise ECG
A commonly used test involving a treadmill, blood pressure (BP) measurement, and continuous electrocardiograph (ECG) monitoring. Overall sensitivity for coronary heart disease is around 68% and specificity is 77%. This increases when considering prognostically significant disease, which has a sensitivity of 86%. The test improves to have a predictive accuracy of >90% in intermediate- to high-risk patients (older men with ischaemic symptoms). The test is of least value in populations that are least likely to be suffering from ischaemic heart disease; e.g. asymptomatic middle-aged women have a positive predictive value of <50%.
Indications
Diagnosis of ischaemic heart disease (IHD): intermediate- or high-probability IHD, vasospastic angina.
Post-myocardial infarction (MI): pre-discharge (submaximal test in days 4-7 to assess prognosis, decide upon exercise programme, and evaluate treatment), late post-discharge (symptom-limited 3-6 weeks).
Pre- and post-revascularization.
Evaluation of arrhythmias: optimizing rate-responsive pacemaker function, evaluation of known or suspected exercise-induced arrhythmias, and evaluation of treatment of above.
Contraindications
Fever/acute viral illness.
Myocarditis/pericarditis.
Severe aortic stenosis.
Aortic dissection.
Uncontrolled hypertension.
Overt cardiac failure.
Unstable angina or acute phase of MI.
Significant resting arrhythmia (e.g. uncontrolled atrial fibrillation or complete heart block).
Physical disability.
When to stop
Target heart rate achieved (tests have better sensitivity and specificity if the target heart rate is reached (>85% of 220 minus age in years for men or 210 minus age in years for women).
Worsening angina or excessive breathlessness.
Dizziness.
Fatigue/patient requests to stop.
Atrial arrhythmia other than ectopic beats.
Frequent ventricular ectopic beats or ventricular tachycardia (VT).
Worsening ST segment shift (elevation or depression) at least 2 mm depression but up to 5 mm depression.
BP fall or failure to rise.
Exaggerated hypertensive response to exercise (systolic blood pressure (SBP) >220 mmHg).
New high-grade atrioventricular (AV) block or bundle branch block.
Criteria for a positive test
|
Planar or downsloping ST depression of at least 1 mm 80 ms after the J point (junction between the QRS and ST segment).
ST elevation.*
Increase in QRS voltage (ischaemic left ventricular (LV) dilatation).
Ventricular arrhythmias.*
Typical ischaemic symptoms during exercise.
Inability to increase heart rate.
Causes of false-positive tests
Cardiomyopathies.
Hypertension.
LVOT (left ventricular outflow tract) obstruction.
Mitral valve prolapse syndrome.
Hyperventilation.
Electrolyte abnormalities (hypokalaemia).
Tricyclic antidepressants.
Syndrome X.
Coronary artery spasm.
Sympathetic overactivity.
National Institute for Health and Clinical Excellence (NICE) guidance 2010—chest pain of recent onset1
Historically, exercise ECG testing has been the cornerstone of investigation of patients presenting with stable anginal chest pain. However, sensitivity and specificity are poor compared with other investigations. Recent UK guidelines discouraged the use of exercise ECG in patients without known coronary artery disease.
Instead, NICE recommended cardiac computed tomography (CT) for patients with low likelihood of significant coronary artery disease, a functional test such as dobutamine or exercise echocardiography for those with intermediate likelihood, and invasive coronary angiography for those with high likelihood.
Cardiac computed tomography
In the past decade, major advances in CT technology have enabled cardiac CT to emerge as a non-invasive alternative to conventional invasive coronary angiography.
Coronary artery calcium scoring
Calcified coronary plaque represents approximately 20% of the total coronary artery plaque burden. Therefore, the degree of coronary calcification can be used as a surrogate for coronary artery atherosclerosis. A calcium score is obtained through a low-radiation unenhanced (i.e. no iodinated contrast) scan. The degree of calcification in each coronary vessel is then expressed as a figure and summed to give the total coronary artery calcium score, commonly using the Agatston scale. A score of 0 correlates with a low risk of coronary artery disease, whereas a score of >400 correlates with high risk of significant atherosclerotic plaque burden.
Clinical studies have shown that the calcium score provides additional information for cardiovascular risk stratification above and beyond traditional factors such as age, sex, hypertension, family history, hyperlipidaemia, and diabetes.
CT coronary angiography
CT coronary angiography is performed by injecting iodinated contrast into the peripheral veins. When the level of contrast in the aorta reaches a specified level, the scan is launched and images are acquired. The images are then analysed using computer software, which allows manipulation in two dimensions and three-dimensional (3D) reconstruction of the coronary arteries and cardiac chambers, also known as ‘volume rendering’.
Technical considerations
Temporal versus spatial resolution
The principal challenge to imaging the coronary arteries using CT is to achieve high temporal resolution. Temporal resolution is defined as the time taken to acquire an image. As the beating heart moves, it needs to be ‘frozen’ during image acquisition. Motion is greatest during systole, whereas the heart is relatively still during diastole. Images acquired during diastole are therefore most likely to be motion free, allowing accurate interpretation and diagnosis. A CT scanner must therefore be capable of acquiring images rapidly during the short diastolic phase when the heart is motionless.
Heart-rate control
The duration of systole is relative fixed at different heart rates, but the duration of diastole varies greatly. A slow heart rate (i.e. <65 bpm (beats per minute)) is preferable, to ensure motion-free imaging of the coronary arteries.
Oral beta-blockade given 1-2 h before the scan is widely used in the United States. Alternatively, intravenous beta-blockade with serial boluses of metoprolol administered to the patient on the CT gantry has been shown to be a safe, fast, and effective method of achieving optimal heartrate control. Premedication with two days of oral beta-blockers (to be taken the day before and on the day of the scan) is also effective and minimizes the need for administration of intravenous metoprolol at the time of the scan. Calcium-channel blockers are a practical alternative in patients with a contraindication to beta-blockers
Strategies for reducing radiation effective dose
A number of strategies have emerged to reduce the effective dose of ionizing radiation per scan:
reduction of field of view (‘carina to base of heart’)
tube voltage reduction in non-obese patients (from 120 kV down to 100 kV)
electrocardiographically controlled tube current modulation (current is reduced in systole and increased in diastole)
electrocardiographically controlled prospective gating (tube is only switched on at specific phase of the cardiac cycle, usually mid-diastole or 75% of the R-R interval).
Sensitivity and specificity
Modern 64-slice and above CT scanners have been shown to provide excellent sensitivity (95%) and specificity (83%). As a consequence, CT coronary angiography has a very high negative predictive value (upwards of 95%). The principal clinical application of CT coronary angiography is to rule out significant coronary artery disease in patients with low to intermediate cardiovascular risk.
Clinical applications of cardiac CT
Comparison with traditional invasive coronary angiography
Traditional cardiac catheterization remains the gold standard for diagnosing coronary artery disease. It has excellent temporal and spatial resolution and allows for intervention if significant disease is identified. However, it is invasive and exposes the patient to potential vascular complications, including MI, stroke, and vascular-access complications.
Comparison with functional tests
Historically, non-invasive functional tests (e.g. exercise tolerance testing, stress echocardiography, nuclear imaging, positron emission tomography (PET), perfusion magnetic resonance imaging (MRI)) have been used to select those patients deemed at intermediate risk who are likely to require invasive coronary angiography and intervention. However, many of these tests are labour intensive and not all are readily available in every hospital. In addition, the false-positive rate is substantial, leading to patients with normal coronary arteries undergoing unnecessary cardiac catheterizations.
Indications for cardiac CT
The principal role of cardiac CT in current clinical practice is to rule out or detect coronary artery disease. CT is particularly good at assessing anomalous coronary arteries and coronary artery bypass graft patency.
Additional indications
These include:
screening for coronary artery disease (i.e. calcium scoring).
detection of coronary artery disease in patients at low to intermediate risk.
assessment of coronary artery bypass grafts (CABGs).
assessment of anomalous coronary arteries.
pulmonary vein mapping prior to electrophysiological studies/ablations.
assessment of congenital heart disease anatomy.
evaluation of intracoronary masses.
evaluation of suspected aortic dissection.
assessment of coronary stent patency.
assessment of plaque morphology—soft/calcified/mixed.
Advantages and disadvantages of cardiac CT
Advantages
Fast.
Non-invasive (avoids vascular risks of invasive angiography).
Inexpensive.
Identifies CABG graft origin/target/patency.
Plaque characterization—i.e. ability to assess not just the vessel lumen but also the vessel wall (soft/calcified/mixed morphology).
Disadvantages
Ionizing radiation.
Difficult to interpret degree of stenosis if there is significant coronary calcification.
Difficult to see into stents and assess patency.
Difficult to interpret degree of stenosis at CABG graft anastamosis.
Requires regular and slow heart rates.
Future applications of cardiac CT
CT perfusion imaging
New CT techniques are now enabling integration of anatomical assessment of the coronary arteries with functional information. Intravenous contrast is injected and the myocardium is scanned repeatedly over a period of time. The first pass of contrast through a region of interest is tracked to produce tissue-specific time-density curves, which are then interpreted to determine blood flow within the tissue. However, using current CT technology, the predominant barrier to use of CT perfusion in routine clinical practice is high radiation doses.
Multimodality hybrid imaging
An alternative to CT perfusion imaging is integration of the anatomical information from CT angiography with the functional information from stress echocardiography, single photon emission computed tomography (SPECT), PET, or perfusion MRI. Clinical studies have shown that fusing functional and anatomical information increases the sensitivity and specificity when compared with each modality in isolation.
Transthoracic echocardiography
Introduction
Despite dramatic advances in new cardiac imaging technologies, echocardiography remains the most important diagnostic imaging tool in clinical practice. Since its development by Edler and Herz almost five decades ago, and routine clinical implementation a decade later, echocardiography has developed into an intuitive, comprehensible, and practical method to rapidly and repeatedly evaluate cardiac morphology and function. Competent interpretation of the echocardiographic examination first requires an understanding of the physical principles underlying the various technique modalities.
Ultrasound physics
All forms of ultrasonic imaging are based on generation of high-frequency (>1 MHz) acoustic pressure waves from a transducer comprising one or more piezoelectric crystals. Current is passed across the latter, leading to material deformation and wave transmission. The piezoelectric element also serves as a receiver, and waves returning from insonified objects (e.g. walls, valves) deform the crystal(s), which, in turn, generate a current that can be sampled over time. Because the velocity of sound is constant, object location (spatial resolution) can be determined based on the timing of the returning signal. The amplitude of the returning signal is based on the angle of incidence (surfaces perpendicular to the ultrasound beam are stronger reflectors) and the interface of acoustic impedances (greater differences such as occur in the left ventricle at the tissue-blood interface lead to greater reflectivity). Returning ultrasound information is processed for maximum image integrity and then mapped to pixels for display and storage. While many institutions continue to store images on videotape, image degradation necessarily incurred by this medium, as well as ease-of-use issues, have led to increased implementation of digital storage, primarily on dedicated file servers.
M-mode
This was the first available form of echocardiography and, while still available on modern machines, has largely disappeared from routine use in modern laboratories. M- or ‘motion’-mode images depict a single line of ultrasound over time (Fig. 1.1). The information is graphic in nature and requires considerable experience for accurate interpretation. Its advantage lies in its high sampling rate (>1 kHz) and resultant ability to depict rapidly moving structures that may be of interest from a didactic or physiological perspective.
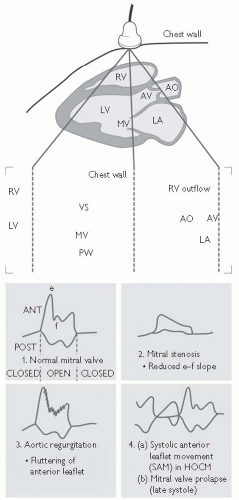 Fig. 1.1 Normal M-mode echocardiogram (AV = aortic valve; HOCM = hypertrophic obstructive cardiomyopathy; VS = interventricular septum; LA = left atrium; LV = left ventricle; MV = mitral valve; PW = posterior wall of LV; RV = right ventricle). After R Hall. Med Int 17: 774. Reprinted with permission from Longmore M, Wilkinson I, Davidson E, Foulkes A, and Mafi A (2010). Oxford Handbook of Clinical Medicine. 8th ed. Oxford: Oxford University Press. |
Two-dimensional (2D) or sector scanning (Fig. 1.2)
When an ultrasound beam is swept across a chosen cardiac window, rapid sequential sampling can be performed, leading to display of multiple ‘scan lines’ of information and a sector image created nearly instantaneously. Since a finite number of scan lines is possible, interpolation of data between lines is performed and an image slice or sector (hence the term ‘sector scanning’) is stored in digital form. Through reiterative acquisition over a cardiac cycle, a movie composed of sequentially acquired sectors is created, demonstrating structural motion, which can then be displayed on a monitor. Beam sweeping can be performed by mechanical rotation of one or more crystals, or through the use of programmed firing of a bank of crystals (phased array). Sampling rates were previously dictated and limited by videotape standards (e.g. PAL (phase alternating lines) or NTSC (National Television Standard Committee)) but, with digital capabilities appearing in some form on virtually all machines and replacing outdated tape technology, higher frame rates are possible.
The availability of harmonic tissue imaging has substantially improved image resolution by eliminating artefactual ‘noise’. Low-level signals emanating from tissue and comprising the first harmonic of the transmitted ultrasound are selectively sampled. In this way, extraneous reflections such as reverberations are filtered out, leaving a cleaner image.
Three-dimensional (3D) imaging (Fig. 1.3)
While two-dimensional (2D) ECHO presents user-selected sector or tomographic information, 3D ECHO has the potential to provide a comprehensive evaluation of cardiac anatomy similar to that of more quantitatively mature technologies such as MRI or CT. Three-dimensional ECHO can be performed using the ‘freehand’ approach, in which multiple 2D sectors are acquired from a probe that is positionally mapped using a ‘spark gap’ or magnetic tracking system. Both image and position data are stored for post-hoc 3D rendering. The development of rotational and, more recently, matrix array probes, coupled to powerful computer technology, has made post-hoc, 3D chamber reconstruction a reality, with accurate volumetric assessment. Most recently, real-time rendering of spatially limited cardiac segments has been made available. There are considerable limitations, and it is currently available in limited form from various manufacturers.
Transthoracic Doppler imaging
Quantification of object motion within the heart is performed using Doppler-based technologies. In brief, the same equipment described earlier propagates ultrasound, which is aimed at moving red blood cells or tissue.
The frequencies of returning ultrasound are shifted upwards and downwards by cells travelling towards and away from the transducer, respectively.
The frequency shift is proportional to an object’s velocity.
The signal intensity is dependent on the number of cells moving at a particular velocity.
Velocity information is depicted graphically as a spectral pattern over time (similar to the M-mode display) or mapped to pixels as colour overlaying the 2D or 3D image.
The ECHO beam must be as parallel as possible to the target, with off-axis angulation by >30° leading to significant underestimation of velocities.
Doppler is restricted in its ability to sample high velocities by the Nyquist limit, which is dependent on the sampling rate (the lower the frequency, the higher the evaluable velocity) and object depth (the deeper the object, the lower the sampling rate). When the frequency shift of moving objects (i.e. velocity) exceeds the Nyquist limit, aliasing occurs, precluding velocity assessment.
Pulsed Doppler permits accurate sampling of blood velocities averaged within a limited region of interest or ‘sample volume’. Transducer elements serve as both transmitters and receivers, permitting selective sampling of reflected ultrasound and accurate range or spatial information. Pulsed Doppler spectral displays portray velocity vectors over time:
laminar flow is found within normal vessels and chambers and characterized by a gradual increase in flow velocities from the vessel wall to the vessel centre.
laminar flow is characterized by a narrow spectral trace representing a relatively discrete population of blood velocities.
turbulent flow occurs across stenotic or regurgitant orifices (valves, shunts, etc.), where high-pressure gradients lead to high red-cell kinetic energy and disordered, high-velocity motion.
turbulent flow is graphically portrayed as spectral broadening.
aliasing often occurs with high-velocity jets, leading to ‘wraparound’ or the ‘paint brush sign’.
Flow quantitation from pulsed Doppler
Quantitation: pulsed Doppler spectral traces can provide important information regarding flow quantitation or timing, e.g. assuming that sampling occurs at an orifice with a relatively fixed area over the cardiac cycle (e.g. the left ventricular outflow tract) by integrating the time-velocity spectral curve (‘time-velocity integral’ or TVI), the area under the curve can be multiplied by the area of the orifice (determined from 2D ECHO) and stroke volume determined.
Continuous wave (CW) Doppler involves continuous transmission of ultrasound with one transducer element, while a second element serves as a receiver. Higher sampling rates are achieved and, consequently, higher velocities, as found in stenotic and regurgitant lesions, can be measured. CW Doppler does not permit ranging information to be acquired and all velocities along a scan line are included in the spectral trace. CW Doppler can be performed with stand-alone (Pedoff) probes, where the operator determines sample location based on familiar spectral patterns.
Imaging CW Doppler permits beam steering. Transducer elements are shared for the purposes of CW and intermittent 2D imaging. A virtual cursor positioned over the 2D image can be moved to guide and minimize offaxis sampling angulation. CW Doppler velocities are depicted as a filled-in spectral tracing, since these represent sampling of all of the velocities in structures along the sampling cursor (or ultrasound beam). Blood cells travelling at the fastest velocities are represented at the outer edge of the spectral trace (peak) or darkest line of the trace (modal) velocities.
Colour Doppler flow imaging employs multigate pulsed Doppler to portray blood flow overlying the 2D image. Information is used to detect regurgitant or stenotic lesions or shunts, and qualitative assessment of velocities is possible using colour maps.
Pixels are assigned a colour based on user-configurable mapping parameters. Pixel colour is based on average velocity in the pixel region of interest.
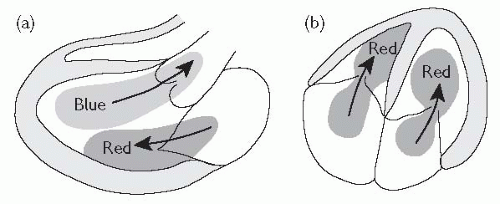
By convention, the BART colour map system is used in all machines, with blue colours representing flow away from the transducer and red colour depicting flow towards the transducer (Fig. 1.4).
The lighter the colour, the higher the velocity.
Abnormal velocity distributions characteristic of turbulence can be mapped, usually by including a green hue (‘variance mapping’).
Aliasing is depicted as a mix of colours or a ‘mosaic’ pattern.
Tissue Doppler imaging (TDI) is used to assess low-velocity displacement of structures. A high-pass filter excludes higher-frequency shifts caused by red-cell flow, leaving only low-velocity shifts attributable to wall motion.
Mitral or tricuspid annular motion can be tracked and correlates with systolic and relaxation performance of the associated ventricles.
Regional wall motion can be assessed for displacement, which may be affected by overall cardiac motion or local tethering.
Strain rate imaging can measure regional thickening and thinning, independent of the external influences described above, which influence tissue Doppler measurements. With strain rate imaging, two sampling sites are simultaneously acquired and inter-sample displacement (strain) over time (strain rate) can be determined.
Calculations from Doppler measurements
Valve gradients. The velocity of blood cells travelling across a narrow orifice is directly proportional to the pressure gradient at that point in time. This relationship is approximated by the simplified Bernoulli formula:
Gradient (mmHg) = 4V2 (where V = peak Doppler velocity in m/s)
In situations where there are high flow velocities (e.g. aortic stenosis with high LVOT velocities), the flow before the stenosis must be accounted for.
Both peak and mean gradients can be determined, the latter by integrating the velocity spectra over a cardiac cycle.
Valve area (continuity equation). This is based upon the principle that flow in the pre-valve area (e.g. LVOT) = flow across the valve. It is generally used for aortic stenosis quantitation, though it is applicable to other stenotic orifices as well.
As aortic valve flow = LVOT flow,
PLA = parasternal long axis.
The standard transthoracic ECHO
Most laboratories employ imaging protocols incorporating acquisition of images from standard windows, resulting in standard views presented in a fairly standard sequence. Image quality is maximized by avoiding pulmonary artefacts and rib reflections. Pulsed and colour flow Doppler are performed following 2D imaging in each view. Standard ECHO windows and views include:
Left parasternal window
Long axis (PLA) (Fig. 1.5): left atrium, ventricle, proximal ascending aorta, mitral and aortic valves, and right ventricle.
Short axis (PSA) (Fig. 1.5): four levels—aortic valve/left atrial level: includes the tricuspid and pulmonic valves and pulmonary artery; mitral valve, papillary muscle, and apex.
Right ventricular inflow tract (RVIT).
Right ventricular outflow tract (RVOT).
Apical window
3 chamber/apical long axis (A3Ch): apical version of PLA view with the anteroseptal, posterior walls, and LVOT.
Suprasternal window (SS): aortic arch.
Subcostal window (SC): 4 chamber, short axis, inferior vena cava.
Suprasternal window (optional): aortic arch and proximal descending thoracic aorta.
Right parasternal window (optional): ascending aorta and CW Doppler of the aortic valve.
Chamber evaluation
Chambers are routinely measured from M-mode tracings or, preferably, using digital calipers to perform point-to-point (PTP) assessment from 2D images.
Area tracings provide enhanced accuracy but are time-consuming.
Volumes are derived from 2D and PTP analysis using geometric modelling. The most common volumetric approaches include the modified Simpson’s biplane method of stacked discs, bullet and area-length formulae.
3D volume assessment has been validated but the technology is immature and inappropriate for routine clinical assessment.
The standard transthoracic ECHO: continued
Left atrium
Left ventricle
Aortic root and ascending aorta
Right ventricle
PTP measurements are exclusively used.
Irregularity of chamber configuration makes standardized quantitation difficult.
Pulmonary artery
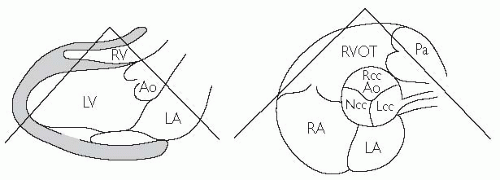
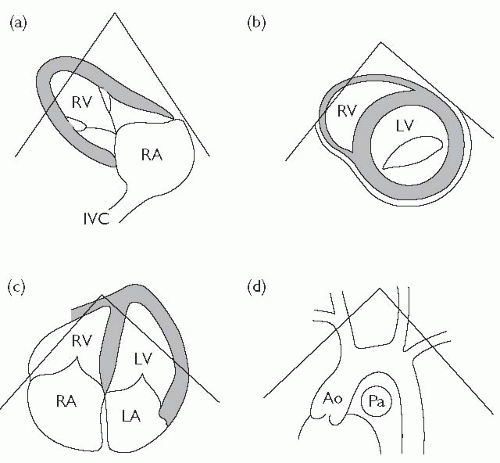 Fig. 1.6 (a) Parasternal long-axis view (RV inflow); (b) parasternal short-axis (mitral valve level); (c) apical 4-chamber view; (d) suprasternal long axis. Ao = aorta; IVC = inferior vena cava; Pa = pulmonary artery. Reproduced with permission from Shanewise JS. Journal of the American Society Echocardiography 1999;12:884-900. |
Assessment of wall motion
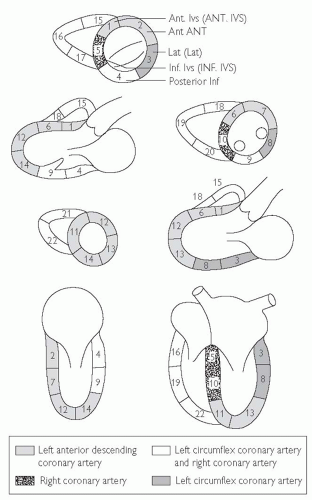
Assessment is based upon review of multiple cuts as described earlier. In general, abnormalities of LV regional function should be apparent in more than one view. Various labelling systems have been used but the American Heart Association (AHA) Cardiac Imaging Committee 17-segment model is the standard convention:
basal (6): anteroseptal, anterior, anterolateral, posterolateral, inferior, inferoseptal.
mid LV (6): same as above.
apical (5): anterior, lateral inferior, septal, and true apical. See Fig. 1.7.
Regional functional assessment
Systolic function should be classified as ‘normal’, ‘globally hypokinetic’, or demonstrating the presence of ‘regional wall motion abnormalities’.
Global hypokinesis is consistent with cardiomyopathy, either ischaemic or non-ischaemic. Some degree of regional variation may be present in non-ischaemic cardiomyopathy.
The presence of distinct regional wall motion abnormalities with large areas of normal regional function is suggestive of underlying coronary artery disease.
Evaluation should ideally be based on the degree of regional thickening as opposed to endocardial motion. Unfortunately, this is not always possible.
Each regional segment can be qualified as:
hyperkinetic.
normal.
hypokinetic.
akinetic.
dyskinetic.
Wall motion quantification, based on similar characteristics, may be prognostically useful, but is not useful in routine evaluation.
Identification of hyper-echogenic, thinned areas suggests the presence of scarring and should be mentioned in the evaluation.
Scarred segments may demonstrate endocardial motion, without wall thickening, due to tethering by peripheral segments.
Assessment of LV systolic function
Global functional assessment
Ejection fraction estimation is usually performed qualitatively. Echocardiographers need to routinely ‘recalibrate’ their assessment abilities by comparing qualitative readings to more accurate quantitative modalities, such as MRI, radionuclide ventriculography, 3D or even quantitative 2D ECHO (see Table 1.1).
Simpson’s modified biplane method of stacked discs: A4Ch and A2Ch LV traces are performed and the apex-annulus length is divided into a standard number of equal segments, the length of which serves as disc height. Cross-sectional disc area is calculated from the elliptical formula (πr1r2) where r1 and r2 = the endocardial medial-lateral dimension of each segment in the A4Ch and A2Ch views, respectively.
Table 1.1 Assessment of left ventricular ejection fraction
LV ejection fraction
Qualitative assessment
>75%
Hyperdynamic
55-75%
Normal
40-54%
Mildy reduced
30-39%
Moderately reduced
<30%
Severly reduced
Systemic output: LV stroke volume × heart rate.
Pulmonary stroke volume: integration of pulmonary artery spectral trace × pulmonary artery area (derived from systolic medial-lateral dimension at the level of Doppler sampling).
RV output: pulmonary stroke voume × heart rate.
Pulmonic/systemic shunt ratio (Qp/Qs): pulmonary output/systemic output.
Tissue Doppler of mitral and tricuspid annular motion.
Essential aspects of ECHO assessment in patients with impaired LV systolic function
Anatomy
Doppler characteristics
E deceleration time.
Estimate pulmonary capacitance (= stroke volume/(PAs – PAd pressures)).
Assessment of LV diastolic function
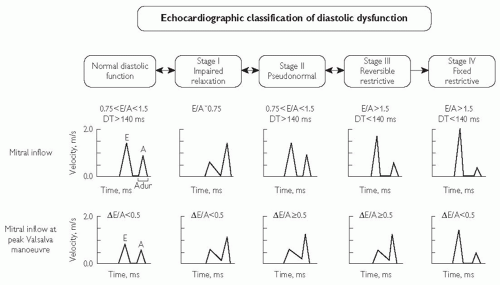
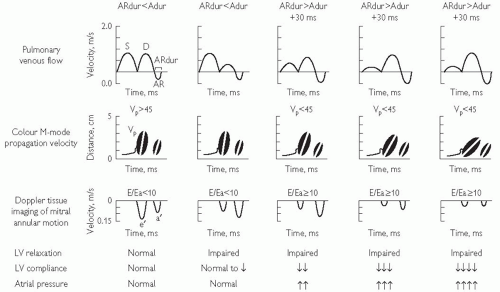
Evaluation of LV diastolic function includes measurement of the various phases of diastole including isovolumic relaxation, early filling, diastasis (atrioventricular pressure equilibration without LV filling), and atrial systole. These measures are generally age and heart-rate dependent, and affected by LV loading conditions to variable degrees (see Fig. 1.8).
Pulsed Doppler mitral inflow: E wave (peak early diastolic velocity), A wave (peak atrial systolic velocity), E/A ratio and transmitral deceleration time. The following should be taken into account when assessing these parameters:
E/A ratio is particularly dependent on sample volume placement (annulus, mitral tips, etc.) and loading conditions.
E/A ratio decreases with age, and assessment must be age-normalized. An E/A ratio <1.0 is common among the elderly and often represents normal aging.
increasing LV filling pressures (e.g. in heart failure) lead to ‘pseudonormalization’ of the ratio, which often reverts to an abnormal pattern following manoeuvres to reduce LV preload (e.g. diuresis) or Valsalva manoeuvre.
Pulsed Doppler of pulmonary veins: Flow into the left atrium can be sampled. S, D, and A waves represent systolic and diastolic atrial filling. The A wave is generated by reverse flow into the pulmonary veins during atrial contraction.
Tissue Doppler of medial and lateral mitral annuli (E’, A’)
This is considered the least load-dependent filling variable. There is generally poor correlation between medial and lateral velocities, with the lateral annulus measurement being more reproducible.
The E/E‘ ratio correlates roughly with LV end-diastolic pressure; a ratio >15 is strongly suggestive of elevated filling pressure, and a ratio <8 strongly suggestive of normal filling pressure.
Colour Doppler flow propagation (CFP) slope: Rate of blood acceleration into the LV from the annulus to the apex.
Various diastolic profiles combining some of the above parameters have been suggested as indicators of degree or stage of ‘diastolic dysfunction’. (see Fig. 1.8). In general:
markers of impaired relaxation (e.g. decreased E and E‘ are accompanied by compensatory enhancement of A and A‘), reduced pulmonary venous D, and reduced CFP slope.
increases in LV filling pressure lead to pseudonormalization of the transmitral Doppler E/A ratio, with less effect on Doppler with Valsalva manoeuvre and tissue Doppler velocity ratios.
as compliance decreases or a patient’s position on the LV pressure-volume curve advances (operating stiffness), the transmitral DT drops below 130 ms, early Doppler filling velocity is increased, and, due to elevated late diastolic LV pressures, atrial contraction and associated velocities are reduced.
if E/E’ ratio <8 and LA is of normal size, symptoms are unlikely to be due to diastolic heart failure.
do not miss constriction (see Constrictive pericarditis vs. restrictive myocardial disease, p. 475); look for:
septal ‘bounce’ and dys-schrony.
inferior vena cava (IVC) dilatation.
hepatic vein expiratory reversal.
Echocardiography in aortic stenosis
Aetiology
Aortic stenosis (AS) can be congenital or, more commonly, degenerative. In late stages, severe fibrocalcification precludes aetiologic identification, even on direct intraoperative visualization. Chronic severe AS is usually accompanied by concentric LV hypertrophy, a product of pressure overload.
Bicuspid aortic valve is diagnosed best on short-axis view and can display various configurations. Often a ‘raphe’ is observed, representing the undeveloped commisure where persistent cuspal fusion is present. Systolic cuspal ‘doming’ is consistent with congenital AS.
Degenerative AS is typically initiated in the annulus fibrosis (most commonly in the non-coronary cusp area) and gradually proceeds to invade the cuspal bases, body, and, in later stages, the tips. Valve thickening without haemodynamic stenosis is often termed ‘sclerosis’.
Haemodynamics
Stenosis is defined as a haemodynamically significant reduction in valve area as indicated by a rise in transvalvular pressure gradient.
Pressure gradient is dependent upon flow and, in the setting of low cardiac output, may be minimally elevated despite significant stenosis.
Valve area is generally not indexed to body size in most clinical labs, and categorization of severity may vary. One convention is as follows:
mild: area >1.5 cm2 and <2.0 cm2.
moderate: >1.0 and <1.5 cm2.
severe: <1.0 cm2.
critical: <0.7 cm2.
ECHO diagnosis
Assess cuspal separation or presence of doming. A trileaflet valve with one cusp opening fully (approaching edge of the root) is probably not stenotic.
CW Doppler-derived gradients are reported an instantaneous peak and/or mean. The mean gradient is more reliable in determining stenosis severity.
Catheterization lab gradients are ‘peak to peak’, with pressure measurements that are usually not acquired simultaneously and often do not correlate with Doppler gradients.
Peak transvalvular velocity >2.5 m/s (instantaneous gradient of 25 mmHg) suggests some degree of stenosis.
Elevated cardiac output or significant aortic regurgitation will increase transvalvular flow and gradient but not valve area.
The dimensionless obstructive index (DOI) is the ratio of LV outflow tract velocity (pulsed Doppler)/transvalvular velocity (CW Doppler), and takes into account elevated flow. General guidelines:
Aortic valve area is quantitated by the continuity equation. The most common errors in this assessment include:
under-measurement of the LVOT.
Stay updated, free articles. Join our Telegram channel

Full access? Get Clinical Tree


