Allen J. Taylor
Cardiac Computed Tomography
Progress in the clinical capabilities of cardiovascular computed tomography (CT) provides an array of applications for noninvasive cardiac and coronary artery assessment. Cardiac CT angiography now provides excellent image quality at low to extremely low effective radiation doses, which, coupled with ongoing progress in scanner technology and accumulating clinical trial evidence, establishes CT as a core technology for cardiovascular patient care. Beyond CT angiography, the technique now provides detailed assessment of the arterial wall, left ventricular (LV) and right ventricular (RV) systolic function, and cardiac valve morphology. It also enables myocardial tissue characterization and evaluation of coronary physiology with perfusion imaging. Together, these capabilities provide comprehensive evaluation of cardiac structure and function in appropriately selected patients (Videos 18-1, 18-2, and 18-3![]() ).
).
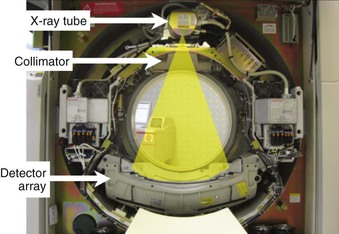
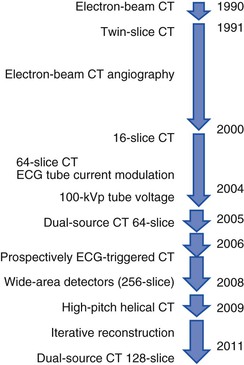
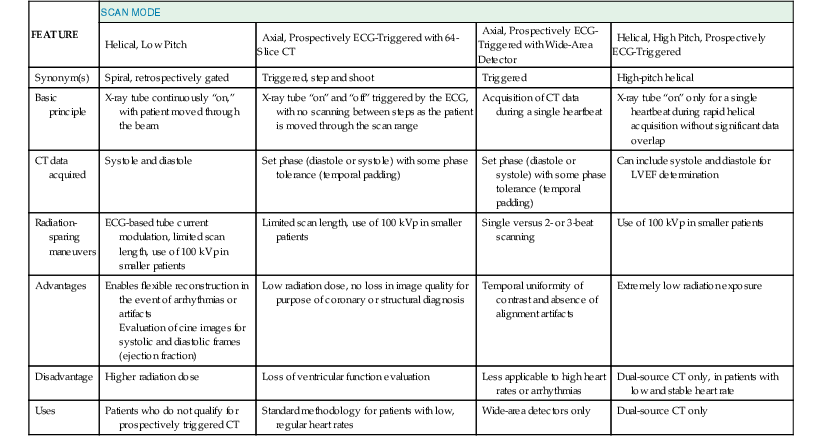
The basic principle of CT technology harnesses ionizing radiation within a gantry rotating around the patient in which x-rays are detected on a detector array (Fig. 18-1) and converted through reconstruction algorithms to images. Physical limits to spatial and temporal resolution are recognized, based on minimum detector width for detection of radiation signals and the speed at which the gantry can physically rotate. These physical limits are now being surmounted through software enhancements enabling preservation of or even improvements in diagnostic image quality at lower radiation exposures. The timeline of technical progress in CT between 1991 and approximately 2011 depicted in Figure e18-1![]() summarizes the major technical advances including the increasing growth in the number of detector rows (or “slices”). Each row is a narrow channel, approximately 0.625 mm in width for “standard” width detectors, through which x-rays are detected on scintillation crystals. The number of detector rows aligned in an array has increased from one in single-detector units to 4, 16, 64, and ultimately 256 to 320 rows in “wide-area” detectors. The increase in the number of rows leads to wider coverage, with more of the heart viewed simultaneously—up to 16 cm in a single gantry rotation for 320 detector rows at a width of 0.625 mm each (Table 18-1)—leading to shorter scan acquisition times and consequently reduced radiation exposure and contrast requirements. Spatial resolution within the imaging plane (the x–y axis) is broadly determined by the detector width, and the ability to create volumes of image data (voxels) of equal sides on all size, or isotropism. At present, the narrowest commercial detector width is 0.32 mm, for “high-definition” CT. The other major constraint with cardiac imaging is temporal resolution, a crucial factor in obtaining motion-free cardiac images. To achieve this requires fast gantry rotation (at present, maximum gantry rotation times are approximately 270 to 330 milliseconds) and performing image acquisition or reconstruction during periods of limited cardiac motion (end-systole to mid-late diastole). At present, CT spatial resolution through reconstruction of overlapping data sets is approximately 0.5 mm3, and temporal resolution is approximately 83 to 165 milliseconds achieved with use of half-scan reconstruction techniques, in which data from 50% of the gantry revolution are used for image reconstruction. Further refinements in spatial resolution are possible with the use of narrower detector widths (below 0.625 mm—high-definition CT) and through the addition of iterative image reconstruction techniques. Improvements in temporal resolution have been obtained through novel scanner designs (e.g., dual-source CT, in which simultaneous imaging with two-source detector arrays leads to temporal resolutions of 70 milliseconds through quarter-scan reconstruction), but physical forces from the weight of the rotating gantry will make further clinically important improvements difficult. Although the temporal and spatial resolution of cardiac CT (approximately 0.23 to 0.4 mm) remains less than that of invasive coronary angiography (<0.1 mm), it is sufficient for highly accurate, diagnostic coronary artery imaging.
summarizes the major technical advances including the increasing growth in the number of detector rows (or “slices”). Each row is a narrow channel, approximately 0.625 mm in width for “standard” width detectors, through which x-rays are detected on scintillation crystals. The number of detector rows aligned in an array has increased from one in single-detector units to 4, 16, 64, and ultimately 256 to 320 rows in “wide-area” detectors. The increase in the number of rows leads to wider coverage, with more of the heart viewed simultaneously—up to 16 cm in a single gantry rotation for 320 detector rows at a width of 0.625 mm each (Table 18-1)—leading to shorter scan acquisition times and consequently reduced radiation exposure and contrast requirements. Spatial resolution within the imaging plane (the x–y axis) is broadly determined by the detector width, and the ability to create volumes of image data (voxels) of equal sides on all size, or isotropism. At present, the narrowest commercial detector width is 0.32 mm, for “high-definition” CT. The other major constraint with cardiac imaging is temporal resolution, a crucial factor in obtaining motion-free cardiac images. To achieve this requires fast gantry rotation (at present, maximum gantry rotation times are approximately 270 to 330 milliseconds) and performing image acquisition or reconstruction during periods of limited cardiac motion (end-systole to mid-late diastole). At present, CT spatial resolution through reconstruction of overlapping data sets is approximately 0.5 mm3, and temporal resolution is approximately 83 to 165 milliseconds achieved with use of half-scan reconstruction techniques, in which data from 50% of the gantry revolution are used for image reconstruction. Further refinements in spatial resolution are possible with the use of narrower detector widths (below 0.625 mm—high-definition CT) and through the addition of iterative image reconstruction techniques. Improvements in temporal resolution have been obtained through novel scanner designs (e.g., dual-source CT, in which simultaneous imaging with two-source detector arrays leads to temporal resolutions of 70 milliseconds through quarter-scan reconstruction), but physical forces from the weight of the rotating gantry will make further clinically important improvements difficult. Although the temporal and spatial resolution of cardiac CT (approximately 0.23 to 0.4 mm) remains less than that of invasive coronary angiography (<0.1 mm), it is sufficient for highly accurate, diagnostic coronary artery imaging.
Patient Preparation and Scanning Sequence
The absolute requirements for patients to undergo contrast-enhanced cardiac CT angiography include the ability to receive intravenous contrast and cooperate with breathing instructions and hold their breath for the duration of the scan (typically 10 seconds or less, depending on scan length in the Z axis and acquisition mode). Relative contraindications include high or irregular heart rates (particularly atrial fibrillation), morbid obesity, or severe coronary artery calcium (CAC), defined as CAC scores above 400 to 1000. Each of these conditions can degrade scan quality or interpretability. These relative contraindications continue to be partially surmounted by technical advances in the field. High heart rates (addressed using dual-source scanners or multisegment reconstruction techniques), irregular heart rates (arrhythmia rejection software), atrial fibrillation (prospective ECG-triggered acquisitions), morbid obesity, and CAC (iterative reconstruction techniques) each can be partially overcome through recent advances in CT technology. Patient instructions include pretest, on-site, and post-test considerations (summarized in Table e18-1![]() ). Most centers control heart rate using beta blockers administered either orally (e.g., metoprolol 25 to 100 mg 1 hour before the scan) or intravenously (e.g., metoprolol 5 mg in repeated doses) to achieve a resting heart rate less than 65 beats/min. Some scanners with faster gantry rotations or dual-source configurations can obtain diagnostic image quality at higher heart rates, but in general scan quality is lower at higher heart rates.10 Nitroglycerin (400 to 800 µg sublingually) typically is administered just before CT angiography, to increase coronary artery diameter and improve the signal-to-noise ratio. Screening subjects for contraindications to nitrates such as phosphodiesterase inhibitors (e.g., sildenafil) should be routine.
). Most centers control heart rate using beta blockers administered either orally (e.g., metoprolol 25 to 100 mg 1 hour before the scan) or intravenously (e.g., metoprolol 5 mg in repeated doses) to achieve a resting heart rate less than 65 beats/min. Some scanners with faster gantry rotations or dual-source configurations can obtain diagnostic image quality at higher heart rates, but in general scan quality is lower at higher heart rates.10 Nitroglycerin (400 to 800 µg sublingually) typically is administered just before CT angiography, to increase coronary artery diameter and improve the signal-to-noise ratio. Screening subjects for contraindications to nitrates such as phosphodiesterase inhibitors (e.g., sildenafil) should be routine.
TABLE e18-1
Patient Instructions and Preparation for Cardiac Computed Tomography

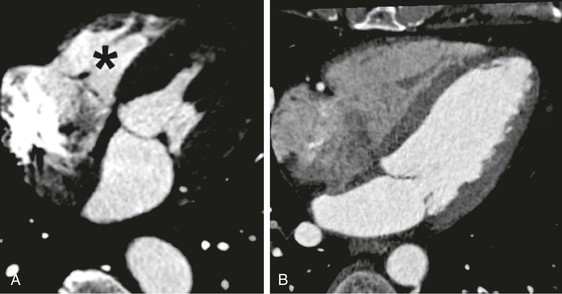
Intravenous contrast is required for the performance of cardiac CT angiography. The principle is to achieve a plateau of contrast concentration in the coronary arteries that is sustained through the image acquisition to ensure uniform contrast opacification. A standard three-phase injection protocol consists of administration of undiluted contrast, 40 to 60 mL, at a rate of approximately 5 mL/sec through an antecubital 18 to 20 gauge intravenous line, followed by a smaller volume of dilute contrast (50:50 contrast-to-saline ratio, for a total of 10 to 20 mL), and then a bolus of saline (40 mL). The intent is to maximize contrast enhancement of the left side of the heart and arterial structures, with mild contrast enhancement of the right side of the heart and pulmonary artery. Excessive right-sided contrast enhancement can interfere with evaluation of the right coronary artery and is unnecessary for most scan indications (unless right-sided heart enhancement is judged necessary for the particular clinical indication) (Fig. 18-5). Timing of the scan in relationship to the contrast bolus is commonly performed using the triggered bolus method, in which contrast attenuation in the pulmonary artery or aorta is monitored, followed by automated scan initiation once an adequate CT attenuation value (110 to 180 Hounsfield units [HU]) is achieved. An alternative method is to tailor scan timing as determined using a contrast test bolus to determine the time to peak contrast attenuation, with subsequent scan programming based on the individual patient’s transit time (which can vary from patient to patient in accordance with volume status, cardiac output, and ventricular/valvular function). After peak contrast opacification is attained, an additional delay including a patient breath-hold is programmed to last typically 6 to 10 seconds, to permit even contrast opacification of the coronary circulation and stabilization of heart rate. Scan time is determined by the scanner, acquisition mode, heart rate, and scan length in the Z axis, but for 64-row multidetector CT it is approximately 6 seconds. A typical sequence of scan acquisition and a postprocessing algorithm are shown in Table 18-4 and Table e18-2![]() , respectively. Novel applications, such as evaluation of late myocardial enhancement, or myocardial perfusion during vasodilator stress, require specific alterations to the imaging protocol.
, respectively. Novel applications, such as evaluation of late myocardial enhancement, or myocardial perfusion during vasodilator stress, require specific alterations to the imaging protocol.
TABLE 18-4
Typical Cardiac Computed Tomography Scan Sequence
1. Scout film | Determine cardiac location |
| Limit scan range to cardiac and other relevant structures of interest | |
3. Calcium scan | If indicated: use calcium scan to refine CT angiography scan range |
| 400-800 µg sublingual | |
| Contrast injection to determine transit time or track bolus until scan is initiated with achievement of attenuation threshold | |
| Permits contrast opacification to become uniform, and heart rate to stabilize; prolonged scan delays may lead to increased coronary venous opacification | |
7. CT angiogram | Check vital signs after procedure |
| Use of interpretation and reporting standards recommended |

Cardiac Computed Tomography Anatomy
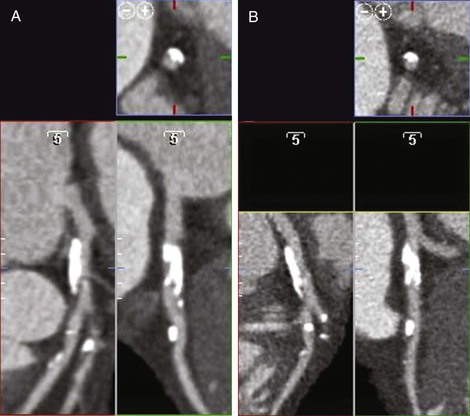
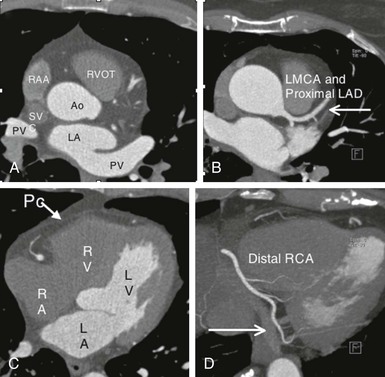
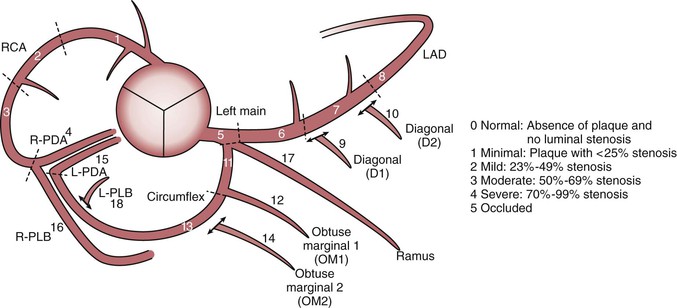
Thin-slice cardiac CT reconstructions with isotropic voxels can be displayed in any imaging plane with minimal to no image distortion. Cardiac chambers, coronary vessels, great vessels, and other surrounding cardiac and mediastinal structures can be imaged in a multiplanar fashion (Fig. 18-6). Images can be displayed in orthogonal planes (axial, coronal, sagittal) or nonstandard planes (oblique planar reformats) (Fig. 18-7). Images are evaluated in both thin- and thick-slice projections, most commonly using a maximal-intensity projection in which the pixel within the slab volume with the highest Hounsfield number is viewed. Maximum-intensity projections provide the ability to view more structures within a single planar view but can obscure details, particularly when highly attenuating structures (such as CAC) are present. Optimal accuracy for cardiac CT entails the use of an interactive evaluation technique in which optimal imaging planes are selected by the interpreter.11 Curved structures can be viewed in a planar fashion by means of curved multiplanar reformations (see Fig. 18-7), constructed with the use of centerline techniques. Volume-rendered reconstructions are useful for revealing general structural relationships but not for viewing details of the coronary anatomy. In addition to image planes for coronary artery evaluation, which can be categorized using coronary segmentation models (Fig. 18-8), analysis of cardiac chambers is performed using standard short-axis and horizontal and vertical long-axis projections (Fig. 18-9). A complete evaluation includes inspection of the images for noncardiac pathologic processes in the lungs, mediastinum, and great vessels.
Clinical Indications
Coronary Artery Calcium Scanning
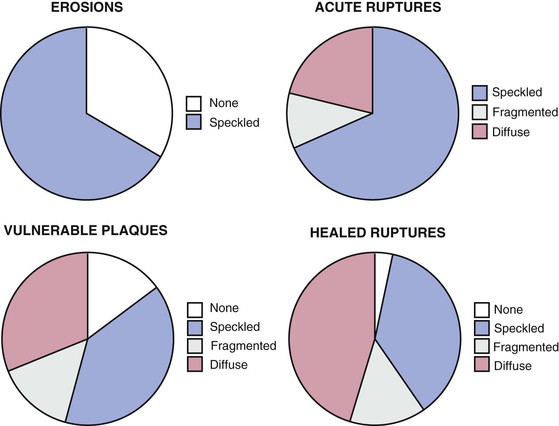
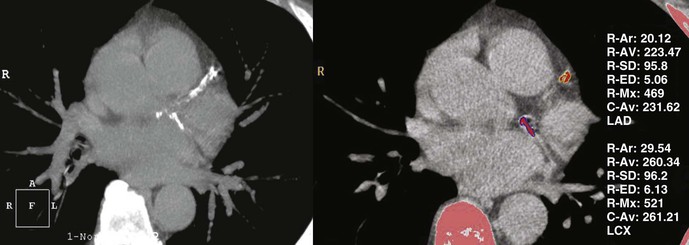
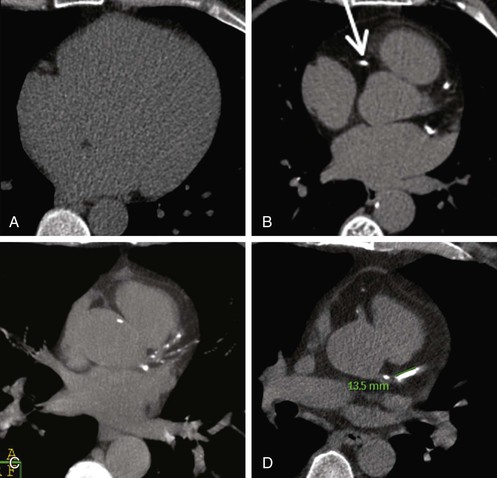
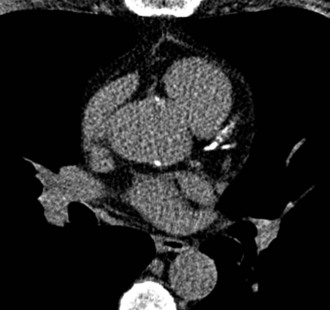
CAC testing is used in asymptomatic patients to refine their clinically predicted risk of incident coronary heart disease (CHD) beyond that predicted by standard cardiac risk factors. CAC typically is present in amounts directly proportional to the overall extent of atherosclerosis, although typically only approximately 20% of plaque contains calcified regions. Arterial calcification is an active process involving the deposition of hydroxyapatite, most typically in areas with healed plaque rupture. Acute plaque ruptures and vulnerable plaques primarily contain speckled or fragmented calcium, whereas healed plaque ruptures most commonly are composed of diffuse calcium (Fig. 18-10). Although most clinical data regarding CAC were derived using electron beam CT, multidetector CT has supplanted electron beam scanning given the comparability of clinical scoring and the more widespread availability of the technology. CAC is detected using a standardized protocol involving prospective ECG-triggered axial scanning, with a slice thickness of 2.5 mm.15 Standard tube voltage is 120 kVp, with tube current set at 120 to 150 milliampere-seconds (mAs), which should result in acceptably low levels of radiation exposure (1 to 2 mSv). CT CAC quantification primarily involves the measurement of the area and density of all foci of calcification, defined using a Hounsfield threshold of 130 HU (Fig. 18-11). The sum of the area and density weightings across the coronary arteries is the unitless “CAC score.” Based on the screening nature of CAC scanning for asymptomatic subjects, use of radiation-sparing techniques is paramount for patient safety. Proposed revised protocols include the use of a peak tube current of 100 kVp, which reduced radiation exposure down to approximately 1 mSv, but such protocols would require alteration of the HU threshold for calcium.16 Alternatively, reduced tube current (85 mAs) can be applied, leading to similar 40% reductions in radiation exposure, but without the need to alter the calcium HU threshold. CAC score reproducibility is modest, with interscan variability of 10% to 20%, being more reproducible at low heart rates and for higher CAC scores.
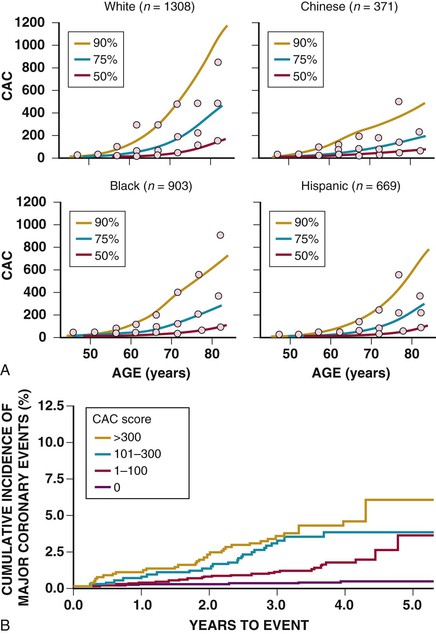
The presence and extent of CAC are dependent on age, sex, ethnicity, and standard cardiac risk factors. CAC scores are higher for age and sex among whites (Fig. 18-12).17 It is well established that the detection of CAC indicates an increased risk of incident CHD over that predicted by standard risk factors, ranging from 2-fold for scores of up to 100 to 11-fold for scores above 1000. Similar findings have been shown regarding sex and ethnicity in the Multi-Ethnic Study of Atherosclerosis (MESA) (see Fig. 18-12),18 and in both young (aged 40 to 50)19 and older20 patient populations. Middle-aged women with any detectable CAC have an incident CHD event risk in excess of 2% per year.21 Recent data indicate that the spatial distribution of CAC may provide further risk stratification beyond the total calcium score. A “coronary CAC coverage score” was devised from the MESA and showed greater predictive accuracy for future CHD events than the area-density scoring system.22 This finding is in line with other observations that higher clinical risk is associated with multivessel CAC (for an equivalent score, three-vessel coronary CAC carries a worse prognosis than two- or one-vessel CAC),23 the number of calcified lesions (the more lesions, the worse the prognosis),24 and diffuse spotty calcified lesions (small foci <3 mm in size)25 (Fig. 18-13). Conversely, data from 13 studies involving 75,000 patients over 4 years show that a CAC score of 0 is associated with a very high event-free probability (99.9%/year).26
Based on the consistency of studies showing independent prediction of CHD risk, current appropriate use criteria support the use of CAC scanning as a risk stratification tool when an initial evaluation of clinical risk using risk prediction tools indicates an intermediate level of CHD risk (10% to 20% over 10 years, or in young patients with a low to intermediate risk, 6% to 10% over 10 years) or in low-risk patients with a family history of premature CHD.13 Comparisons of coronary CAC with lifetime risk estimates are needed. The National Cholesterol Education Program,27 the 2010 guideline for assessment of cardiovascular risk in asymptomatic adults of the American College of Cardiology Foundation (ACCF),28 and the ACCF/American Heart Association 2013 guidelines on the assessment of cardiovascular risk29 indicate that CAC scanning is a reasonable testing option (Class 2A recommendation) among such patients, on the basis of the possibility that such patients might be reclassified to a higher risk status based on high CAC score, with subsequent modification of patient management.
Online tools provide the ability to age/sex/ethnicity adjust CAC values, comparing patient data with population norms established in MESA (www.mesa-nhlbi.org). In addition, data from the MESA integrate CAC values with Framingham risk scores, leading to adjusted estimates for incident CHD. Risk estimates generally are revised downward for low CAC scores and upward for high CAC scores. Data from the MESA study show significant net reclassification improvement with both downward and upward classification of cardiovascular risk based upon CAC results.30 Within initial risk strata, the range of risk varied from 2.5 to 20 fold dependent on the conditional presence or absence of CAC (see the case example in Fig. e18-2![]() ).
).
Community-based screening cohorts31,32 have shown up to threefold greater use of aspirin and statin cholesterol medications and other proven cardiovascular risk reduction interventions in the setting of CAC. A single randomized trial did address the relationship between CAC screening guiding preventive therapy with statin.33 Among participants of the St. Francis Heart Study with a CAC score above the 80th percentile (n = 1005), random assignment to atorvastatin treatment (20 mg/day) was associated with a 3% absolute risk reduction (P = .08) for composite cardiovascular events, and a significant 6.3% absolute risk reduction in those with a baseline CAC score above 400. Beyond recommendations for the provision of and adherence to risk-reducing therapies, an abnormal CAC scan in an asymptomatic patient can be associated with an increased likelihood of silent ischemia on stress myocardial perfusion imaging (see Chapter 16),34,35 and the absence of myocardial ischemia may moderate the event risk associated with a very high CAC score.36 However, such testing is not recommended in the absence of clinical trial evidence showing patient benefit from such an approach.
The use of serial testing to define progression of CAC has been suggested as a method of further defining evolving CHD risk. Once present, CAC tends to progress at a rate of approximately 20%/year.37 Middle-aged persons with a CAC score of 0 have an approximately 5%/year conversion rate from a zero to a nonzero score.38 Although observational data from referred populations suggest that patients with clinically significant CAC progression (>15%/year) may have substantially higher clinical event risk for a given CAC score and a threefold increased risk for all-cause mortality,39–42 risk-reducing interventions do not retard CAC progression, indicating that CAC progression is a complex phenomenon probably involving a mixture of both plaque healing and plaque progression.43 Owing to concerns over radiation exposure, intertest variability, and undefined management implications, current guidelines do not support the performance of serial CAC testing; this remains an active area of investigation, however.17
Coronary Computed Tomography Angiography
Diagnosis of Coronary Artery Disease
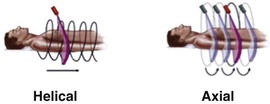
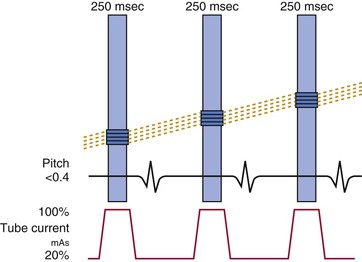
The primary clinical application of cardiac CT is the performance of noninvasive coronary CT angiography among patients with symptoms or suggestive evidence of myocardial ischemia. Meta-analysis of primarily single-center studies from symptomatic patients (prevalence of CAD 64%), shows the overall accuracy of 64-row CT angiography included a sensitivity of 87% to 99% and specificity of 93% to 96%.44 Multicenter trials (Table 18-5)45–47 support data from single-center trials. More recent data acquired on newer cardiac CT platforms such as dual-source CT or wide-area detectors confirm the accuracy of cardiac CT, along with improved performance, including reduced nonassessable coronary segments and image artifacts. Recent progress includes the application of cardiac CT to difficult patient populations such as those with atrial fibrillation48 using either helical CT with retrospective ECG gating with a wide tube current modulation window (at the expense of high radiation exposure) or axial prospectively ECG-triggered acquisition using a temporal trigger typically 250 milliseconds from the preceding R wave to gather end-systolic data using either dual-source or wide-detector CT. Although atrial fibrillation remains a relative contraindication to cardiac CT, with appropriate technology and approach reasonable accuracy and diagnostic image quality can be achieved.
TABLE 18-5
Multicenter Trials Assessing the Diagnostic Accuracy of Cardiac CT Angiography for Detection of Coronary Artery Stenosis
| STUDY | N | PREVALENCE OF CAD | SENSITIVITY | SPECIFICITY | POSITIVE PREDICTIVE VALUE | NEGATIVE PREDICTIVE VALUE |
| Budoff et al.: ACCURACY | 230 | 25% | 95 | 83 | 64 | 99 |
| Meijboom et al.: prospective multivendor study | 360 | 68% | 94 | 83 | 48 | 99 |
| Miller et al.: CORE-64 | 291 | 56% | 85 | 90 | 91 | 83 |

Stay updated, free articles. Join our Telegram channel

Full access? Get Clinical Tree


