The recent report by Amer et al is interesting but a bit confused. The first issue is to clarify just what the β coefficient represents.
In their “Results” section, the investigators appear to associate the values for β in their Table 2 with “the geometric mean change in CRP [C-reactive protein], in mg/dl for a 10-ng/ml increase” in 25-hydroxyvitamin D (25[OH]D). I suggest that this is a misinterpretation of the significance of the β coefficient.
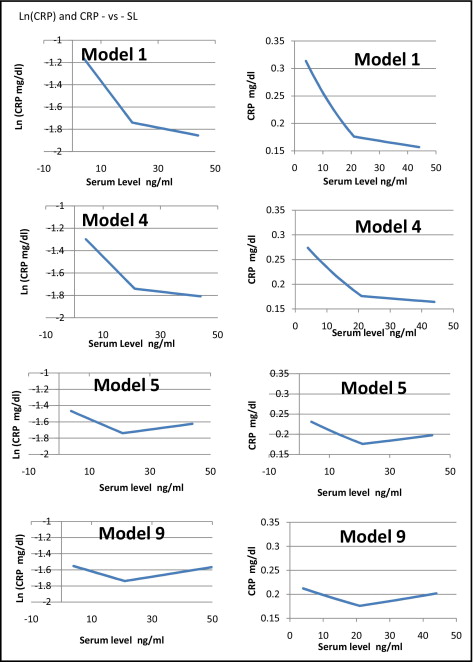
The investigators have chosen to represent the data with a linear spline. That is, they divide the data into 2 parts, divided at the median 25(OH)D serum level (herein called SL), and fit each half with a straight line segment, with the 2 segments meeting at the dividing line. Looking at their Figure 1 , and the values of the β coefficient in their Table 2, model 1, one can tease out that the 2 values of the β coefficient represent the slopes of the 2 sides of the graph, in somewhat curious units. By estimating the value of ln(CRP) at the break point (SL = 21 ng/ml) in their graph as −1.74, one can find the equations of the 2 line segments, to the left and right of the break point, as ln(CRP) = −1.026 − 0.034 × SL and ln(CRP) = −1.635 − 0.005 × SL.
Notice that the coefficient of SL is now given in the more conventional unit of “rate of change in Ln(CRP) for 1 unit change of SL,” rather than for 10 units. And the units of β will be the reciprocal of the units of SL, that is, millilitres per nanogram of 25(OH)D. This arranges that ln(CRP) is unitless, as it must be.
Looking at this in another way, the reciprocal of β, which let us call b, is the range of SL over which ln(CRP) changes by 1 or the value of CRP changes by a factor e. On the left in model 1, b will have the value 1/0.034 = 29 ng/ml, while on the right, it is 1/0.005 = 200 ng/ml.
Now if the logarithm of CRP is represented as a linear function of serum level of 25(OH)D, CRP will be represented by an exponential function, or CRP = A × exp(B × SL). The variable B is simply the coefficient β (in the suitable units given previously). The value of A is the exponent of the y intercept of the expression for ln(CRP). On the 2 sides of the dividing line, the fitted regression for CRP as a function of SL will be given by CRP = 0.359 × exp(−0.034 × SL) and CRP = 0.195 × exp(−0.005 × SL).
With this, it is straightforward to determine that the regression model indicates that at the spline junction, SL = 21 ng/ml, the trend in CRP changes discontinuously from −0.00598 to −0.00088 mg/dl per 1 ng/ml change in SL. This is substantially smaller than that reported by the investigators, who suggested a change in trend from −0.0285 to −0.005 mg/dl per 1 ng/ml change in SL.
In a similar manner, one can now interpret the β coefficients in the various models as slopes of the 2 sides of a linear spline in graphs of ln(CRP) versus SL and then deduce the corresponding expressions for CRP versus SL in a straightforward manner. When one does this, the direct relation noted in model 9 above the spline junction (SL >21) is not 0.006 mg/dl per 1 ng/ml change in SL, as reported, but 0.001 mg/dl per 1 ng/ml change in SL.
The variation of CRP with serum 25(OH)D, already seen to be small in the study, is smaller yet than reported. In the final adjusted model, model 9, the variation in the model regression in CRP starts at 0.212, decreases to 0.176 (right at the population mean), then increases to 0.209: a down-and-up variation of 0.036 mg/dl. This is <1/6 the interquartile median of the population.
The “Adjustments” for covariates: the real message?
As is readily apparent in the investigators Table 2, the major effect of the sequential adjustments for age, gender, race, hypertension, and serum glucose is to flatten the slopes of both sides of the spline fits. Then, in their model 5, an “adjustment” is made for obesity. Suddenly the monotonic decreasing fit of the first 4 models becomes a V shape. For serum levels >21 ng/ml, the fit goes from decreasing CRP to increasing CRP with increasing serum level. Further adjustments for other covariates do not change this trend.
Why were the adjustments made only sequentially? Had one instead looked at 8 separate bivariate adjustments for the individual covariates, the trend apparent in the table strongly suggests that one would see 7 small variations on the graph shown in the investigators’ Figure 1 , and one striking graph that shows a V shape.
That is, the “adjustment” for obesity completely overwhelms the effect of increasing vitamin D serum level. Is this not, then, the real message of this study: that CRP, a biomarker of inflammation, is far more sensitive to obesity than to serum level of 25(OH)D? It is suggested that further studies on this subject look to understanding this sensitivity to obesity before proceeding with a (possibly nonexistent) unfavorable association with higher levels of 25(OH)D.
Stay updated, free articles. Join our Telegram channel

Full access? Get Clinical Tree


