Current models incompletely risk-stratify patients with acute chest pain. In this study, N-terminal pro–B-type natriuretic peptide and cystatin C were incorporated into a contemporary chest pain triage algorithm in a clinically stratified population to improve acute coronary syndrome discrimination. Adult patients with chest pain presenting without myocardial infarction (n = 382) were prospectively enrolled from 2008 to 2009. After clinical risk stratification, N-terminal pro–B-type natriuretic peptide and cystatin C were measured and standard care was performed. The primary end point was the result of a clinical stress test. The secondary end point was any major adverse cardiac event at 6 months. Associations were determined through multivariate stratified analyses. In the low-risk group, 76 of 78 patients with normal levels of the 2 biomarkers had normal stress test results (negative predictive value 97%). Normal biomarkers predicted normal stress test results with an odds ratio of 10.56 (p = 0.006). In contrast, 26 of 33 intermediate-risk patients with normal levels of the 2 biomarkers had normal stress test results (negative predictive value 79%). Biomarkers and stress test results were not associated in the intermediate-risk group (odds ratio 2.48, p = 0.09). There were 42 major adverse cardiac events in the overall cohort. No major adverse cardiac events occurred at 6 months in the low-risk subgroup that underwent stress testing. In conclusion, N-terminal pro–B-type natriuretic peptide and cystatin C levels predict the results of stress tests in low-risk patients with chest pain but should not be substituted for stress testing in intermediate-risk patients. There is potential for their use in the early discharge of low-risk patients after clinical risk stratification.
Accurate and efficient risk stratification for patients with acute chest pain remains a significant problem. In this study, we evaluated low- and intermediate-risk patients with acute chest pain presenting to the emergency department (ED) by measuring cystatin C and N-terminal pro–B-type natriuretic peptide (NT-proBNP) to determine if these biomarkers could substitute for the results of stress testing, potentially leading to more rapid, accurate, and cost-effective triage to hospital admission or ED discharge. No previous study has attempted to correlate biomarkers with stress test results. Secondarily, we assessed whether these biomarkers provide incremental benefit above clinical risk stratification in this population.
Methods
Patients presenting to the ED at a large urban tertiary care medical center triaged with a chief complaint of chest pain were consecutively enrolled from August 2008 to June 2009. After obtaining informed consent, history and physical examination information was collected using a protocol-specific questionnaire. Each patient’s blood specimens were collected and stored. Patients were determined to be at high, intermediate, or low risk per Agency for Health Care Policy and Research (AHCPR) guidelines. The study was approved by the local institutional review board.
Eligible patients were aged ≥18 years with acute chest pain lasting ≥10 minutes and at low or intermediate risk per AHCPR guidelines without clinical, electrocardiographic, or biomarker evidence of myocardial infarction (MI). MI was defined per current guidelines to be a troponin I elevation ≥0.6 ng/ml along with the appropriate clinical, electrocardiographic, or imaging criteria. Patients with electrocardiographic evidence of ST-segment elevation MI who underwent immediate cardiac catheterization without elevated troponin I were also counted in the MI group. Exclusion criteria included patients classified at high AHCPR risk, those with MIs, those without available blood samples, and those who failed to provide informed consent. Disagreements in classification of MI were resolved by the primary investigator. To allow adequate time to rule out acute MI, patients were observed for ≥9 hours in the chest pain or telemetry unit and until 2 sets of troponin I tests had been analyzed before enrollment.
Plasma was analyzed for troponin I, aliquoted, and stored at −20°C until testing for cystatin C and NT-proBNP. Conventional cardiac troponin I was measured by radial partition immunoassay using the Dade Stratus CS analyzer (Siemens Healthcare Diagnostics, Deerfield, Illinois). NT-proBNP was measured by chemiluminescent immunoassay on the Dade Dimension Xpand analyzer (Siemens Healthcare Diagnostics). Cystatin C was measured by immunoturbidimetry on the Roche DPP analyzer (Roche Diagnostics, Indianapolis, Indiana). An abnormal NT-proBNP level was defined as ≥125 pg/ml. An abnormal cystatin C level was defined as ≥1.19 mg/L. All patients included in the final analysis had NT-proBNP measured, but because of the lack of sufficient plasma sample, 37 patients did not have cystatin C measured.
After enrollment in the study, patients underwent standard clinical care as determined by their treating physicians. Telephone and medical chart follow-up occurred at 6 months. Measured end points included stress test results and any major adverse cardiac event (MACE). Stress tests included any noninvasive ischemic evaluation, including exercise treadmill testing, exercise or pharmacologic myocardial perfusion imaging, and exercise or pharmacologic echocardiography performed during the course of the index visit. All stress tests were performed per standard guideline-driven protocols. Stress test results were divided into normal, abnormal, or indeterminate on the basis of a review by a certified cardiologist. An abnormal stress test result was defined as electrocardiographic ST-segment depression >1 mm on exercise testing or abnormal myocardial perfusion on nuclear imaging. All interpretation and reports were on the basis of current consensus guidelines. This end point was chosen because of its use as the primary guideline-recommended ischemic evaluation for low- and intermediate-risk patients with chest pain. MACEs included the first occurrence of an MI, revascularization (percutaneous coronary intervention or coronary artery bypass grafting), or death from the time a patient left the ED (for discharge or admission) up to 6 months except for in-hospital MIs or staged percutaneous coronary intervention revascularization. Source documents of each MACE were reviewed by independent members of the team for accuracy (S.S.S. and K.S.). Reports of mortality were cross referenced with the Social Security Death Index.
Depending on the distribution, between-group differences for continuous variables were assessed using 2-sample Student’s t tests (expressed as mean ± SD) or Wilcoxon’s rank-sum tests (expressed as median [interquartile range]). Nominal variables are expressed as frequencies and percentages. For categorical variables, differences between groups were assessed using chi-square tests or Fisher’s exact tests as appropriate. The primary outcome measure of the relation of NT-proBNP or cystatin C to stress test results was expressed as an odds ratio (OR) using chi-square analyses. Each biomarker was analyzed individually for this relation, and then an analysis was performed with the 2 biomarkers. We stratified these analyses by low or intermediate risk using the Cochran-Mantel-Haenszel statistic to generate an adjusted OR. Secondary outcome measures are also expressed as ORs using chi-square or Fisher’s exact tests as appropriate. Sensitivity, specificity, positive predictive value, and negative predictive value (NPV) were generated using frequencies. Statistical significance was defined as a p value <0.05.
Results
Of the 524 patients who initially consented to the study, 382 patients were eligible for final analysis ( Figure 1 ). Of these patients, nearly half (n = 189) underwent stress testing during their hospital visits. Patients who underwent stress testing were more likely to be younger, female, and at low AHCPR risk. Stress testing was less likely to be performed in patients with histories of MI, revascularization, diabetes, or heart failure.
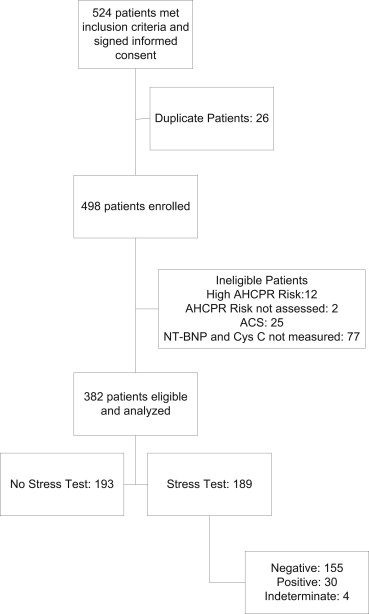
Table 1 illustrates the baseline characteristics as stratified by AHCPR risk classification. Similar to the differences between patients who did and did not undergo stress testing, patients classified at low risk were younger and less likely to be men, to have hypertension, diabetes, heart failure, prior revascularization, to use aspirin, or to be prescribed typical cardiovascular medications.
| Variable | n | Overall | Low AHCPR Risk (n = 191) | Intermediate AHCPR Risk (n = 191) | p Value |
|---|---|---|---|---|---|
| Men | 382 | 162 (42%) | 71 (37%) | 91 (48%) | 0.04 |
| Smokers | 345 | 137 (40%) | 70 (41%) | 67 (38%) | 0.58 |
| Previous MI | 369 | 59 (16%) | 1 (1%) | 58 (31%) | <0.001 |
| Previous percutaneous coronary intervention | 379 | 89 (24%) | 1 (1%) | 88 (47%) | <0.001 |
| Previous coronary artery bypass grafting | 382 | 44 (12%) | 0 (0) | 44 (23%) | <0.001 |
| History of heart failure | 376 | 56 (15%) | 3 (2%) | 53 (28%) | <0.001 |
| Previous stroke | 337 | 26 (8%) | 9 (5%) | 17 (10%) | 0.11 |
| Hypertension | 381 | 256 (67%) | 107 (56%) | 149 (78%) | <0.001 |
| Diabetes mellitus | 381 | 129 (34%) | 50 (26%) | 79 (41%) | 0.002 |
| Aspirin use (past 7 days) | 349 | 207 (59%) | 82 (49%) | 125 (69%) | <0.001 |
| Age (yrs) | 382 | 58.3 ± 13.5 | 52.3 ± 9.6 | 64.3 ± 14.2 | <0.001 |
| Body mass index (kg/m 2 ) | 213 | 29.9 ± 7.5 | 30.8 ± 7.0 | 29.0 ± 7.9 | 0.07 |
| Heart rate (beats/min) | 345 | 82.4 ± 18.5 | 83.1 ± 17.3 | 81.7 ± 19.6 | 0.49 |
| Systolic blood pressure (mm Hg) | 340 | 140.3 ± 24.4 | 140.0 ± 22.1 | 140.6 ± 26.5 | 0.85 |
| Diastolic blood pressure (mm Hg) | 340 | 81.0 ± 15.8 | 82.1 ± 14.5 | 79.9 ± 16.9 | 0.20 |
| Antihypertensive medication | 317 | 218 (69%) | 88 (58%) | 130 (79%) | <0.001 |
| Antiplatelet therapy | 309 | 171 (55%) | 64 (43%) | 107 (67%) | <0.001 |
| Diabetes medication | 298 | 94 (32%) | 33 (22%) | 61 (40%) | <0.001 |
| Cholesterol medication | 302 | 129 (43%) | 38 (26%) | 91 (59%) | <0.001 |
| Creatinine (mg/dl) | 380 | 1.0 (0.4) | 1.0 (0.30) | 1.1 (0.50) | 0.002 |
| NT-proBNP (ng/ml) | 382 | 77.7 (322.4) | 35.1 (90.2) | 184.6 (1,064.0) | <0.001 |
| Cystatin C (mg/L) | 345 | 0.9 (0.4) | 0.8 (0.3) | 1.0 (0.5) | <0.001 |
In the stress test group (n = 189), there were 30 studies with abnormal results (15.9%). To confirm the accuracy of initial risk classification, intermediate-risk patients were statistically more likely to have abnormal stress test results compared to low-risk patients, with an unadjusted OR of 5.72 (95% confidence interval [CI] 2.38 to 13.75; Table 2 ).
| Variable | Overall | Low Risk | Intermediate Risk | OR | 95% CI | p Value |
|---|---|---|---|---|---|---|
| Stress test results abnormal | 30/184 (16%) | 8 (7.1%) | 22 (30.6%) | 5.72 | 2.38–13.75 | <0.001 |
| NT-proBNP level abnormal | 158/382 (41%) | 45 (23.6%) | 113 (59.2%) | 4.70 | 3.02–7.31 | <0.001 |
| Cystatin C level abnormal | 83/345 (24%) | 19 (11.5%) | 64 (35.8%) | 4.31 | 2.44–7.59 | <0.001 |
| Either abnormal | 172/353 (49%) | 49 (28.8%) | 123 (67.2%) | 5.06 | 3.22–7.97 | <0.001 |
Overall, 158 of 382 patients (41%) had elevated NT-proBNP levels. In contrast, 83 of 345 patients (24%) had abnormal cystatin C levels. Either value was abnormal in 172 patients (49%). When comparing by AHCPR risk classification, individually, NT-proBNP and cystatin C were statistically more likely to be elevated in intermediate-risk patients ( Table 2 ). Likewise, elevation of either NT-proBNP or cystatin C was statistically more likely to be present in the intermediate-risk group compared to the low-risk group (OR 5.06, 95% CI 3.22 to 7.97).
In the stress test group (n = 189), 58 patients had either elevated cystatin C or NT-proBNP levels (30.7%; Table 3 ), with 19 having an abnormal stress test results. In contrast, 102 of 111 patients with normal cystatin C and NT-proBNP levels had normal stress test results, yielding an NPV of 92%. Therefore, biomarkers predicted the stress test results with an OR of 5.52 (95% CI 2.3 to 13.2, p <0.0001).
| Abnormal Values | Stress Test Results Abnormal | Sensitivity | Specificity | PPV | NPV | OR | 95% CI | p Value |
|---|---|---|---|---|---|---|---|---|
| Low AHCPR risk | ||||||||
| NT-proBNP | 3/21 (14%) | 37.5% | 82.3% | 14.3% | 94.5% | 2.87 | 0.63–13.09 | 0.160 |
| Cystatin C | 3/8 (38%) | 42.9% | 94.6% | 37.5% | 95.6% | 13.05 | 2.27–74.90 | <0.001 |
| Either | 5/23 (22%) | 71.4% | 80.8% | 21.7% | 97.4% | 10.56 | 1.89–58.86 | 0.006 |
| Intermediate AHCPR risk | ||||||||
| NT-proBNP | 13/29 (45%) | 59.1% | 68.0% | 44.8% | 79.1% | 3.07 | 1.09–8.66 | 0.032 |
| Cystatin C | 6/19 (32%) | 30.0% | 72.3% | 31.6% | 70.8% | 1.12 | 0.36–3.54 | 0.845 |
| Either | 14/35 (40%) | 66.7% | 55.3% | 40.0% | 78.8% | 2.48 | 0.845–7.25 | 0.094 |
| Overall | ||||||||
| NT-proBNP | 16/50 (32%) | 53.3% | 77.9% | 32.0% | 89.6% | 4.03 | 1.79–9.09 | <0.001 |
| Cystatin C | 9/27 (33%) | 33.3% | 87.1% | 33.3% | 87.1% | 3.36 | 1.31–8.62 | 0.009 |
| Either | 19/58 (33%) | 67.9% | 72.3% | 32.8% | 91.9% | 5.52 | 2.30–13.24 | <0.001 |
Further analysis divided the 189 patients who underwent stress testing by risk classification and analyzed its relation to biomarkers. In the group at low AHCPR risk (n = 101), either marker was abnormal in 23 patients. Of these, 5 patients had abnormal stress test. However, in the 78 patients with normal biomarker levels, only 2 patients had abnormal stress test results (NPV 97.4%). In this stratified group, the OR for the biomarker level predicting the stress test result was 10.56 (95% CI 1.9 to 58.9, p = 0.006). In contrast, in the intermediate-risk group that underwent stress testing, 35 of 68 patients had abnormal NT-proBNP or cystatin C levels. Of the patients with abnormal biomarker levels, 14 had abnormal stress test results, but 26 of 33 patients with normal biomarker levels had normal stress test results (NPV 79%). In contrast to the low-risk population, the association between biomarker levels and stress test results did not reach statistical significance (OR 2.48, 95% CI 0.845 to 7.25) in the intermediate-risk group.
For all patients included in the study, biomarker and MACE data were available for 332 patients ( Table 4 ). In these patients, there were 42 events at 6 months after leaving the ED (whether discharged or admitted), a rate of 12.7%, with most consisting of revascularizations. Either NT-proBNP or cystatin C level was abnormal in 26 of these patients (62%), compared to 16 with normal biomarker levels (38%). As seen in Table 4 , the association between biomarker levels and events did not reach statistical significance, regardless of risk stratification. In the subgroup of patients who underwent stress tests, there were no events in the low-risk group. The intermediate-risk group had 14 events: 7 marker positive and stress test positive, 5 biomarker negative and stress test positive, 0 biomarker negative and stress test positive, and 2 biomarker negative and stress test negative.


